Uptrend coming to an end?EURUSD failed to offer us a new higher high in this past week, doing so for therdnd time since september 2nd.
I still think its too early to predict a trend break but I feel we can start to look at this chart as a sideways movement rather than a bullish one.
Sideways

SELL THE HIGHS FROM A SIDEWAYS MARKETUse 1/2 risk.
It's a nice trading opportunity at the top of a channel.
It's a major resistance at key level 70.50.
Doji 4 Hr candle at the resistance ( it shows indecision ).
It is a risky trade though because we haven't a really clear price action but it's worth it because of the risk to reward ratio.
*If it breaks the take profit target, you can extend it!
ENTRY: 70.55
STOP LOSS: 70.70 (15 stop loss)
BE: 70.40 (15 pips profit) --> 1:1
TP1: 70.25 ( 30 pips profit) --> 1:2
TP2: 70.10 (45 pips profits) --> 1:3
HAVE FUN & HAPPY PROFITS ! ! !

Side Way #ETHUSDTYou see a #Support on level 0.786 at candles "25 Oct" , "24 Oct" & "23 Oct" at #Fibonacci
as last post that i showed a #Resistanc on level 1, in this level(0.786) we have also a #Support.
it means market trends is going to move in a range side and if level 1.272 be broken, the market trend will reach to level 1.272 in price 428.61
___________
Indicator: Fib Retracment
Position: #ETHUSDT
Market Condition: Side Way
Time Frame: 4h
Timezone: UTC+3:30(Tehran-Iran)

CADCHF - Second breakout idea?CADCHF is currently having a very strong acceleration that threatens the level of resistance at 0.6950.
We can comfortably place our stop entry order at 0.6955, with a stop loss below the short term resistance and the take profit applying the measured move and still get a good risk to reward ratio of 1:2.
Definitely a trade to consider.

Tari CondorHi guys!
This is 2 weeks 7% strike iron condor.
Follow the stratgey, discover your credit and max loss!
Enjoy your wallet!
Tari.

Tari CondorHi guys,
2 weeks, 8% strike, there isn't so much premium to collect,our edge is not so high, so I make a strangle, feel free to check the odds.
Enjoy your wallet!
Tari.

Tari CondorHi guys,
this is the best of the week!
2weeks, 8% strikes, implied volatilty is very high, IV rank>75, so this is a perfect scenario to trade this iron condor, because our odds match high IV. This means I feel confy highering a bit the size of the opration, usually my risk is 2-3%, this time I can risk a little bit more.
Enjoy your wallet!
Tari.

Tari CondorHi guys,
for this iron condor we have 2 weeks and 5% strike.
Reward risk ratio is quite decent, but I prefer to place a pending order to get some more premium.
Enjoy your wallet!
Tari.

Neutral or sideways, trading StrategyHi all
Kindly like the ideas if it is helping you and leave a comment
Today I want to tell you how to trade in markets that are trend neutral
Indicators you need : Bollinger Bands and Stochastic
Whenever Stochastic is in the Over Sold and Overbought area, we prepare for the position.
To get a long position:
the Stochastic must be in the over sold area. We wait for the red line to be broken by the blue line and exit the over sold area, and when it leaves, we open the Long position
When to sell? when the price hits the middle or upper line of the Bollinger Bands
To get a short position:
we wait for the Stochastic to be in the Overbought area and wait until the red line breaks the blue line and leaves the Overbought area. When it leaves, we open a short position
When to sell? when the price hits the middle or lower line of the Bollinger Bands.
Traders, if you liked this idea or have your opinion on it, write in the comments,We will be glad.
Thank you for seeing idea . please support us
Good luck.

possible btc path short termwith weekly close looming after the consolidation. I guess there is probably something along the lines of an upward hunt or trap. followed by a pivot test downward and potential break that fills lower gap with is the bottom of linear regression channel. This could also have a dump to 10.8 before weekly close. test the pivot around mid 11s again and then follow up with the lower gap fill as well. its choppy here. so be careful

Sideways Range ContinuingThis is an interesting market and a market where caution is probably best.
Whilst it is pretty clear we have a range and sideways move in play, there are a lot of traps and false moves occurring within it.
This means that whilst price may respect a support or resistance, it is making a false break higher or lower first.
The other reason caution may be best is because we have signs of momentum to the upside with a bottom pattern on the daily chart, but price is running directly into the major resistance level.
It could be best to watch this level for the next price action clue.

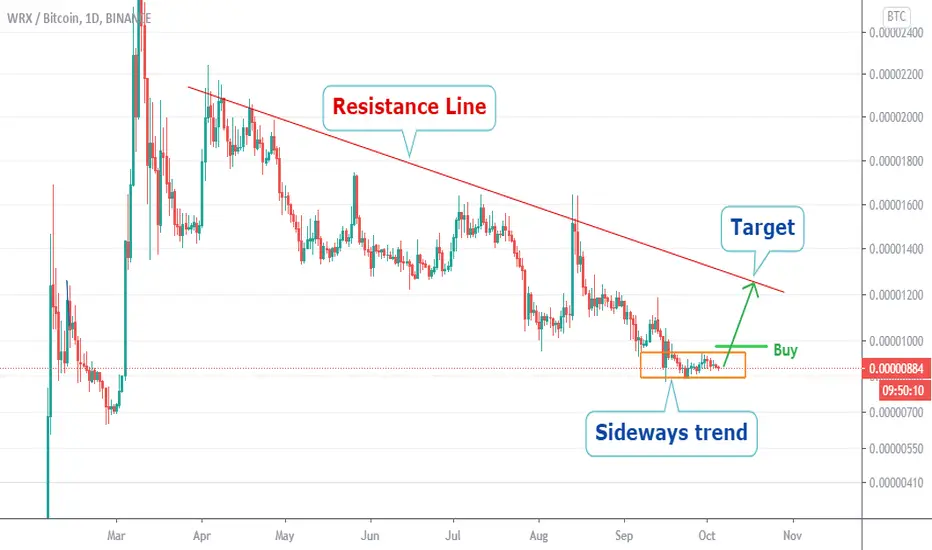
WRX sideways accumulationHello, traders.
We are on what we call of sideways movement for WRX, but the price is down-trending so, we going to put our buy orders above the sideways zone, and the target will be the next resistance line.
Good Luck.
WYNN Long, at sideways bottomIdentify Price action:
1. Sideways;
2. Aggressive move;
3. Sudden Reversal;
Current price is at bottom of sideway range.
Entry 73
Stop 67
Target1 90; reward:risk=2.5:1
Target2 106; reward:risk=5:1
I am not a PRO trader. I need few months to practice trading strategies.
If you like this idea, please use SIM/Demo account to try it, until my trading plans get high winning rate.

Sideways ?Volume drop may be a sign for sideways. Blue line represents possible supports\resistances based on fibo levels (connected to 28th evening high and low) and ichimoku cloud form on 1, 2 and 4H timeframes. SL at 0.039 USDT

Banknifty Possible Targets for the October 1st WeekBank nifty is trading with comforts to distribute sums . Now the much depends upon it to continue the trend or give whipsaws, as for the technicals market has kept bearish view even though a more U shaped recovery to say. However what we notice is that if the U shaped recovery was itself weak then BN would have weaker retracement .232 possibly. Thus a very reasonable target on upper side and more bias towards downward spiral. However we feel a sideways movement would be warranted for the coming week as a cooling off week.

as I Expected OIL Made Sideways Trend and Sideways Continuesthe detail is shown on the above Idea.
in the previous Idea, I expected that oil had a sideways trend and now this trend Continues to Break Wedge.

FCPO TRADING : 172) sideway or slowly upthis is haidojo and the number is 172...
after some bearish-engulfing pattern in candlesticks yesterday dan a fall close to 70pts. Today, fcpo-dec resumes its fall to close to 2900...
however, it is still indecisive whether the market has reversed its trend or juz a mere correction after hitting a major resistance region of 3100-3130...the support of 2800 must be watched closely...it is the main-marker to decide whether the market is bullish or bearish...
higher resistance : 3100-3130
immediate resistance : 3030
support : 2900
WARNING!
RISK DISCLAIMER : this is juz a trading idea...trading stocks, futures or forex might incur a huge risk to your account/funds… DON’T LOSE MONEY THAT YOU CANNOT AFFORD …any idea(s) of trading in this episode SHALL NOT be regarded as a hint of BUYING or SELLING . It is MERELY a trading journal and it has been used for educational purpose only… trade at your own risk!
**your "LIKE" and "FOLLOW" are my main source of motivation to continue posting more valuable contents...TQ**

1D XAUUSD SIDEWAY TRADINGHello traders
looking at chart trend is still uptrend /MACD hologram,RSI 50+, Resistance was broken/ but price in sideway box. I think my advice is if you want make money gold trading wait for break box.
NEVER FORGET GOLL STILL UP TREND

USDCHF Sideways Channel USDCHF is in a sideways channel looking to fall to support and bounce to the top for a possible breakout.

Intraday Range is HoldingIn last week's trade ideas we looked at this pair and the potential for price to move into the yearly highs.
After testing these highs, price formed a daily chart bearish pin bar reversal and price moved right back into the consolidation and sideways range.
As the 4 hour chart shows; price is now hovering around the intraday support level.
The intraday charts are very sideways and whilst they stay this way trades can be hunted on both sides of the markets from the major levels.

Can Price Break / Continue This Week?Whilst price has been trending strongly higher for the bulk of this year, in recent weeks the trend has ground to a halt.
As the attached 4 hour chart shows; price is very sideways on the intraday charts.
This can be a tricky time to look for trades because inside this range is a lot of choppy price action.
The best play for conservative traders could be to wait for a breakout of these levels and to see if the trend continues which would then pave the way for long trades.
Thanks for your like and support...

Consolidation Choppy Price Action Taking PlaceThis pair has been choppy and sideways all year.
The past few weeks have been no different. After a huge daily chart bearish engulfing bar, price went right back to forming an inside bar and going nowhere.
Whilst price is very sideways there are still trading opportunities. The best plays look to be trading both sides of the market from the range high and low looking for reversals back into the range.
Thanks for your like and Support.

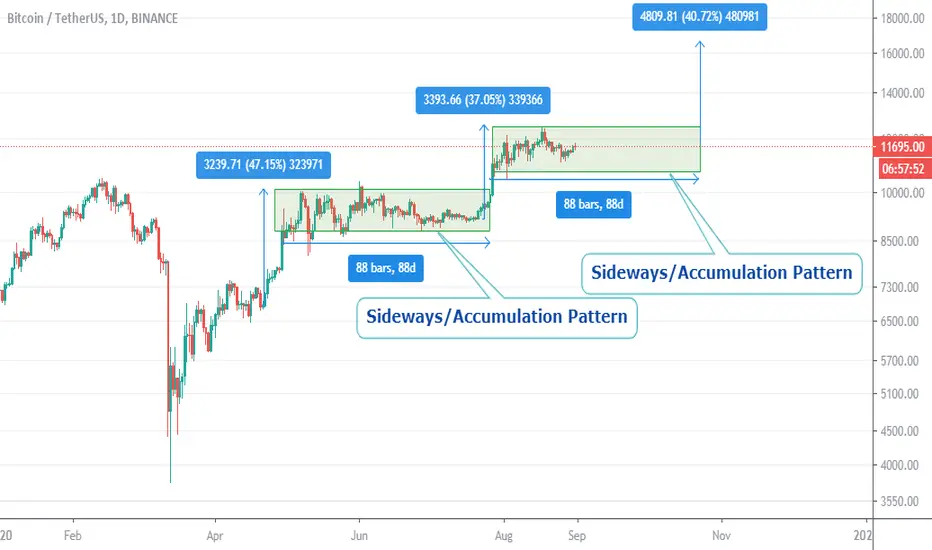
Sideways until the end of October?Hello, traders.
Today's question is pretty simple, does the history repeats itself?
Because if they do, we can predict the price more certainly about the next movement, see this example on BITCOIN:
After an almost 50% raise, the BTC started an accumulation pattern which took approximately 88 days to begin a new impulsive wave, which made the price rise almost 40%, and after that, the price started a new accumulation phase that is happening right now.
So if the history repeats itself, we can expect another big sideways movement until the end of October.
And another 40% - 50% rise is expected.
Best Regards.