Expiry sidewaysAs discussed yesterday, expiry seems to be sideways and giving opportunity on both sides, these kind of days are not good for option buyers but sellers enjoy them. However, if you are a good trader you can always scalp for few points on both sides.
Nifty is still getting dragged by BNF, it would be interesting to see what happens on Friday, I'm expecting again significant bearish move, even if it opened gap up.
Sideways

Trade Log NIFTY July 10In my yesterdays post I had said
Even though the chart looks good, I have a bearish bias for tomorrow and Monday. This is mostly because the whipsaw we saw yesterday. If NIFTY manages to close above the new high by Monday, I’ll be wrong again.
I’ll not short, but mostly observe if it crosses 10850. I’ll short NIFTY below 10730.
Nothing changes in my view and I carry forward my view to Monday.
My trades
I did not trade today, as none of the levels I was watching were clearly broken.
Observations for the day
NIFTY sideways for the day, ultimately closed 0.42% down.
BANK NIFTY down 2.22%.
VIX mildly up 0.12%
Advance Decline ratio is 14 to 36, in line with negative closing.
Option data tilted for mild bearish bias.
Overall, NIFTY did not do badly because of Reliance. BANK NIFTY trend is near bearish, NIFTY sideways for near term. NIFTY’s consolidation can be an intermediate topping pattern or consolidation. It can be confirmed only when NIFTY closes below 10560 levels.
I’ll do a detailed post over the weekend on my next week’s view.
Have a great weekend ahead!
----------------------------------------------------------------------------------------------------------------------------------------------------------------------------------------------------------------------------------------------------------------------------------------------------------------------------------
My July 9 Post

Day trading and Scalping Example NIFTY July 8I use multi time frame analysis very heavily. I always establish context for trading before I start the day. For context and levels, please check the following posts prior to July 8 *** Links Below
I am always fascinated by day trading - not because of the lure of quick money. But I think it is extremely hard for me. At least it is hard for my personality. It is always said there are two kind of traders
1. Traders who can think very fast
2. Traders who can think very deep
I always see myself comfortable in category two - deep thinker. But to put myself out of my own opinion's prison - I day trade.
Though day trading is hard, it teaches many things to me as a trader.
1. Emotional Control and Money Management - I don't have time to adjust , reflect back and somehow prove to myself that I am on the right side. I better quickly exit of my positions with great emotional control.
2. Relentless Planning - Since I don't have lot of time, I have to plan insanely - thinking of all possibilities and my actions.
3. NO to laziness - I cant afford to relax during the day session. I need to have extreme clarity of thought throughout the trading session.
Now, one may think that all these learning can be from any time frame trading. That's true. But when you have a ticking clock next to you and market presenting you 1 of n possibilities every single candle, that changes you for good. It makes you fast. Then you can adjust to larger trading styles easily.
Below is my example live thought log for the day. I escaped the day with approx Rs 34 / lot profit. Not a bad hunt after crazy price movement!
----------------------------------------------------------------------------------------------------------------------------------------------------------------------------------------------------------------------
NIFTY chart is extremely positive. Market looks prime for 11000, but global clues soft. Typically, such setups if bullish do not give chance to enter, starts with gap up. If there is no gap up it may be contra indication for sideways movement for the day. Since it is Wednesday , 1 day prior to weekly expiry, it is better to sell options and scalp premium.
Risk : large volatile movement. Stop Loss, opening ranges of 1 st hr. Close positions starting from 1:30 PM.
--------------------------------------------------------------------------------------------------------------------------------------------
1. Expectation was rally. But flat opening. Global markets are soft. Hence I sold 9300 CALL. Idea is to cash in Theta loss for the day in case of sideways movement. It is a risky trade.
2. Candle at 9.30 starts confirming this movement. Let this movement complete.
3. Any close below Previous day High, position can be added to.
4. As yesterdays high shows support around 10800, 10700 PUT is sold as well. Again Idea is to get benefitted by sideways movement and theta decay.
5. Overall position entry is now 33+30.30 = 63.30 Rs.
6. Since breakout failed, now NIFTY likely to stay in the range. So 10800 CALL sold 68.05 Rs.
7. So far trade is going ok. definitely signs of consolidation. BANK NIFTY broken out, NIFTY lagging.
8. Position 10700/10900 Strangle : 66 Rs (3Rs loss)
Position 10800 Call : 74 Rs (6 Rs loss)
--------------------------------------------------
9 Rs Loss
9. Position 10700/10900 Strangle : 65 Rs (2Rs loss)
Position 10800 Call : 56 Rs (12 Rs Profit)
--------------------------------------------------
10 Rs Profit
Going as expected. On breakout of the opening range Another short added 10800 CALL 56
10. Opening range breakout failed. 10750 PUT sold, Now look for opportunity to reduce position on 10800 CALL as breakout failed.
11. Usually NIFTY may jump around after 1.30. VIX did not decrease so far. So NIFTY players sense uncertainity at these levels.
Closed 10800 1/2 position.
Position 10700/10900 Strangle : 56 Rs (10Rs Profit)
Position 10800 Call *: 62 (6 Rs Loss)
Position 10750 Put : 46 (3 Rs Profit)
* Position 10800 CALL : (68-61) (7 Rs Profit)
--------------------------------------------------
7 Rs Profit / 7 Rs Booked Profit = 14 Rs
12. The price range is getting tighter. NIFTY advance decline is 25 to 24 Neutral.
13. As Expected move started. How strong the move to be seen. 10800 PUT sold as initial direction of the move crossing the range. VIX started cooling off
14. Break above range is not showing strong follow through so expansion attempt is not rapid. That is a good sign for my trades.
Position 10700/10900 Strangle : 50 Rs (13Rs Profit)
Position 10800 Call : 74 (18 Rs Loss)
Position 10750 Put : 31 (18 Rs Profit)
Position 10800 Put : 50 (4 Rs Profit)
* Position 10800 CALL : (68-61) (7 Rs Profit)
--------------------------------------------------
17 Rs Profit / 7 Rs Booked Profit = 24 Rs
15. NIFTY is showing many indecisive moves. It is above previous day high. Essentially, the morning down move can be negated and fresh up move possible tomorrow.
It is 2.20 PM so 1 hr to go in trading. Priority will be to close short positions first. Then Long ones.
Closed 10800 Put : It was latest and more prone to loss.
* Position 10800 Put : 49 (5 Rs Profit)
16. NIFTY dipped below Previous day Low. Now NIFTY can again go to 10800
17. Actually large moevement at 2.30 PM. Closed the positions. Final tally is
Position 10700/10900 Strangle : (63 - 45)(18 Rs Profit)
Position 10800 CALL : (68-61) ( 7 Rs Profit)
Position 10800 CALL : (56-55) ( 1 Rs Profit)
Position 10750 PUT : (49-46) ( 3 Rs Profit)
Position 10800 PUT : (54-49) ( 5 Rs Profit)
------------------------------------------------------
34 Rs Profit
-------------------------------------------------------------------------------------------------------------------------------
Retrospection :
-ve's
1. Position of 10800 PUT sell was not a good position to take, it was more like a balancing previous position.
Better option would be to just square off 10800 CALL position for loss.
2. Entry for 2nd position on 10800 CALL could have been better. Also it was not correct with original sideways assumption.
+ve's
1. Traded as per the plan.
2. I was able to close everything fast enough before the volatile move.
Reference
Monthly Analysis
Weekly Analysis
July 7 Log

Consolidation period is over for KMDHello, traders.
KMD/BTC seems to finish the consolidation period. This movement is a sideways trend on the daily chart. Between these two important support and resistance points, it is a no trend zone, but after yesterday's movement, we believe the price is heading up to test the next important resistance level on the uptrend direction.
Push the like button and follow us on TV.

Potential breakout and breakout and re-test tradesWatching for Breakout
AUDCAD has made a huge rebound higher before making a sideways move in more recent times.
As the daily chart shows ; in recent sessions price has consolidated and moved into a box pattern.
If we can see this box breakout inline with the previous momentum higher it could see the next leg higher continue.
This could also pave the way for potential breakout and breakout and re-test trades.

TRX sideways or bullish? What is your opnion? Hello, Traders,
TRX/BTC is inside accumulation box on the daily chart, but the important support levels it seemed that it held the price very well above this level and, now the bulls are trying to take control of this asset, what we can expect for this asset?
Will the price continue in a sideways trend or will it revert to an upward trend? I think it's too early for us to know
To state more accurately the price would have to break the region of 200 satoshis and make a Pull back on the support, in that case, the upward trend would be quite clear in my opinion.
Push the like button and follow us on tradingview.

I am just waiting for the bearsAgainst 108.20 the USDJPY should fall in the next movement of wave (iii). The momentum should come and the target could be 106 or more.
There are two strategies, before the break(aggressive style) and after the break(conservative style). At the moment I can say that the price must not go above 108.20!
Important
Always use stop order, cutting losses, this is one of the essential elements of your risk management and if you would like to be an independent investor then you must be the master of risk management.
Disclaimer
Reserved the right to make changes the content on this analysis at any time without notice and is provided for the sole purpose of assisting traders to make independent investment decisions.

Sideways in actionNext wave down should come in the process of wave B after moving sideways. I am waiting for a false break upward from the narrow sideways then after the target is at 1.2350.
There are two strategies, before the break(aggressive style) and after the break(conservative style). At the moment I can say that the price must not go above 1.2530!
Important
Always use stop order, cutting losses, this is one of the essential elements of your risk management and if you would like to be an independent investor then you must be the master of risk management.
Disclaimer
Reserved the right to make changes the content on this analysis at any time without notice and is provided for the sole purpose of assisting traders to make independent investment decisions.

Stay out of chats like this!Hello, traders.
See how many times the price has made traps for the buyers, this happens in assets with low liquidity, and a big player sell order can bring down the price considerably.
I recommend everyone stay out of assets with charts like these.

Dive in the deep
After a long rising in a five wave structure and run into the wall of 0.7070(as I was expected this in the related idea) it seems the price should fall into the deep by a corrective wave.
Not to mention that the rising trendline is about to break down. So I'm waiting for the breakdown and an accelerating decline.
There are two strategies, before the break(aggressive style) and after the break(conservative style). At the moment I can say that the price must not go above 0.7070 adding it that there is not to much space for further rising.
Important
Always use stop order, cutting losses, this is one of the essential elements of your risk management and if you would like to be an independent investor then you must be the master of risk management.
Disclaimer
Reserved the right to make changes the content on this analysis at any time without notice and is provided for the sole purpose of assisting traders to make independent investment decisions.

USD/JPY side ways.USD/JPY is moving side ways from March 30th 2020, with no clear trend for buy or sell.

Sideways moviment on RVN/BTCHello, traders!
RVN is inside a big accumulation pattern after the price brokes down an important support level, this could be a bearish accumulation pattern or a sideways movement, and in a moment like these, we don't try to guess where the price is gonna go but react of it, so we will wait for a better confirmation, besides that we are in the middle of the pattern.
Push the like button and follow us on TradingView.

EURUSD: New safe haven against major pairs?This morning, I saw an educational video from transparent-fx and showed that the EURUSD is shaping an inverse H&S in D chart and indeed it is. Besides, in the H4 chart it comes from shaping a non-inverse H&S what makes you realise that the pair is experiencing a sideways movement since June 8. If the figure is finished, by June 30 EURUSD could reach 1.14. In addition, fundamental readings have been quite strong, coronavirus is contained in most of the european countries and even though Germany has seen a surge in covid19 cases, Merkel is still the Chancellor so she knows how to deal with this. On the other side of the Atlantic, US and Latin America are not improving which is why investors are running away from america (which has recently seen a spike in bankruptcies filing in the past week, 13-20 June) and embracing euro as the only safe currency since Japanese yen lost that condition when covid19 outbreak sparked the markets around Feb 24. So EURUSD might be the safest currency (inveur, investing.com's euro index is staying around 101, highs not seen since 2014) for this summer-autumn only, until everything drops down again.

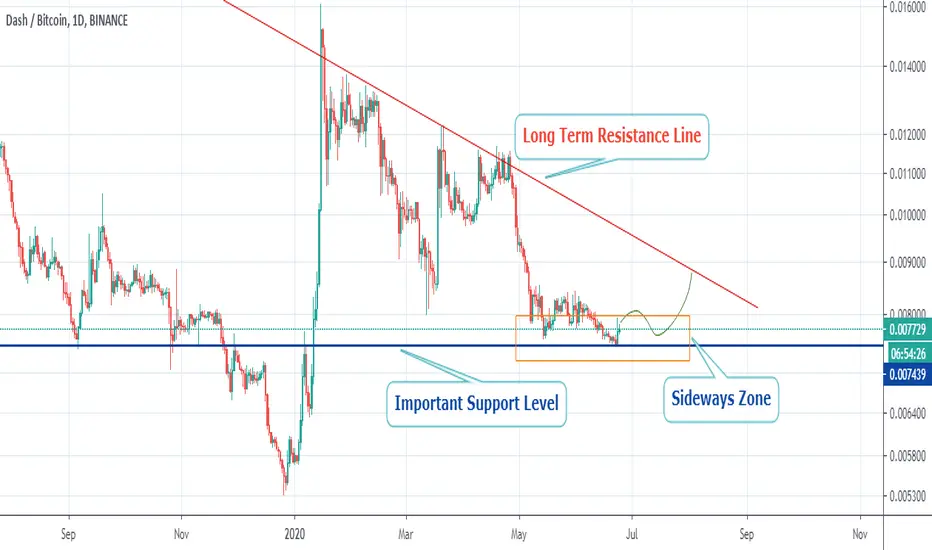
Trading Idea on DASH/BTCHello Traders,
For DASH, we are below the long term resistance line, so the scenario is bearish for this asset in the long term until we are below that line.
In the short term, we felt the support level at the blue line.
This can give the bulls a try to take the price to the resistance line, but the movement is weak
I bet that we can stay inside a sideways movement for a little longer
above 0.0080 will start to look bullish once again
Push The like Buton and follow us on tradingview

Indra: Seizing sideways momentum call opportunity?Indra is moving inside a lateral channel with a slight bearish trend. In the last days there have been good news about projects that are being signed (i.e. Defense, Ireland) but it looks like global pandemic situation is making investors undecisive whether to hold positions on the stock or withdraw. Lond term trend is clearly bullish. The company was planning to get back to dividend payments suspended back in 2014 and now due to covid19 it has left this topic in standby. The truth is that if I think markets are going to throw-back around July 14, IDR may not have time to do its last swing and may go further down to levels seen in 2012. However, if tomorrow decreases a sharp 6%, depending on the global market news we might experience a rebound on Monday or a continuing decline until 6.395€, the base of the slightly bearish channel. So we must be very focused on what happens tomorrow in macros, news, covid19 new outbreak and market sentiment and operate consequently. On the weekend there might be as well some news or none that may affect the global stockmarket sentiment. One thing is for sure: There is a lot of volatility and one could benefit or lose with it.


EUR/USD trending sideways for now. We are stuck trending sideways, and I fear its for the rest of the week. I am hoping we get confirmation tomorrow. Friday trades are super risky. If you notice my two yellow trend lines fall right on the fib retracement lines. We are looking for a break beyond either one. I'm leaning neutral but expecting bulls soon.
Keep in mind that there will be a huge USD deflation coming. This will be a bull year for the EURO, BUT if we break down below 1.11914 a new analysis will have to to considered
OANDA:EURUSD
I upload signals almost everyday, If you want to get daily signals remember to FOLLOW and turn your NOTIFICATIONS ON! 🤗 TELL ME YOUR FAVORITE CHARTS! I'M BRANCHING OUT!
You can always show your support by liking, following or commenting! Much love to all, have a great day traders!
Disclaimer
The material and information contained in this analysis is for general information and educational purposes only. You should not rely upon the material or information on any of my analysis as a basis for making any business, legal, or any other decisions.

NIFTY - Stucked in 300 points rangeNIFTY is trading in a 300 points range from past 3 trading sessions.
Range : 10030 - 9730

EUR/GBP - EASY TRADES | TEXTBOOK RANGE-BOUND ACTIONChart is self-explanatory, play until stopped out or daily close outside of range.

How to trade SP500, SPY in the current market- SPY likely to trend sideways 280-290 in short term.
- Current level is perfect to short.
- I am bearish on the stock, on the fundamental level, at least until 2021. However, there are political forces at play that are keeping the market up.
- Always bullish for the long term, however.
- This neither a bear market nor a bull market.
- I am pessimistic on the short term outlook, yet I still believe that certain forces are still able to hold the price at current levels, thus I am expecting the SPY to move sideways.
- Sideways means buy low, sell high? No, since I am bearish, I will only sell high(~290), take profit low(~280). But I will not buy near 280.

Bitcoin 50/50 TriangleAt Bitcoin, the next few days will be decided in which direction to choose. In the picture you can see Bullish triangle with a target around 11500$. To fulfill this scenario, BTC must still fall into zone 9250$, maintain it as support, and bounce toward UP. The bearish scenario is that the BTC falls below 4H BK231 (marked in orange), falls out of the triangle, and falls to a value of about 7,300$. Bitcoin would lose the bullish momentum and could gradually fall even lower. Currently it is 50/50, as BTC is located in the sideways structure.
Do not forget check out our Active trades ;)

EUR/USD RANGEBOUND CONSOLIDATION ZONE
Expectation for price to trade between boundaries until breaking out.
Place stops outside these boundaries with adequate room.
VERDICT:
Short-term: Price will carry momentum downwards to test the lower boundary.
Medium-term: Sideways trading between zones.
Long-term: Lower boundary will give, with price heading lower.
