(D) Treading range (10,P pivot). Chop till ema50 is less flat.Divergence from minor bullish channel. Follow your rules.
Sideways

HO sideways or retracement lowerGood opportunity to sell some upside calls or call spread, above 1.60 strike for sideways or correction lower IMHO
Targets on downside middle BBands and lower trend line (orange).
(Time frame next 5-10 trading days)

(DE) Test ema50 support for 3rd time; bottoming process.If bullish, may retest resistance near R1 pivot. OBV has formed a local bottom and MACD and RSI confirm bullish price action. Ema50's slope is nearly flat and price has been lingering near it the previous 4 days.
However, if surprisingly bearish, then it may have a support retest near S2 pivot.
Stalk your entries and obey your rules.

(D) MACD and RSI rolling upwards. OBV resistance testSupport near 95 and ema50 but magnetized to its P pivot. If bullish momo continuation, a pop back into the mild bullish channel before testing resistance of R1 pivot or 100. Obey your rules.


What is next for the S&P 500?? Now that the S&P 500 closed out 2015 with an annual loss, you are bound to hear all kinds of dire predictions about the market’s fate for 2016 and beyond. My focus is not weather the dire predictions are true or false. My focus is on the explanation and a visual representation of where some of the predictions may come from. The S&P 500 closed the year down 0.7% at 2043.94. But I can almost guarantee that someone will call for a drop to the 1800 level. Could it happen? Sure. Anything is possible. The chart in this idea should show you why.
Let’s take a look at this weekly chart of the S&P 500. The first thing you should notice is this chart has two uptrend lines. I have labeled them UT 1 and UT 2. UT 1 is an uptrend line that starts back in 2009. UT 2 is a steeper uptrend line. I drew this uptrend line on the chart so you can see that the S&P 500 began going up quicker in the second half of 2011. It continued at this new pace through the first half of 2015. But that is when the big picture changed. Take a look at UT 2, in mid August is when the S&P 500 crossed below UT 2. Just as interesting is that the S&P 500 has stayed below UT 2 since then. Since the candles are no longer following the uptrend line, UT 2, many wonder if they are following a downtrend line. I have drawn a red downtrend line at the top of the candles. It seems the candles are following DT 1 for the time being. And since the S&P 500 is below UT 2, one might consider the possibilities that it could come back to UT 1. Hence the 1800 estimate you may read about in the coming days & weeks.
Now that we have established how low the S&P 500 might go, let's talk about a couple more possibilities. What if the S&P 500 goes sideways for some time? Actually, it has been going sideways if you look at the chart the right way. Since mid 2014, the S&P 500 has closed above 1920 ish but below 2125 ish every single week except 3. So it is pretty safe to say the S&P 500 is going sideways, albeit in a fairly large range. If you see this sideways action continuing, a great investing strategy will be to go long in the low 1900's and sell (or get short) around 2100.
What if the S&P 500 gets above the red downtrend line, DT 1, and then sets a new closing high above say 2135? Well some will say the S&P is going higher. How much higher? I surely couldn't tell you. But at that point, I would agree with them and I would get long (if I wasn't already).
So let's recap real quick.
1- You might hear that the S&P is going down to 1800. And it might because that is essentially where UT 1 will be in the near future. If the candles stay below DT 1, it may be time to be short.
2- The S&P has been going sideways for a year of so. You can try to initiate longs when it is in the low 1900's and initiate shorts around 2100.
This will continue to work as long as the market continues going sideways.
3- When the market closes above 2125 (top of the sideways channel) you can start looking for a close at or above 2135. These new highs could be an indication that the market is headed higher. It may be time to get long at that point.
Thanks for reading!
Limit your risk. Protect your gains.
Trade what you see. Not what you think, or feel, or hope, or…

Bitcoin Bear and Bull Fractals at Crossroads AgainBears:
Bitcoin is showing weakness with a double top at $475-500 and H&S formation as well. A move below $400 on Bitfinex will confirm the bears taking over and a potential revisit of $340-350 and even $315.
Bulls:
If we manage to hold above $400 then we will stay in 2 weeks of sideways and consolidation and break out after January 15th towards new highs of $650-680
Note: Any bad news e.g. BitcoinXT Fork etc. can wick down Bitcoin to $275 then shoot it back up.
Donations: 1Kbfudifg5n9DtpYymcL3E8pE2oX4Vq7CG
Bitfinex Signup: www.bitfinex.com
Okcoin Signup: www.okcoin.com
Follow me as well on Twitter see my profile for more info..

EURUSD - Trading SidewaysThe EURUSD started trading sideways. A Symmetrical Triangle can also be drawn on H1 and H4 charts of this currency pair. Considering this, would be pretty hard to determine what is the next move. I would wait for a break outside the range between 1.1214 - 1.1114. A break above the resistance would signal a rally for which I have as a target the area around 1.1300. A break below 1.1114 would signal a drop towards 1.1000. I tend to believe in a down break towards 1.1000 in the next couple of days.
For intraday trading lowering the time frame might help.

SPX is in a congestion phase and should restest the lowsIn these time of uncertainty, it is very difficult to take a position on the equity markets.
I still think there is no reason to have a bigger correction than the one we have known in August, but I believe the market has to retest the lows before rallying again.
I think several scenarios/events could hit the market before the end of October. (2 possible FOMC surprises in September/October, China issue,...) I do not know where the bad/good news will come from, but we can feel the market is waiting for it, and this is materialized by the congestion/sideways market we are experiencing today.
Technically, a congestion after a fall leads often to another fall. For the Eliott's wave amateurs, remember that in a correction we have 3 waves, a, b, c. I am waiting for the c wave. I could be wrong, I do not think we can predict the future with the charts, but there is a certain logic when we look at the past (I refer to 1987,1998 and 2011 corrections).
So as I actually do not want to take a decision now, I'll play the retest and I would aggressively buy in the yellow zone if we hit it.

FX CHART OF THE DAY: USDCHF RANGEBOUND TRADINGUSDCHF has been trading laterally for some time now and no sits right on its weekly (120-h) mean. There is no apparent expansion volatility (measured by 3.2 st deviations) and there is no apparent slope of the mean.
As there are no significant news (calendar events) coming out on the USDCHF today. traders can pick trades both ways, betting that the price will keep reverting to the mean from its 1st standard deviation
Each new approach to the border of the lateral range is a risk of breakout/breakdown, so traders should not forget putting their stops close to relevant peaks/lows.
When price approaches the 1st standard deviation next time (either above or below the 120-H mean) It is also critical to watch out for volatility expansion (the 3.2s, red on chard), that will signal that the price is ready to break out / down from its lateral range.

XAUUSD: Bullish Bat Pattern w. Multiple Ways To Trade It Bullish Bat Pattern here on XAUUSD that's looking to be putting in a double bottom at the completion point. (You may hav eone already on the LTF). I say looking because on this 4hr timeframe the current candle won't close for another 2 hours or so and as we all know the close is very important to the story that the market is telling us.
If you take a look at the "A" leg for a second you'll notice that Gold has recently been in consolidation since the end of March and with the recent HHHC, there's certainly the chance that we could see a breakout of this sideways action.
Yes the USD is very strong and any bit of positive or "as expected" news is going to strengthen it even more. But the technicals are the technicals. With a light news day today, we may see enough relief to hit our small counter-trend targets before Thursday's & Friday's big releases come out.
Akil
www.TradeEmpowered.com

Anticipatory layout with important trend lines, levels, timefibsWe might be cought in sideways within the red channel for another 20 days.
I look at the Willy or MAGNUS™ indicator and compare it to a similar situation we had a couple months ago.
The yellow box had some rangebound action in it with a little breakdown in the middle ( just like we had it now ).
The question is what will happen after the yellow box? The red box like last time?
Then we will definitelly see 280 again.
Or if 320 holds (looks like some strong demand is sitting there),
we'll see another pump like seen in the last green box !
Also check out the time fib analysis :
0.382 & 0.618 were important points in time, so 1 will probably be important too! Likely a major low/high in price.
The target for a bullish move is the thick blue dashed line, which is this years top resistance trend line. You can expect sellers there.

Waiting for Santa...This market has been god awful boring (for Bitcoin that is) for quite a while. Quite frankly I have not been charting it as much during these past few months. I think my brain has just drained all the TA information as I picked up such terms as float, degree of operating leverage, days sales outstanding, covenant et. al. In any case, Bitcoin seems to be just about as active as I am in charting. Sure a little volatility here and a price spike there, but there is no definitive trend to be seen in sight for the near term.
Now, what I really want this Christmas is for Santa to come down the chimney, hack onto people's laptops; phones and desktops and start buying up some Bitcoin. Lol, like that will ever happen... one can only dream right?
The more realistic scenario is giving through the tunnel of tranquility. I think Bitcoin wants us all to take some time off away from the charts. Then while we are not looking... BAM, it roars back to life.
Indicators
* PSAR - for now it says SELL, but I think it will turn around here soon if we keep on cruising at the same speed down this highway.
* RSI - As I said on the chart it seems it has never quite hit Overbought for very long. Seems to be that we have acquired some unsure badgers.
* Stoch - Does what it wants and says it wants to go down again. Likely will but it already is below 50 with moves that are hardly budging that I do not expect any more movement down that is significant.
I guess the targets are on the chart. IDK I sort of half @$$ them.
On the very short term I see 347 being a target or at least the body of a candle.
I also got a little bored and decided to draw Santa in a sleigh. Merry Christmas (or Happy whatever you celebrate) and Happy New Year.
I'll be going over some TA again as I think it dissolved from my brain while I was away.

long sideways bearishSeen some bearish movement yesterday, I think the market will keep sideways until mid-day, m15 entry 105.693, expecting 3.88 r/r, kinda risky, but possible considering the nature of the market as it is right now, supports are OK
please consider adjusting the risk to your preference

EURUSD AB=CD completedIt took 10 days to reach the predicted level but it's finally where I said it would go. Price failed to close below and will most probably go sideways between previous support level (now resistance) and current support around 1.2628.
Don't rush into trading this pair yet, observe and once it closes above or below one of these levels you can decide.

EURUSD - Nice Price ActionEURUSD corrected, finally. At this point is moving sideways between the 100 and 200 EMAs. Keeping in mind that the main trend is down, we could expect a fall back to 1.3400. Only under this round level I would think that a new low could occur.
Though the trend is down, I am expecting another rally. A break above 1.3450 and a close above the 200 ema would confirm my theory. In this case my first target will be 1.3470 and the second 1.3500.

[ SIDEWAYS ] - Fibchannel + Timefibs
Carefully adjusted fibchannel and timefibs.
Allignments of price and fib channel are marked by yellow lines (scale out to see more allignments)
0.618 - 0.764 time fibs mark a potential breakout area.
Next weeks I expect moves within the red diagonals, less volatility, smaller trend angles on downmoves, short: sideways.
So moon rally likely to start in august.

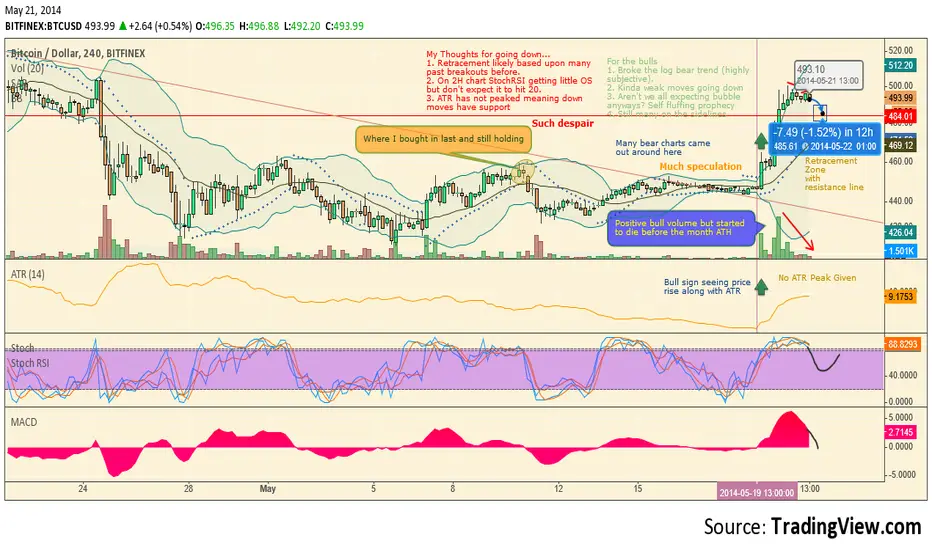
Going Sideways Likely - The Next 24hrs are Going to Be Critical!Title is sort of a joke since you see that all the time in the Bitcoin community. lol
So the waves were in play this whole time. I figured there would be some much quicker movements for the last C wave but this one took me by surprise.
Now onto the TA... So I have seen this many times in my years (lol not really years) trading and this has a near 95% chance of resulting in some downward movements followed by some sideways action. What I see for the bears is that retracements always happen to some extent after such a big break. Now it remains to be seen how far down we'll go. I'm assuming somewhere in the range of 490 to 481.50.
MACD looks like it will get close and cross but may just barely go under before crossing again.
Little more worried that ATR hasn't peak yet even though we are peaked at the price. Semi troubling sign if it were actually increasing at a steady rate up. For now it appears to just be flat-lining and possibly reverse soon.
Now there is more on my blog @
www.allbitcointa.cu.cc