EUR/USD BUY LIMIT / FOREX POSITIONHERE IS eurusd SIGNAL
for you guys on live trade on 15 time frame
by chart analasis and OB + fibonacci
Signal

xauusd weekly analysis
**XAU/USD Weekly Analysis**
*(June 2-13, 2025)*
---
### **LAST WEEK'S PERFORMANCE (June 2-6)**
**Price Action:**
- Weekly decline: **~2%**
- Key levels:
- Resistance: $3,355–$3,381 (61.8% Fibo)
- Support: $3,272–$3,288 (38.2% Fibo)
- Range: $3,291.50 (low) to $3,365 (high)
- Close: Near $3,310–$3,316
**Key Drivers:**
1. **USD Strength**: Fiscal concerns (Senate tax bill debate adding $3.8T debt)
2. **Reduced Safe-Haven Demand**: Trump delayed EU tariffs to July 9
3. **Central Bank Caution**: Market awaited ECB/BoC decisions and U.S. jobs data
---
### **NEXT WEEK OUTLOOK (June 9-13)**
**Critical Technical Levels:**
| **Support** | **Resistance** |
|-------------------|-------------------|
| $3,272–$3,288 | $3,370–$3,375 |
| $3,295 (SMA) | $3,381 (Key Breakout) |
| $3,210–$3,214 | $3,400–$3,434 |
**Fundamental Catalysts:**
1. **Central Banks**:
- ECB Decision (June 12) → Dovish stance = USD strength
- BoC Decision (June 11) → Rate cuts may boost USD
2. **U.S. Data**:
- Non-Farm Payrolls (June 13) → Strong data = fewer Fed rate cuts
3. **Geopolitical Risks**:
- Escalations in Ukraine/Middle East → Safe-haven demand
4. **U.S. Fiscal Policy**: Senate vote on $3.8T tax bill
**Market Sentiment:**
- **Bullish Case**: Break above $3,381 targets $3,500–$3,800
- **Bearish Risks**: Breakdown below $3,272 risks drop to $3,160
---
### **TRADING STRATEGY**
**Key Approaches:**
- **🔺 Long Setup**:
- Entry: Above $3,381
- Target: $3,500
- Stop-loss: $3,320
- **🔻 Short Setup**:
- Entry: Below $3,272
- Target: $3,210
- Stop-loss: $3,310
- **Event Hedging**: Use options around ECB/BoC/NFP events
**Risk Management Note:**
> "Gold's trajectory hinges on USD dynamics and central bank guidance. A weekly close above $3,381 confirms bull trend resumption."
---
### **KEY EVENTS CALENDAR**
| Date | Event | Impact Level |
|------------|---------------------------|--------------|
| June 11 | Bank of Canada Rate Decision | High |
| June 12 | ECB Rate Decision | High |
| June 13 | US Non-Farm Payrolls | Very High |
| Mid-week | US Senate Tax Bill Vote | Moderate-High|
---
**Conclusion:**
Next week presents a binary setup for XAU/USD:
- Break above **$3,381** opens path to $3,500+
- Failure to hold **$3,272** risks correction to $3,210
Prioritize risk management during high-impact events. The long-term uptrend remains intact but short-term direction depends on USD and central bank policy.
for intra day traders and scalpers follow the range zone

Maker (MKR)MKR usdt Daily analysis
Time frame 4hours
Risk rewards ratio =2 👈👌
Target 2400$
Now is a good opportunity to break the 1930$ resistance and reach to the next resistance area in 2400$
But if mkr can't break this resistance, will fall down to 1600$


EURUSD: Short Trade Explained
EURUSD
- Classic bearish pattern
- Our team expects retracement
SUGGESTED TRADE:
Swing Trade
Sell EURUSD
Entry - 1.1398
Stop - 1.1449
Take - 1.1303
Our Risk - 1%
Start protection of your profits from lower levels
Disclosure: I am part of Trade Nation's Influencer program and receive a monthly fee for using their TradingView charts in my analysis.
❤️ Please, support our work with like & comment! ❤️

EURNZD: Long Signal Explained
EURNZD
- Classic bullish formation
- Our team expects growth
SUGGESTED TRADE:
Swing Trade
Buy EURNZD
Entry Level - 1.8863
Sl - 1.8820
Tp - 1.8953
Our Risk - 1%
Start protection of your profits from lower levels
Disclosure: I am part of Trade Nation's Influencer program and receive a monthly fee for using their TradingView charts in my analysis.
❤️ Please, support our work with like & comment! ❤️

EURCHF Buyers In Panic! SELL!
My dear friends,
My technical analysis for EURCHF is below:
The market is trading on 0.9383 pivot level.
Bias - Bearish
Technical Indicators: Both Super Trend & Pivot HL indicate a highly probable Bearish continuation.
Target - 0.9351
Recommended Stop Loss - 0.9398
About Used Indicators:
A pivot point is a technical analysis indicator, or calculations, used to determine the overall trend of the market over different time frames.
Disclosure: I am part of Trade Nation's Influencer program and receive a monthly fee for using their TradingView charts in my analysis.
———————————
WISH YOU ALL LUCK

EURUSD Expected Growth! BUY!
My dear followers,
I analysed this chart on EURUSD and concluded the following:
The market is trading on 1.1395 pivot level.
Bias - Bullish
Technical Indicators: Both Super Trend & Pivot HL indicate a highly probable Bullish continuation.
Target - 1.1419
About Used Indicators:
A super-trend indicator is plotted on either above or below the closing price to signal a buy or sell. The indicator changes color, based on whether or not you should be buying. If the super-trend indicator moves below the closing price, the indicator turns green, and it signals an entry point or points to buy.
Disclosure: I am part of Trade Nation's Influencer program and receive a monthly fee for using their TradingView charts in my analysis.
———————————
WISH YOU ALL LUCK

NZDUSD Massive Short! SELL!
My dear friends,
Please, find my technical outlook for NZDUSD below:
The instrument tests an important psychological level 0.6040
Bias - Bearish
Technical Indicators: Supper Trend gives a precise Bearish signal, while Pivot Point HL predicts price changes and potential reversals in the market.
Target - 0.5991
Recommended Stop Loss - 0.6069
About Used Indicators:
Super-trend indicator is more useful in trending markets where there are clear uptrends and downtrends in price.
Disclosure: I am part of Trade Nation's Influencer program and receive a monthly fee for using their TradingView charts in my analysis.
———————————
WISH YOU ALL LUCK

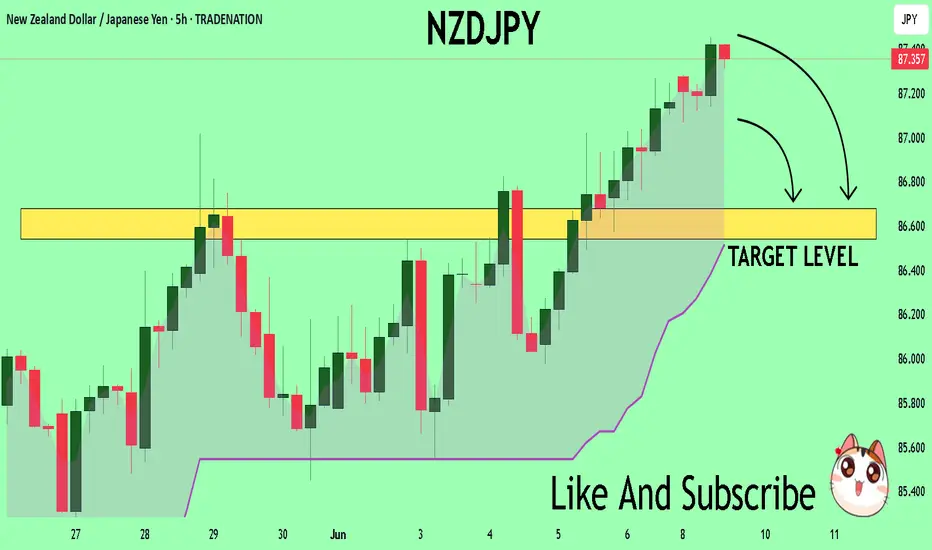
NZDJPY Under Pressure! SELL!
My dear followers,
This is my opinion on the NZDJPY next move:
The asset is approaching an important pivot point 87.365
Bias - Bearish
Technical Indicators: Supper Trend generates a clear short signal while Pivot Point HL is currently determining the overall Bearish trend of the market.
Goal - 86.678
About Used Indicators:
For more efficient signals, super-trend is used in combination with other indicators like Pivot Points.
Disclosure: I am part of Trade Nation's Influencer program and receive a monthly fee for using their TradingView charts in my analysis.
———————————
WISH YOU ALL LUCK
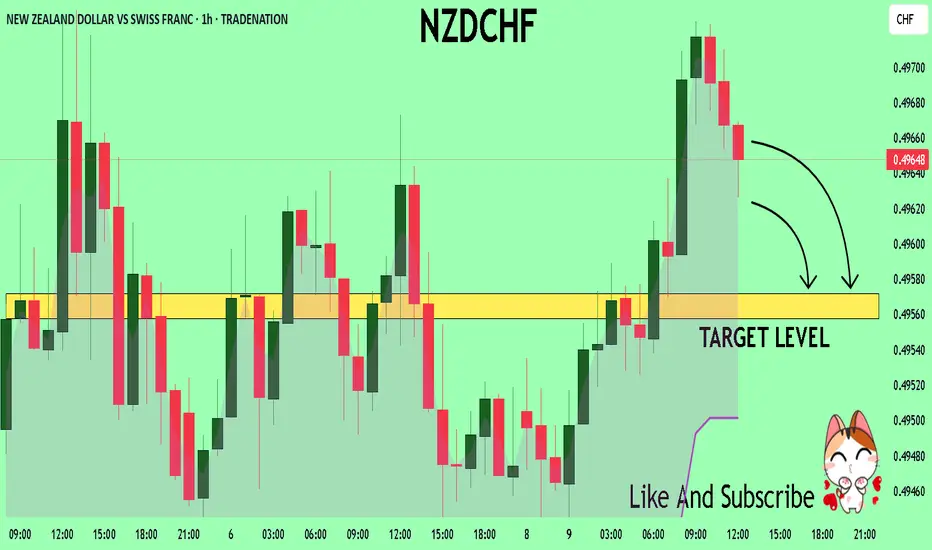
NZDCHF Technical Analysis! SELL!
My dear friends,
Please, find my technical outlook for NZDCHF below:
The instrument tests an important psychological level 0.4965
Bias - Bearish
Technical Indicators: Supper Trend gives a precise Bearish signal, while Pivot Point HL predicts price changes and potential reversals in the market.
Target - 0.4957
About Used Indicators:
Super-trend indicator is more useful in trending markets where there are clear uptrends and downtrends in price.
Disclosure: I am part of Trade Nation's Influencer program and receive a monthly fee for using their TradingView charts in my analysis.
———————————
WISH YOU ALL LUCK
GOLD A Fall Expected! SELL!
My dear subscribers,
My technical analysis for GOLD is below:
The price is coiling around a solid key level - 3321.1
Bias - Bearish
Technical Indicators: Pivot Points High anticipates a potential price reversal.
Super trend shows a clear sell, giving a perfect indicators' convergence.
Goal - 3310.6
My Stop Loss - 3326.3
About Used Indicators:
By the very nature of the supertrend indicator, it offers firm support and resistance levels for traders to enter and exit trades. Additionally, it also provides signals for setting stop losses
Disclosure: I am part of Trade Nation's Influencer program and receive a monthly fee for using their TradingView charts in my analysis.
———————————
WISH YOU ALL LUCK

NZDJPY - One More Bullish Leg!Hello TradingView Family / Fellow Traders. This is Richard, also known as theSignalyst.
📈NZDJPY has been overall bullish trading within the rising wedge marked in blue.
Moreover, the green zone is a strong support!
🏹 Thus, the highlighted blue circle is a strong area to look for buy setups as it is the intersection of support and lower blue trendline acting as a non-horizontal support.
📚 As per my trading style:
As #NZDJPY approaches the blue circle zone, I will be looking for bullish reversal setups (like a double bottom pattern, trendline break , and so on...)
📚 Always follow your trading plan regarding entry, risk management, and trade management.
Good luck!
All Strategies Are Good; If Managed Properly!
~Rich
Disclosure: I am part of Trade Nation's Influencer program and receive a monthly fee for using their TradingView charts in my analysis.

NATGAS: Bearish Continuation & Short Trade
NATGAS
- Classic bearish formation
- Our team expects fall
SUGGESTED TRADE:
Swing Trade
Sell NATGAS
Entry Level - 3.785
Sl - 3.918
Tp - 3.532
Our Risk - 1%
Start protection of your profits from lower levels
Disclosure: I am part of Trade Nation's Influencer program and receive a monthly fee for using their TradingView charts in my analysis.
❤️ Please, support our work with like & comment! ❤️

SILVER: Short Signal with Entry/SL/TP
SILVER
- Classic bearish formation
- Our team expects pullback
SUGGESTED TRADE:
Swing Trade
Short SILVER
Entry - 35.980
Sl - 36.467
Tp - 34.940
Our Risk - 1%
Start protection of your profits from lower levels
Disclosure: I am part of Trade Nation's Influencer program and receive a monthly fee for using their TradingView charts in my analysis.
❤️ Please, support our work with like & comment! ❤️

SPY Trading Opportunity! SELL!
My dear followers,
I analysed this chart on SPY and concluded the following:
The market is trading on 599.04 pivot level.
Bias - Bearish
Technical Indicators: Both Super Trend & Pivot HL indicate a highly probable Bearish continuation.
Target - 570.83
Safe Stop Loss - 616.43
About Used Indicators:
A super-trend indicator is plotted on either above or below the closing price to signal a buy or sell. The indicator changes color, based on whether or not you should be buying. If the super-trend indicator moves below the closing price, the indicator turns green, and it signals an entry point or points to buy.
Disclosure: I am part of Trade Nation's Influencer program and receive a monthly fee for using their TradingView charts in my analysis.
———————————
WISH YOU ALL LUCK

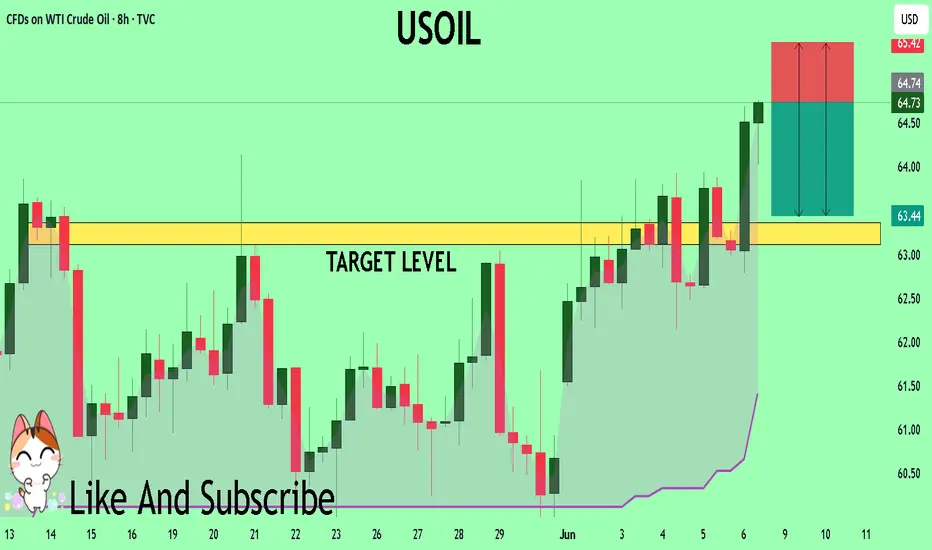
USOIL What Next? SELL!
My dear friends,
USOIL looks like it will make a good move, and here are the details:
The market is trading on 64.73 pivot level.
Bias - Bearish
Technical Indicators: Supper Trend generates a clear short signal while Pivot Point HL is currently determining the overall Bearish trend of the market.
Goal - 63.36
Recommended Stop Loss - 65.42
About Used Indicators:
Pivot points are a great way to identify areas of support and resistance, but they work best when combined with other kinds of technical analysis
Disclosure: I am part of Trade Nation's Influencer program and receive a monthly fee for using their TradingView charts in my analysis.
———————————
WISH YOU ALL LUCK
USOIL: Short Signal Explained
USOIL
- Classic bearish pattern
- Our team expects retracement
SUGGESTED TRADE:
Swing Trade
Sell USOIL
Entry - 64.73
Stop - 66.13
Take - 62.38
Our Risk - 1%
Start protection of your profits from lower levels
Disclosure: I am part of Trade Nation's Influencer program and receive a monthly fee for using their TradingView charts in my analysis.
❤️ Please, support our work with like & comment! ❤️

TESLA: Long Signal with Entry/SL/TP
TESLA
- Classic bullish formation
- Our team expects pullback
SUGGESTED TRADE:
Swing Trade
Long TESLA
Entry - 295.19
Sl - 276.74
Tp -325.39
Our Risk - 1%
Start protection of your profits from lower levels
Disclosure: I am part of Trade Nation's Influencer program and receive a monthly fee for using their TradingView charts in my analysis.
❤️ Please, support our work with like & comment! ❤️

SILVER Set To Fall! SELL!
My dear friends,
Please, find my technical outlook for SILVER below:
The price is coiling around a solid key level - 35.598
Bias - Bearish
Technical Indicators: Pivot Points Low anticipates a potential price reversal.
Super trend shows a clear sell, giving a perfect indicators' convergence.
Goal - 34.911
Safe Stop Loss - 36.515
About Used Indicators:
The pivot point itself is simply the average of the high, low and closing prices from the previous trading day.
Disclosure: I am part of Trade Nation's Influencer program and receive a monthly fee for using their TradingView charts in my analysis.
———————————
WISH YOU ALL LUCK

QQQ Will Collapse! SELL!
My dear friends,
QQQ looks like it will make a good move, and here are the details:
The market is trading on 529.85 pivot level.
Bias - Bearish
Technical Indicators: Supper Trend generates a clear short signal while Pivot Point HL is currently determining the overall Bearish trend of the market.
Goal - 521.53
About Used Indicators:
Pivot points are a great way to identify areas of support and resistance, but they work best when combined with other kinds of technical analysis
Disclosure: I am part of Trade Nation's Influencer program and receive a monthly fee for using their TradingView charts in my analysis.
———————————
WISH YOU ALL LUCK

NZDCHF Technical Analysis! SELL!
My dear followers,
This is my opinion on the NZDCHF next move:
The asset is approaching an important pivot point 0.4957
Bias - Bearish
Technical Indicators: Supper Trend generates a clear short signal while Pivot Point HL is currently determining the overall Bearish trend of the market.
Goal - 0.4947
About Used Indicators:
For more efficient signals, super-trend is used in combination with other indicators like Pivot Points.
Disclosure: I am part of Trade Nation's Influencer program and receive a monthly fee for using their TradingView charts in my analysis.
———————————
WISH YOU ALL LUCK

USDCAD Will Explode! BUY!
My dear followers,
This is my opinion on the USDCAD next move:
The asset is approaching an important pivot point 1.3654
Bias - Bullish
Safe Stop Loss - 1.3603
Technical Indicators: Supper Trend generates a clear long signal while Pivot Point HL is currently determining the overall Bullish trend of the market.
Goal - 1.3751
About Used Indicators:
For more efficient signals, super-trend is used in combination with other indicators like Pivot Points.
Disclosure: I am part of Trade Nation's Influencer program and receive a monthly fee for using their TradingView charts in my analysis.
———————————
WISH YOU ALL LUCK
