EURUSD A Fall Expected! SELL!
My dear friends,
Please, find my technical outlook for EURUSD below:
The instrument tests an important psychological level 1.1389
Bias - Bearish
Technical Indicators: Supper Trend gives a precise Bearish signal, while Pivot Point HL predicts price changes and potential reversals in the market.
Target - 1.1377
About Used Indicators:
Super-trend indicator is more useful in trending markets where there are clear uptrends and downtrends in price.
Disclosure: I am part of Trade Nation's Influencer program and receive a monthly fee for using their TradingView charts in my analysis.
———————————
WISH YOU ALL LUCK
Signal

GBPCAD: Short Trade with Entry/SL/TP
GBPCAD
- Classic bearish setup
- Our team expects bearish continuation
SUGGESTED TRADE:
Swing Trade
Short GBPCAD
Entry Point - 0.8358
Stop Loss - 0.8447
Take Profit - 0.8204
Our Risk - 1%
Start protection of your profits from lower levels
Disclosure: I am part of Trade Nation's Influencer program and receive a monthly fee for using their TradingView charts in my analysis.
❤️ Please, support our work with like & comment! ❤️

NZDCAD: Bearish Continuation & Short Signal
NZDCAD
- Classic bearish formation
- Our team expects fall
SUGGESTED TRADE:
Swing Trade
Sell NZDCAD
Entry Level - 0.8262
Sl - 0.8332
Tp - 0.8116
Our Risk - 1%
Start protection of your profits from lower levels
Disclosure: I am part of Trade Nation's Influencer program and receive a monthly fee for using their TradingView charts in my analysis.
❤️Please, support our work with like & comment!❤️

NZDUSD Trading Opportunity! SELL!
My dear friends,
Please, find my technical outlook for NZDUSD below:
The price is coiling around a solid key level - 0.5971
Bias - Bearish
Technical Indicators: Pivot Points Low anticipates a potential price reversal.
Super trend shows a clear sell, giving a perfect indicators' convergence.
Goal - 0.5847
Safe Stop Loss - 0.6013
About Used Indicators:
The pivot point itself is simply the average of the high, low and closing prices from the previous trading day.
Disclosure: I am part of Trade Nation's Influencer program and receive a monthly fee for using their TradingView charts in my analysis.
———————————
WISH YOU ALL LUCK

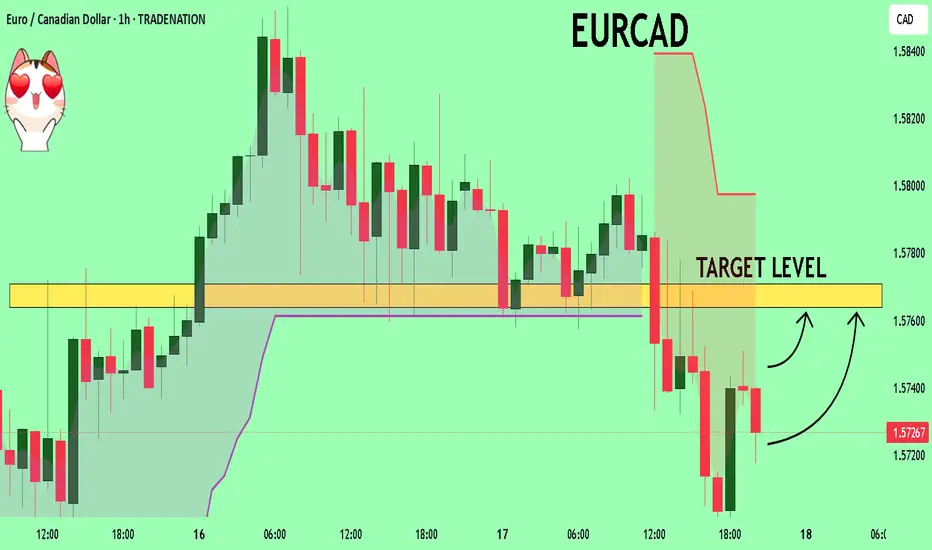
EURCAD What Next? SELL!
My dear followers,
I analysed this chart on EURCAD and concluded the following:
The market is trading on 1.5726 pivot level.
Bias - Bearish
Technical Indicators: Both Super Trend & Pivot HL indicate a highly probable Bearish continuation.
Target - 1.5763
About Used Indicators:
A super-trend indicator is plotted on either above or below the closing price to signal a buy or sell. The indicator changes color, based on whether or not you should be buying. If the super-trend indicator moves below the closing price, the indicator turns green, and it signals an entry point or points to buy.
Disclosure: I am part of Trade Nation's Influencer program and receive a monthly fee for using their TradingView charts in my analysis.
———————————
WISH YOU ALL LUCK
GOLD On The Rise! BUY!
My dear friends,
My technical analysis for GOLD is below:
The market is trading on 3327.7 pivot level.
Bias - Bullish
Technical Indicators: Both Super Trend & Pivot HL indicate a highly probable Bullish continuation.
Target - 3342.3
Recommended Stop Loss - 3320.2
About Used Indicators:
A pivot point is a technical analysis indicator, or calculations, used to determine the overall trend of the market over different time frames.
Disclosure: I am part of Trade Nation's Influencer program and receive a monthly fee for using their TradingView charts in my analysis.
———————————
WISH YOU ALL LUCK

EURJPY Will Collapse! SELL!
My dear subscribers,
This is my opinion on the EURJPY next move:
The instrument tests an important psychological level 162.22
Bias - Bearish
Technical Indicators: Supper Trend gives a precise Bearish signal, while Pivot Point HL predicts price changes and potential reversals in the market.
Target - 161.99
About Used Indicators:
On the subsequent day, trading above the pivot point is thought to indicate ongoing bullish sentiment, while trading below the pivot point indicates bearish sentiment.
Disclosure: I am part of Trade Nation's Influencer program and receive a monthly fee for using their TradingView charts in my analysis.
———————————
WISH YOU ALL LUCK

SOL - Some new TA- IO and CVD increased regarding last highs (15.04.) but price has not broken Local Daily line. This means Big Money is shorting the Local Daily and absorbing Longs.
- Price is going up while Volume (OBV and AD) is decreasing in almost every time frame. Again. Big money is selling heavily to the Longs. The probability that Whale Sellers get exhausted is high too!
- 1H:
Grey line would be a nice Short if we can catch it.
Price on 0.78 Fib.
Risky...
1H Chart :
Follow for more ideas/Signals.💲
Just donate some of your profit to Animal rights or other charity :)✌️

Trading opportunity for SOLUSDTBased on technical factors there is a Sell position in :
📊 SOLUSDT
🔴 Sell Now
🪫Stop loss 151.00
🔋Target 97.00
📏 R/R 2
💸RISK : 1%
We hope it is profitable for you ❤️
Please support our activity with your likes👍 and comments📝

NZDCAD: Short Trading Opportunity
NZDCAD
- Classic bearish setup
- Our team expects bearish continuation
SUGGESTED TRADE:
Swing Trade
Short NZDCAD
Entry Point - 0.8240
Stop Loss - 0.8326
Take Profit - 0.8088
Our Risk - 1%
Start protection of your profits from lower levels
Disclosure: I am part of Trade Nation's Influencer program and receive a monthly fee for using their TradingView charts in my analysis.
❤️ Please, support our work with like & comment! ❤️

EURUSD My Opinion! SELL!`
My dear subscribers,
EURUSD looks like it will make a good move, and here are the details:
The market is trading on 1.1362 pivot level.
Bias - Bearish
My Stop Loss - 1.1441
Technical Indicators: Both Super Trend & Pivot HL indicate a highly probableBearish continuation.
Target - 1.1195
About Used Indicators:
The average true range (ATR) plays an important role in 'Supertrend' as the indicator uses ATR to calculate its value. The ATR indicator signals the degree of price volatility.
Disclosure: I am part of Trade Nation's Influencer program and receive a monthly fee for using their TradingView charts in my analysis.
———————————
WISH YOU ALL LUCK

GBPUSD Set To Fall! SELL!
My dear followers,
This is my opinion on the GBPUSD next move:
The asset is approaching an important pivot point 1.3239
Bias - Bearish
Safe Stop Loss - 1.3308
Technical Indicators: Supper Trend generates a clear short signal while Pivot Point HL is currently determining the overall Bearish trend of the market.
Goal - 1.3099
About Used Indicators:
For more efficient signals, super-trend is used in combination with other indicators like Pivot Points.
Disclosure: I am part of Trade Nation's Influencer program and receive a monthly fee for using their TradingView charts in my analysis.
———————————
WISH YOU ALL LUCK

GOLD: Long Signal with Entry/SL/TP
GOLD
-Classic bullish formation
- Our team expects growth
SUGGESTED TRADE:
Swing Trade
Buy GOLD
Entry Level - 3324.4
Sl - 3316.8
Tp - 3338.3
Our Risk - 1%
Start protection of your profits from lower levels
Disclosure: I am part of Trade Nation's Influencer program and receive a monthly fee for using their TradingView charts in my analysis.
❤️ Please, support our work with like & comment! ❤️

AUDNZD Trading Opportunity! BUY!
My dear friends,
AUDNZD looks like it will make a good move, and here are the details:
The market is trading on 1.0718 pivot level.
Bias - Bullish
Technical Indicators: Supper Trend generates a clear long signal while Pivot Point HL is currently determining the overall Bullish trend of the market.
Goal - 1.0781
About Used Indicators:
Pivot points are a great way to identify areas of support and resistance, but they work best when combined with other kinds of technical analysis
Disclosure: I am part of Trade Nation's Influencer program and receive a monthly fee for using their TradingView charts in my analysis.
———————————
WISH YOU ALL LUCK

GBPNZD Buyers In Panic! SELL!
My dear friends,
My technical analysis for GBPNZD is below:
The market is trading on 2.2447 pivot level.
Bias - Bearish
Technical Indicators: Both Super Trend & Pivot HL indicate a highly probable Bearish continuation.
Target - 2.2388
About Used Indicators:
A pivot point is a technical analysis indicator, or calculations, used to determine the overall trend of the market over different time frames.
Disclosure: I am part of Trade Nation's Influencer program and receive a monthly fee for using their TradingView charts in my analysis.
———————————
WISH YOU ALL LUCK

HTZ UP AROUND 22% TODAY. ACTIVIST INVESTOR BOUGHT $46.5M SHARES!HERTZ (HTZ) Surged nearly 22% today. A recently report revealed "Activist" Investor Bill Ackman had acquired $46.5 million shares . Should you hop on the bullish trend? Or will price cool off once the hype is over? What are your thoughts?
Disclaimer: Not Financial Advice

SOL - Longs on the Horizon!Hello TradingView Family / Fellow Traders. This is Richard, also known as theSignalyst.
📈 Medium-Term : SOL has been overall bearish and it is currently trading within the flat wedge pattern marked in red.
📍 As it retests the lower bound of the wedge — which perfectly intersects with the $100 round number — I’ll be looking for short-term longs.
🚀 In parallel, for the bulls to take over in the long term and kick off the next bullish phase, a breakout above the $147 previous daily high is needed.
Which scenario do you think will happen first — and why?
📚 Always follow your trading plan regarding entry, risk management, and trade management.
Good luck!
All Strategies Are Good; If Managed Properly!
~Rich

GOLD: Will Go Down! Short!
My dear friends,
Today we will analyse GOLD together☺️
The in-trend continuation seems likely as the current long-term trend appears to be strong, and price is holding below a key level of 3,311.72 So a bearish continuation seems plausible, targeting the next low. We should enter on confirmation, and place a stop-loss beyond the recent swing level.
❤️Sending you lots of Love and Hugs❤️
EURCAD: Short Trade Explained
EURCAD
- Classic bearish formation
- Our team expects pullback
SUGGESTED TRADE:
Swing Trade
Short EURCAD
Entry - 1.5807
Sl - 1.5889
Tp - 1.5626
Our Risk - 1%
Start protection of your profits from lower levels
Disclosure: I am part of Trade Nation's Influencer program and receive a monthly fee for using their TradingView charts in my analysis.
❤️ Please, support our work with like & comment! ❤️

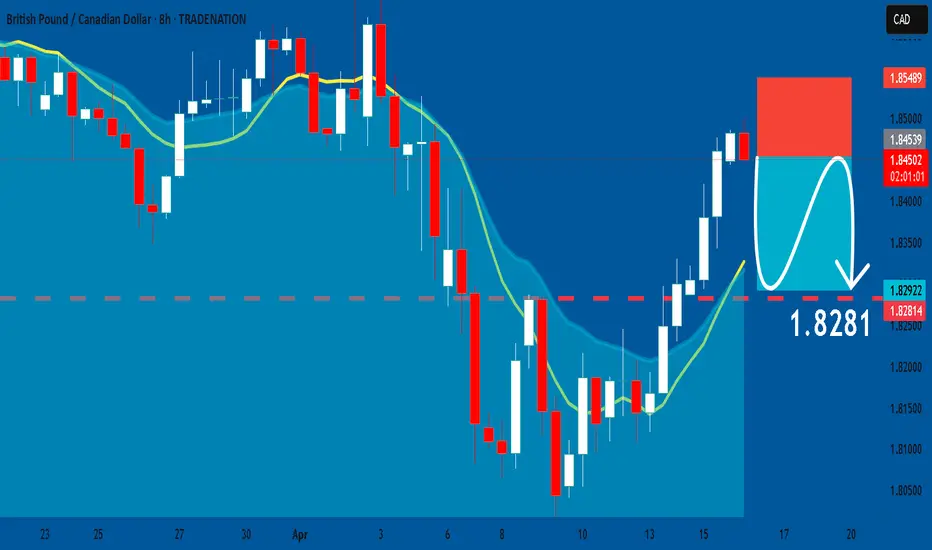
GBPCAD: Bearish Continuation & Short Trade
GBPCAD
- Classic bearish pattern
- Our team expects retracement
SUGGESTED TRADE:
Swing Trade
Sell GBPCAD
Entry - 1.8453
Stop - 1.8548
Take - 1.8281
Our Risk - 1%
Start protection of your profits from lower levels
Disclosure: I am part of Trade Nation's Influencer program and receive a monthly fee for using their TradingView charts in my analysis.
❤️ Please, support our work with like & comment! ❤️
NZDJPY The Target Is DOWN! SELL!
My dear friends,
Please, find my technical outlook for NZDJPY below:
The instrument tests an important psychological level 84.401
Bias - Bearish
Technical Indicators: Supper Trend gives a precise Bearish signal, while Pivot Point HL predicts price changes and potential reversals in the market.
Target - 82.960
Recommended Stop Loss - 85.188
About Used Indicators:
Super-trend indicator is more useful in trending markets where there are clear uptrends and downtrends in price.
Disclosure: I am part of Trade Nation's Influencer program and receive a monthly fee for using their TradingView charts in my analysis.
———————————
WISH YOU ALL LUCK

NZDCAD Trading Opportunity! SELL!
My dear friends,
Please, find my technical outlook for NZDCAD below:
The price is coiling around a solid key level - 0.8223
Bias - Bearish
Technical Indicators: Pivot Points Low anticipates a potential price reversal.
Super trend shows a clear sell, giving a perfect indicators' convergence.
Goal - 0.8103
About Used Indicators:
The pivot point itself is simply the average of the high, low and closing prices from the previous trading day.
Disclosure: I am part of Trade Nation's Influencer program and receive a monthly fee for using their TradingView charts in my analysis.
———————————
WISH YOU ALL LUCK

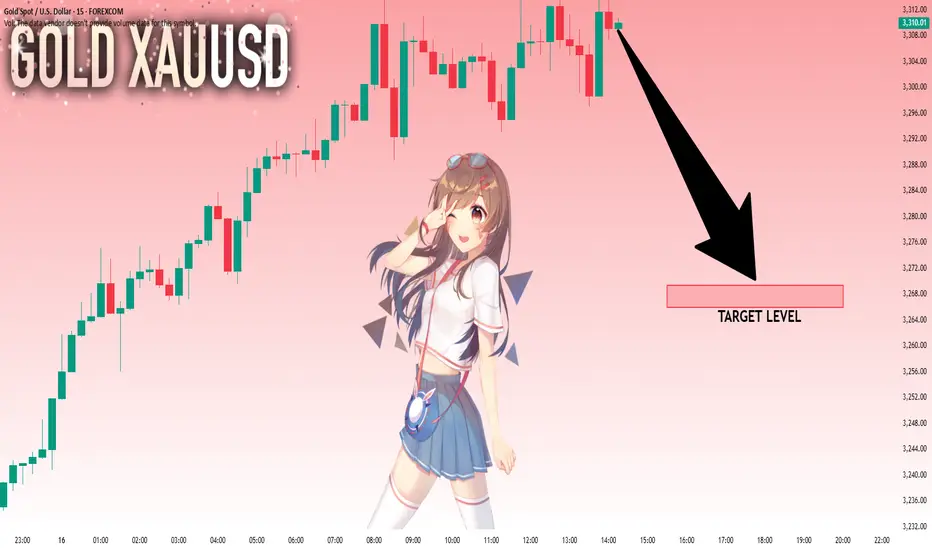
GOLD Massive Short! SELL!
My dear subscribers,
My technical analysis for GOLD is below:
The price is coiling around a solid key level - 3304.2
Bias - Bearish
Technical Indicators: Pivot Points High anticipates a potential price reversal.
Super trend shows a clear sell, giving a perfect indicators' convergence.
Goal - 3283.9
My Stop Loss - 3314.6
About Used Indicators:
By the very nature of the supertrend indicator, it offers firm support and resistance levels for traders to enter and exit trades. Additionally, it also provides signals for setting stop losses
Disclosure: I am part of Trade Nation's Influencer program and receive a monthly fee for using their TradingView charts in my analysis.
———————————
WISH YOU ALL LUCK
