SUPER - Getting ready for the super run- Price is trading near the resistance after forming higher high.
- it's highly likely that price will get rejected around the resistance and will form another higher high.
- this is an excellent opportunity for us to enter the trade.
Entry Price: 0.7322
Stop Loss: 0.5344
TP1: 0.8939
TP2: 1.0517
TP3: 1.2867
TP4: 1.6336
TP5: 2.2243
Max Leverage 5x.
Don't forget to keep stoploss.
Support us by Liking and following.
Thanks and Cheers!
GreenCrypto
Signal

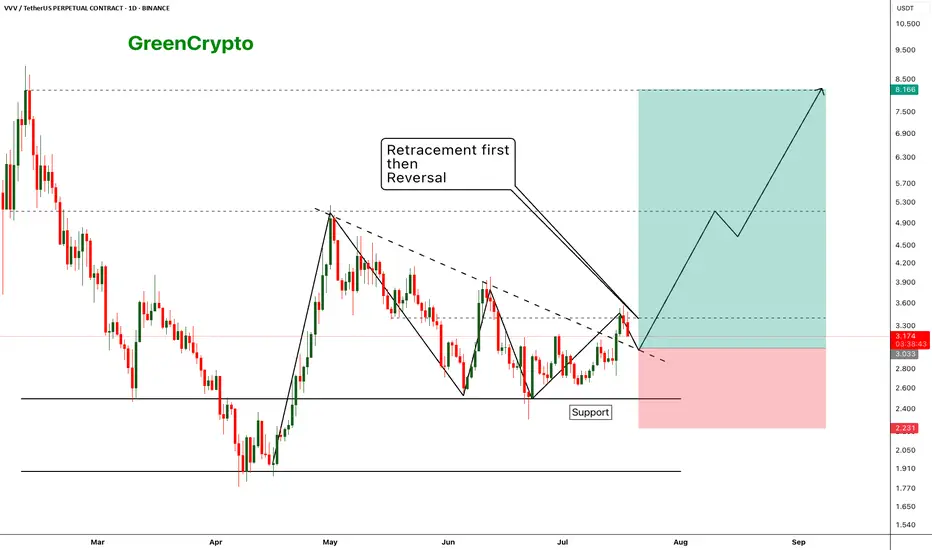
VVV - Expecting perfect reversal after the retracement- price has broken out from the resistance trendline and now we are seeing a retracement as expecting
- Price should hold the support (previous resistance) and reverse from the suppport zone.
- we can enter our trade once the retracement completed
Entry Price: 3.033
Stop Loss: 2.231
TP1: 3.411
TP2: 4.037
TP3: 4.851
TP4: 6.360
TP5: 8.028
Max Leverage 5x.
Don't forget to keep stoploss.
Cheers!
GreenCrypto
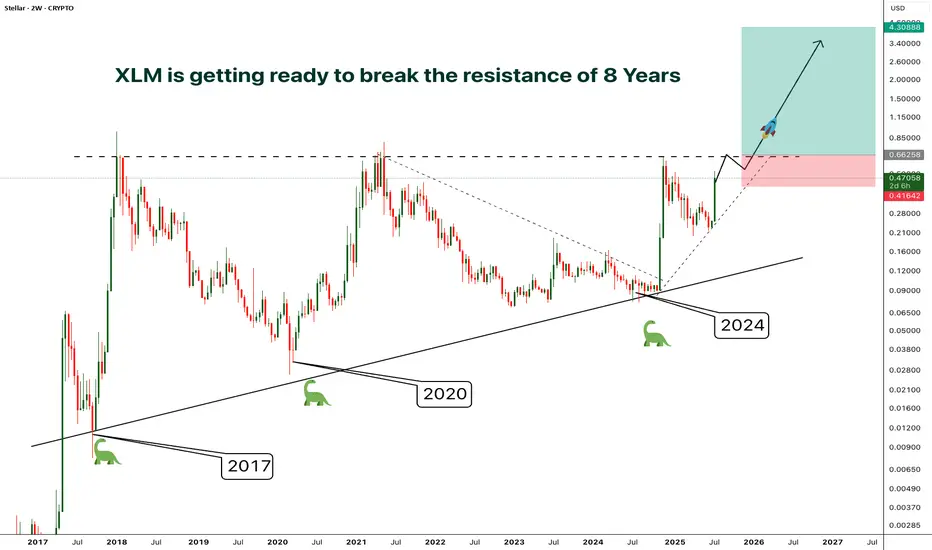
XLM - Resistance/Consolidation of 8 Years- Finally after 8 years of consolidation and getting rejected by the resistance at the same level around 0.65, XLM is preparing to break out from the almost decade old resistance
- A clear breakout from this resistance will phenomenal
- The price surge after the breakout will be unlike anything you've ever seen.
- I'm planning to enter after a confirmed breakout, entry before the breakout will be risky in case if the price gets rejected again.
Entry Price: Candle closeAbove 0.65
Stop Loss: Below 0.41
TP1: 0.88574
TP2: 1.21012
TP3: 1.92545
TP4: 2.68849
TP5: 4.27772
Don't forget to keep stoploss
Cheers
GreenCrypto
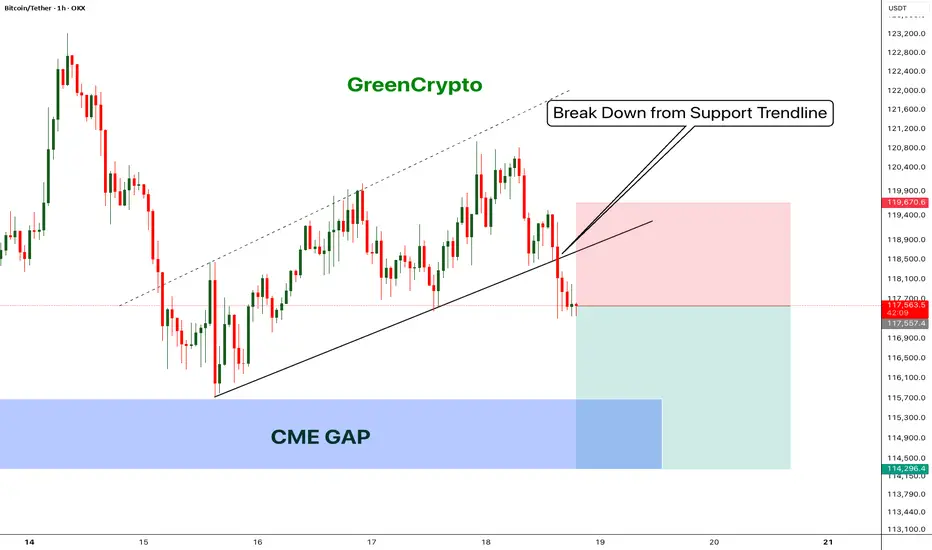
Bitcoin - Bears will push the price fill CME Gap- Bitcoin has broken down from the trending support,
- Price has been going down without any retracement on 1H candle.
- Looks like bitcoin will CME gap before going up further.
- A high risk Short Trade opportunity is here
Entry: 117,431
Stop Loss: 119,670
TP1: 116152.8
TP2: 114403.6
Move SL to Breakeven on TP1 hit
Don't forget to like and follow
Cheers
GreenCrypto
Major Move Ahead for ADA – Breakout or Breakdown?
🔍 ADA/USDT Analysis – Dual Scenario Setup (BUY & SELL)
Currently, ADA is ranging between major supply and demand zones. Two clear scenarios are in play depending on how price reacts to key levels:
📈 Bullish Scenario (Long):
Entry: On breakout and confirmation above $0.6027
Target: $0.869 (major resistance zone)
Stop Loss: Below $0.523
Trigger: Break of descending trendline and solid structure above $0.6027
📉 Bearish Scenario (Short):
Entry: Around $0.5120 (rejection from supply zone)
Target: $0.315 (strong demand zone)
Stop Loss: Above $0.6027
Trigger: Failed breakout and rejection from $0.5120 level, with confirmation below it
📌 Based on the descending channel structure, this might have been the final leg of the downtrend, and a reversal to the upside could be underway. However, for confirmation, we prefer to wait for stronger price action signals before fully committing.
🛑 Always use risk management. Market remains bearish until proven otherwise.

TRX Approaching Cup Breakout – Market Decision Imminent
TRX/USDT – Daily Chart Analysis
TRX is shaping a textbook Cup Pattern on the daily timeframe — a strong bullish continuation signal if confirmed. Price has gradually curved upward, and we are now testing the key resistance area at 0.29–0.30.
📌 Key Scenarios:
🔹 Bullish Breakout Scenario:
A confirmed breakout and daily close above 0.30 would validate the cup formation and set the stage for a rally toward the next target zones at 0.35 and 0.45 — measured based on the cup’s depth.
🔹 Bearish Rejection Scenario:
If the resistance holds, expect a pullback toward the midline (~0.24) for potential accumulation and base-building before the next move.
💡 Volume confirmation and breakout momentum are critical to watch here. The market is approaching a decision point.
🟢 Our directional bias remains bullish — we anticipate the breakout to occur, leading to an upward continuation. However, we’ll wait for confirmation of the breakout and completion of the pattern before entering a long position.

The Critical Blue Line – Will Bitcoin Soar or Sink
🔹 Bitcoin Technical Analysis – Key Blue Line, Bear Trap Possibility & Long-Term Scenario
On the Bitcoin chart, the blue horizontal level has acted multiple times as both support and resistance. The price has broken it several times but failed to sustain above, indicating high-volume decision-making zones by institutions and large players.
📉 Why this pattern keeps repeating:
Strong supply and demand concentration at this level.
Inability to break and hold shows market indecision.
Repeated fakeouts are likely used to shake out weak hands.
🔍 Important hidden scenario: Bear Trap Potential
If the price dips below the blue line but quickly reclaims it, it may form a bear trap, tricking short sellers into entering prematurely. This move could ignite strong bullish momentum from trapped sellers and renewed buyers.
🔮 If price holds above the blue line:
Signals market strength and potential bullish structure shift.
Targets:
109,800
117,200
120,000+ (Long-term)
📛 If support fails again:
Retracement toward the lower channel near 101,000 or lower is possible.
📊 Conclusion:
This zone is one of the most critical decision points in the current market. Traders should combine volume, candlestick behavior, and confirmation signals to avoid getting trapped by fake breaks

Wings of Opportunity: LINK’s Harmonic Setup Unfolding🦋 Title: A Butterfly on the Edge – But Only with Confirmation
On the 2H timeframe, a Bullish Butterfly Harmonic Pattern is unfolding. The wave structure (X → A → B → C → D) aligns closely with harmonic principles, and point D lies above X, within the 1.27 to 1.618 Fibonacci extension of XA — reinforcing the pattern’s validity.
📌 No entry has been triggered yet.
We are currently waiting for price to break and hold above the key resistance at 13.60 to confirm the bullish scenario.
🔹 Bullish Scenario (our primary and preferred outlook):
Given the strong reaction around the 12.74 demand zone and the harmonic structure completion, we are primarily focused on a long opportunity, if and only if confirmation is achieved above 13.60.
📥 Entry Zone: 13.05 – 13.65
🎯 Target 1: 17.94
🎯 Target 2: 18.76
🛑 Stop-Loss: Below 12.74 (structural invalidation)
🔻 Alternative Bearish Scenario:
If price fails to break 13.60 and instead loses the 12.74 support, the bullish setup becomes invalid, and the market could enter a deeper correction phase.
Potential downside targets in that case:
📉 11.80
📉 10.90 – 10.30 (if bearish momentum continues)
📊 Risk Management Notes:
Position sizing should not exceed 1% of total capital
Avoid early entries before confirmation
Prefer partial entries after breakout and retest
Stick to the invalidation level strictly
📈 While both scenarios are on the table, we are currently favoring the bullish setup, as long as price action supports it. Discipline and patience are key — confirmation first, trade second.

GBPJPY: Short Trading Opportunity
GBPJPY
- Classic bearish formation
- Our team expects pullback
SUGGESTED TRADE:
Swing Trade
Short GBPJPY
Entry - 199.63
Sl - 200.26
Tp - 198.44
Our Risk - 1%
Start protection of your profits from lower levels
Disclosure: I am part of Trade Nation's Influencer program and receive a monthly fee for using their TradingView charts in my analysis.
❤️ Please, support our work with like & comment! ❤️

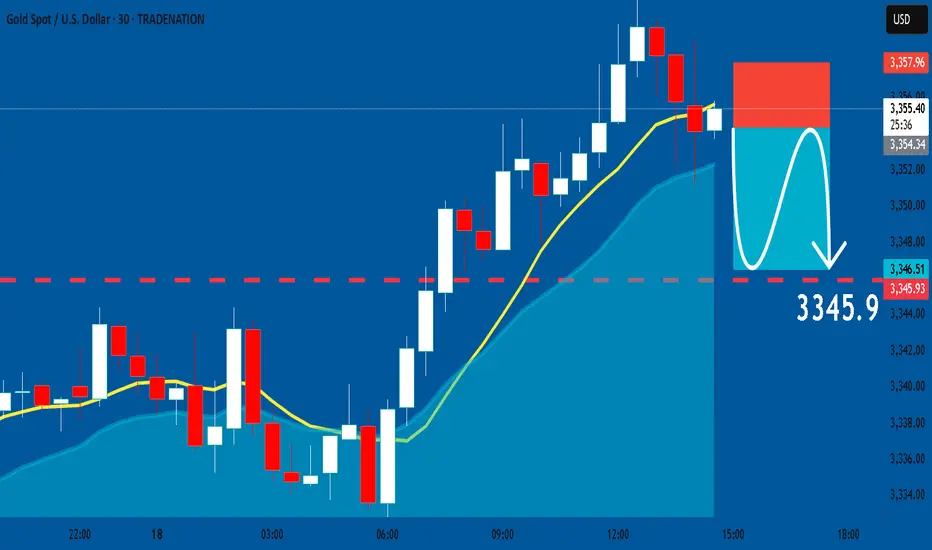
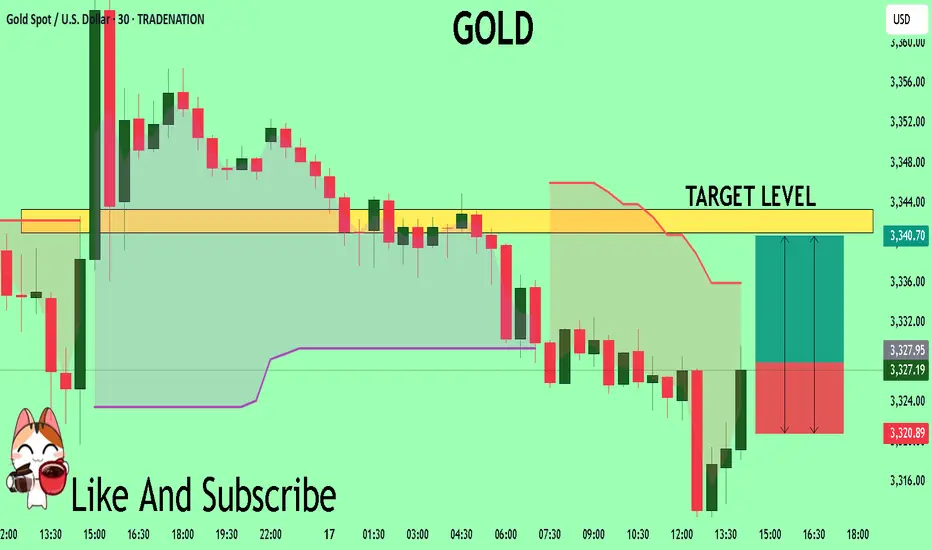
GOLD: Short Trade Explained
GOLD
- Classic bearish pattern
- Our team expects retracement
SUGGESTED TRADE:
Swing Trade
Sell GOLD
Entry - 3354.53
Stop - 3357.9
Take - 3345.9
Our Risk - 1%
Start protection of your profits from lower levels
Disclosure: I am part of Trade Nation's Influencer program and receive a monthly fee for using their TradingView charts in my analysis.
❤️ Please, support our work with like & comment! ❤️
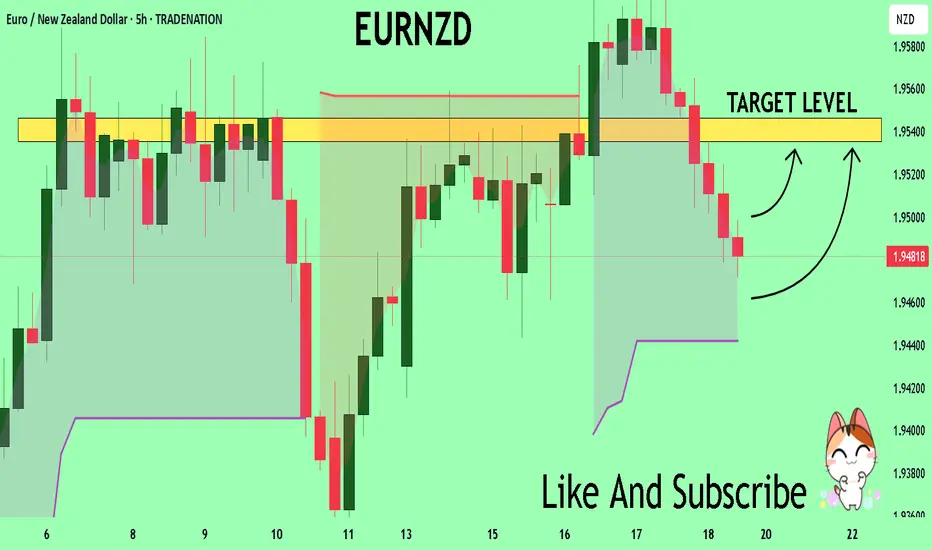
EURNZD On The Rise! BUY!
My dear friends,
EURNZD looks like it will make a good move, and here are the details:
The market is trading on 1.9481 pivot level.
Bias - Bullish
Technical Indicators: Supper Trend generates a clear long signal while Pivot Point HL is currently determining the overall Bullish trend of the market.
Goal - 1.9535
About Used Indicators:
Pivot points are a great way to identify areas of support and resistance, but they work best when combined with other kinds of technical analysis
Disclosure: I am part of Trade Nation's Influencer program and receive a monthly fee for using their TradingView charts in my analysis.
———————————
WISH YOU ALL LUCK
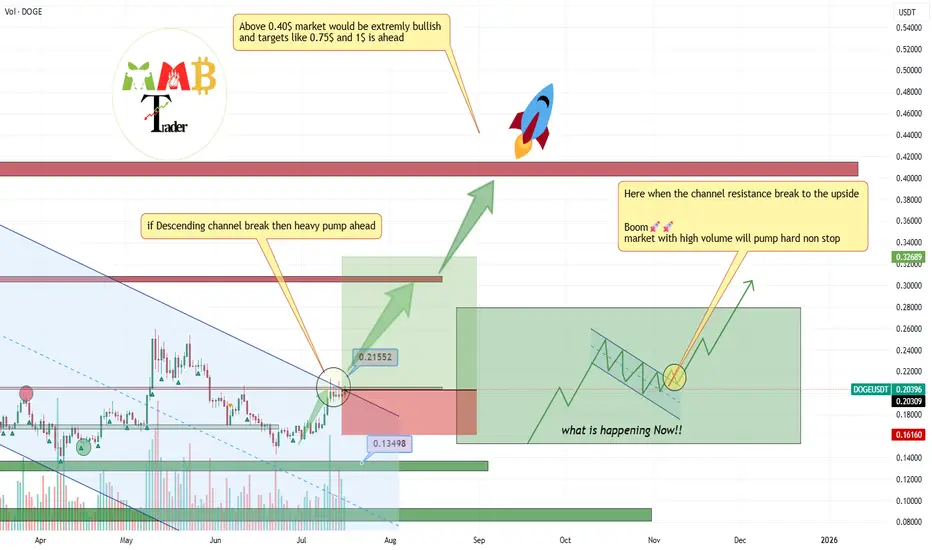
DOGEUSDT major breakout to the upside with at least 2x cookingThis breakout would be huge and it is happening now at least +60% gain is easy target so we put Take profit 1 there with our buy Setup which is 1:3(Risk:Reward).
Hope you all enjoy and it is time for BINANCE:DOGEUSDT to #pump this time and be a leader of MEME for weeks.
DISCLAIMER: ((trade based on your own decision))
<<press like👍 if you enjoy💚
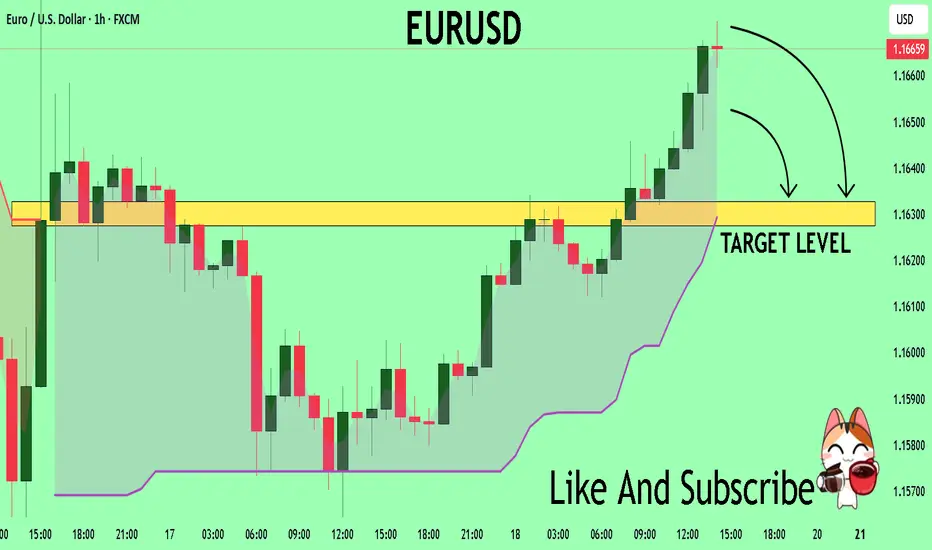
EURUSD Will Collapse! SELL!
My dear subscribers,
This is my opinion on the EURUSD next move:
The instrument tests an important psychological level 1.1663
Bias - Bearish
Technical Indicators: Supper Trend gives a precise Bearish signal, while Pivot Point HL predicts price changes and potential reversals in the market.
Target - 1.1632
About Used Indicators:
On the subsequent day, trading above the pivot point is thought to indicate ongoing bullish sentiment, while trading below the pivot point indicates bearish sentiment.
Disclosure: I am part of Trade Nation's Influencer program and receive a monthly fee for using their TradingView charts in my analysis.
———————————
WISH YOU ALL LUCK
GOLD What Next? BUY!
My dear friends,
GOLD looks like it will make a good move, and here are the details:
The market is trading on 3328.1 pivot level.
Bias - Bullish
Technical Indicators: Supper Trend generates a clear long signal while Pivot Point HL is currently determining the overall Bullish trend of the market.
Goal - 3340.9
Recommended Stop Loss - 3320.8
About Used Indicators:
Pivot points are a great way to identify areas of support and resistance, but they work best when combined with other kinds of technical analysis
Disclosure: I am part of Trade Nation's Influencer program and receive a monthly fee for using their TradingView charts in my analysis.
———————————
WISH YOU ALL LUCK
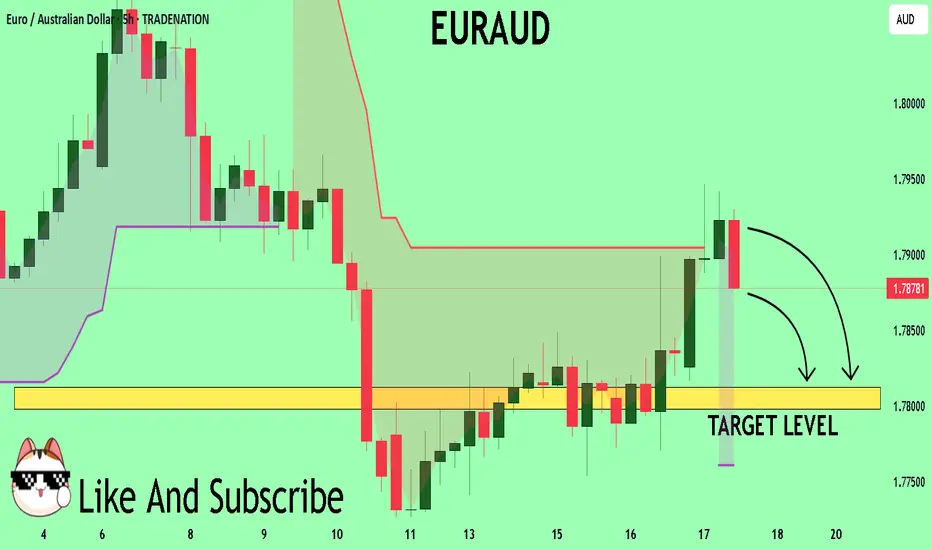
EURAUD Buyers In Panic! SELL!
My dear friends,
Please, find my technical outlook for EURAUD below:
The price is coiling around a solid key level - 1.7893
Bias - Bearish
Technical Indicators: Pivot Points Low anticipates a potential price reversal.
Super trend shows a clear sell, giving a perfect indicators' convergence.
Goal - 1.7812
About Used Indicators:
The pivot point itself is simply the average of the high, low and closing prices from the previous trading day.
Disclosure: I am part of Trade Nation's Influencer program and receive a monthly fee for using their TradingView charts in my analysis.
———————————
WISH YOU ALL LUCK
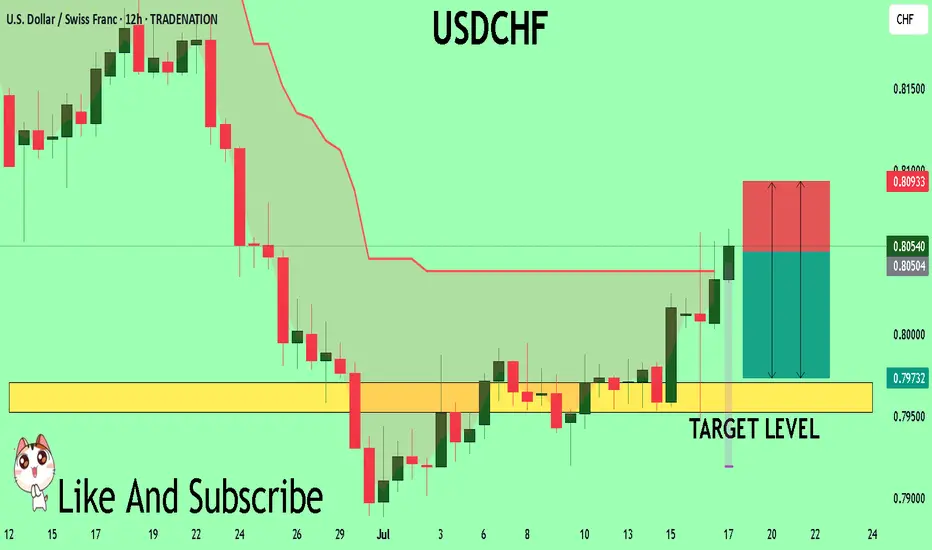
USDCHF The Target Is DOWN! SELL!
My dear followers,
I analysed this chart on USDCHF and concluded the following:
The market is trading on 0.8050 pivot level.
Bias - Bearish
Technical Indicators: Both Super Trend & Pivot HL indicate a highly probable Bearish continuation.
Target - 0.7970
Safe Stop Loss - 0.8093
About Used Indicators:
A super-trend indicator is plotted on either above or below the closing price to signal a buy or sell. The indicator changes color, based on whether or not you should be buying. If the super-trend indicator moves below the closing price, the indicator turns green, and it signals an entry point or points to buy.
Disclosure: I am part of Trade Nation's Influencer program and receive a monthly fee for using their TradingView charts in my analysis.
———————————
WISH YOU ALL LUCK
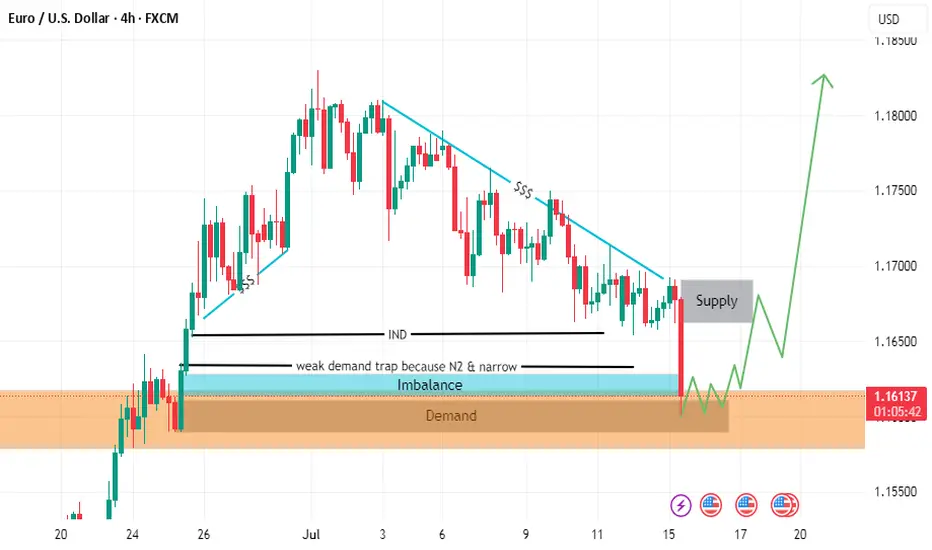
EURUSD long Lion SETUPhello everyone
the price is in a strong demand area
as liquidity has been withdrawn
and the fair value gap has been filled
but we are waiting for formation pattern on a smaller frame in order to enter an upward wave.
we also have resistance area
so in short. I expect an upside go upppp
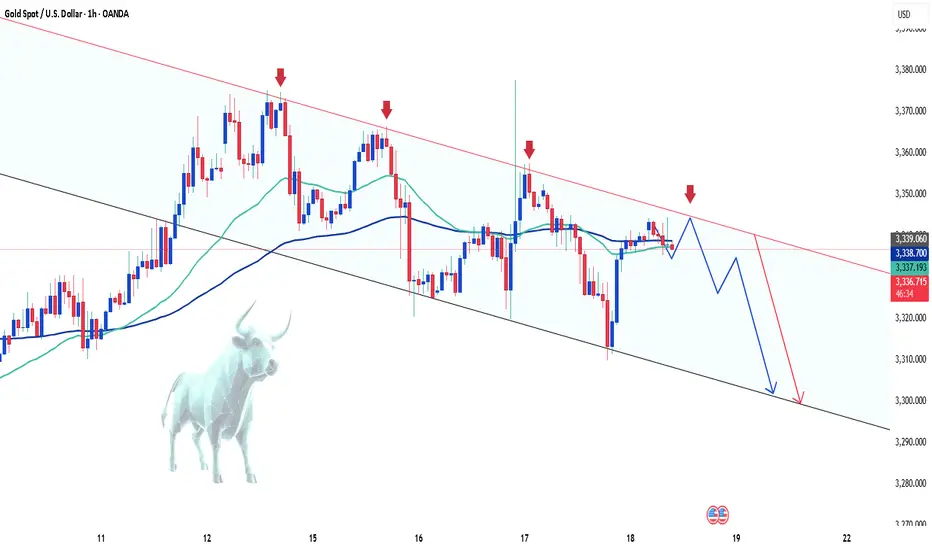
Gold's Short-Term Decline: What's Next?Hello everyone, what do you think about gold?
Today, gold continues its short-term downtrend. After new data was released at the end of yesterday’s trading session, the USD rose by 0.3%, and U.S. Treasury yields also increased, reducing the appeal of gold. Additionally, the latest unemployment claims data shows improvement in the U.S. economy, which has contributed to the drop in the precious metal.
As of writing, gold is trading around the EMA 34, 89 levels at 3,336 USD. With the recent news, the market is expected to maintain its current stance throughout the day, as no new significant updates are expected.
From a technical standpoint, the downtrend remains in place, with prices continuing to be capped below the trendline. The series of lower highs and lows could likely lead XAUUSD to test lower levels, with the possibility of reaching the 3,300 USD mark.
What do you think about the price of gold today? Let us know in the comments!
Latest Gold Price Update TodayGold prices today continue to maintain a short-term uptrend, driven by trade tensions and U.S. inflation data.
The weakening of the USD and the drop in U.S. Treasury yields have increased gold's appeal as a safe-haven asset. The trade tensions between the U.S. and the EU, along with new tariff measures, further boost the demand for gold.
Additionally, the U.S. PPI for June rose by 2.3%, lower than the forecast and May’s increase, suggesting that inflation could decrease in the future. The market expects the Fed to cut interest rates in September, weakening the USD and supporting gold's uptrend.
With factors like trade tensions, a weaker USD, and positive inflation data, gold prices may continue to rise. Investors need to closely monitor these factors to devise an appropriate strategy.

AAVE - Beautiful Cup and Handle Pattern Breakout- AAVE is breaking out from cup and handle pattern finally
- Cup and handle pattern breakout usually results in perfect trend continuation
- A huge long trade opportunity from this
Entry Price: 335 Above
Stop Loss: 245
TP1: 381.89
TP2: 429.16
TP3: 525.94
TP4: 628.78
TP5: 712.89
Max Leverage 5x:
Don't forget to keep stoploss
Cheers
GreenCrypto
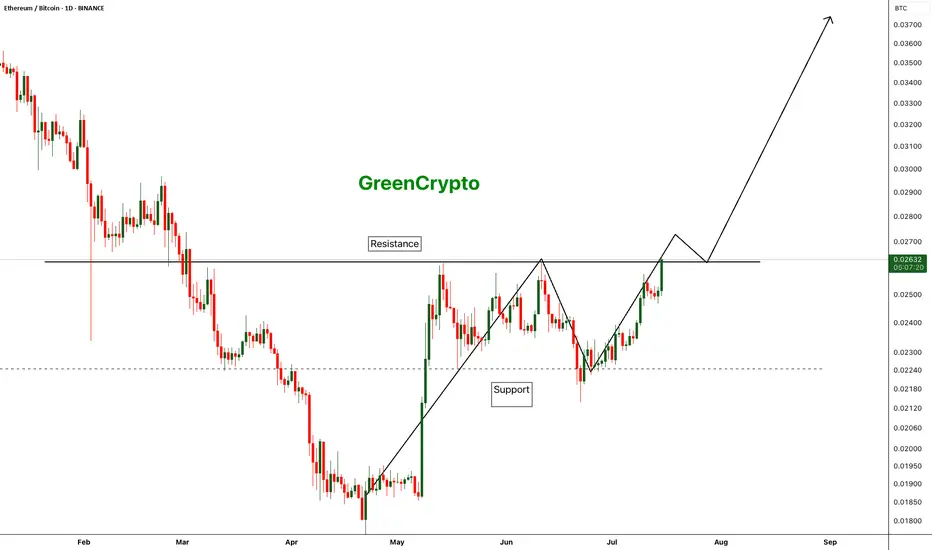
ETH/BTC - Finally Trend is reversing - After a long time we are finally seeing a change in the trend of ETH/BTC pair.
- Compared to BTC, ETH was underperforming for last couple of years and we are seeing some strength in ETH
- If this trend continue we can finally see some new ATH on ETH
Entry: 0.02633
StopLoss: 0.02125
TP1: 0.02825
TP2: 0.03168
TP3: 0.03592
Don't forget to keep stop loss. Stay tuned for more updates
Cheers
GreenCrypto
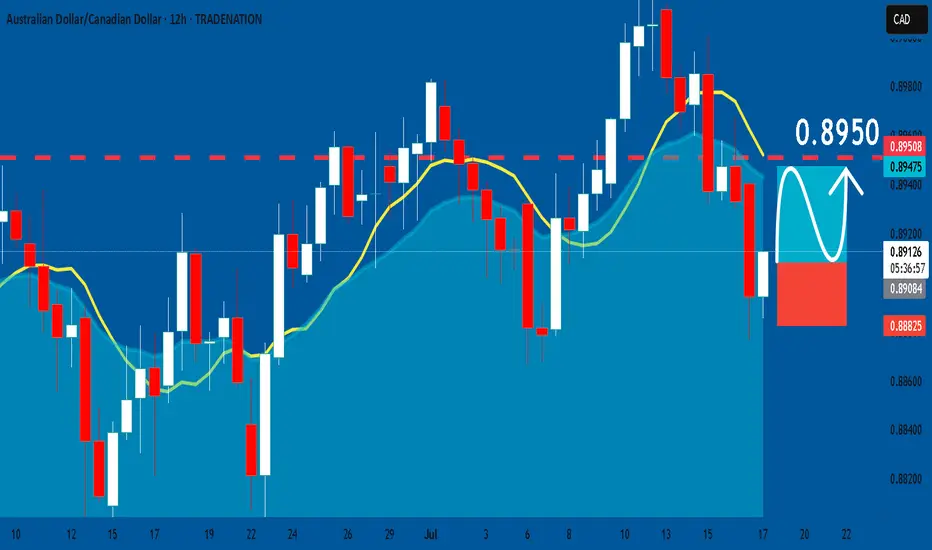
AUDCAD: Long Signal Explained
AUDCAD
- Classic bullish formation
- Our team expects pullback
SUGGESTED TRADE:
Swing Trade
Long AUDCAD
Entry - 0.8908
Sl - 0.8882
Tp - 0.8950
Our Risk - 1%
Start protection of your profits from lower levels
Disclosure: I am part of Trade Nation's Influencer program and receive a monthly fee for using their TradingView charts in my analysis.
❤️ Please, support our work with like & comment! ❤️
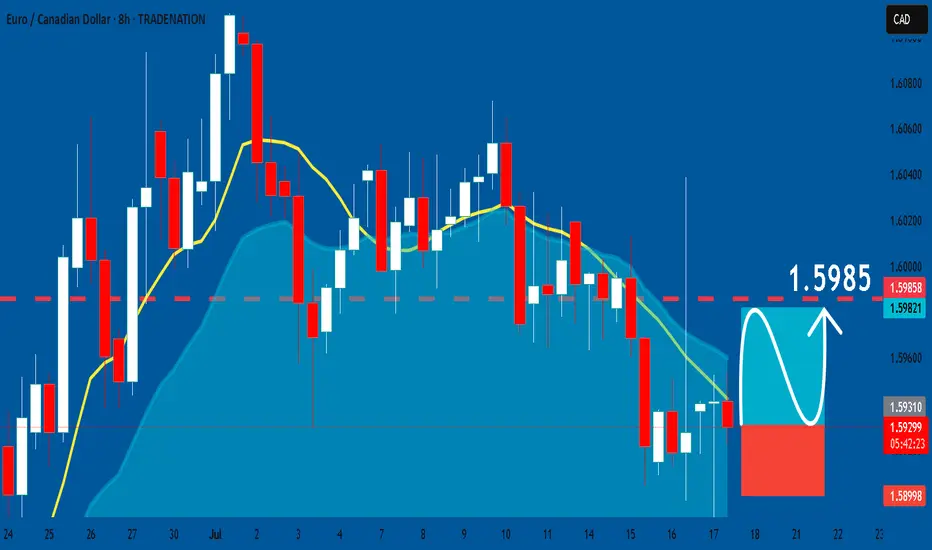
EURCAD: Long Signal with Entry/SL/TP
EURCAD
- Classic bullish pattern
- Our team expects retracement
SUGGESTED TRADE:
Swing Trade
Buy EURCAD
Entry - 1.5929
Stop - 1.5899
Take - 1.5985
Our Risk - 1%
Start protection of your profits from lower levels
Disclosure: I am part of Trade Nation's Influencer program and receive a monthly fee for using their TradingView charts in my analysis.
❤️ Please, support our work with like & comment! ❤️