FILUSDT Potential UpsidesHey Traders, in today's trading session we are monitoring FILUSDT for a buying opportunity around 2.60 zone, FILUSDT is trading in an uptrend and currently is in a correction phase in which it is approaching the trend at 2.60 support and resistance area.
Trade safe, Joe.
Signalprovider

Gold – False Break Signals More DownsideIn my commentary yesterday, I highlighted the importance of the 3360 support zone. While Gold initially found a bid around this level, the sharp reversal from the 3415 Asian session high suggests a failed breakout.
Key Observations:
• The quick rejection above 3360 now looks like a false break, reinforcing the bearish outlook.
• The recent high around 3415 appears to be a lower high following the 3500 ATH, confirming potential trend weakness.
• Given this structure, a drop back to at least the 3270 support zone seems highly probable.
Disclosure: I am part of Trade Nation's Influencer program and receive a monthly fee for using their TradingView charts in my analyses and educational articles.

EURUSD – Quiet but Building for a Break?Unlike the wild volatility in Gold, EURUSD has been relatively calm over the past two weeks.
After a sharp spike above 1.1500, reaching a high near 1.1570, the pair corrected and settled into a tight consolidation, fluctuating within just 1%.
Current Setup:
• Price recently reversed from the 1.1280 support and is now pushing towards the 1.1420 resistance.
• Bulls can watch for a breakout above this resistance, which could open the door for a retest of the 1.1570 high.
• As long as 1.1280 holds, the strategy is to buy the dips.
For now, the range is tight, but a breakout could offer some opportunities.
Disclosure: I am part of Trade Nation's Influencer program and receive a monthly fee for using their TradingView charts in my analyses and educational articles.

Gold – Bulls in Control, but Watch Key Support Gold remains extremely volatile. After finding support around 3200 at the beginning of the month, the price surged nearly 2500 pips within just three trading days, reaching above 3400.
Currently, the price has pulled back and has tested the 3360 zone over night– a former resistance turned support.
Two Scenarios to Watch:
- Bullish Case: If 3360 holds, bulls could push for a retest of the 3500 zone.
- Bearish Case: A clear break below 3360 would confirm a lower high, potentially opening the door for a deeper correction back to 3270.
For now, I’m on the sidelines, waiting for more clarity around this critical support.
Disclosure: I am part of Trade Nation's Influencer program and receive a monthly fee for using their TradingView charts in my analyses and educational articles.

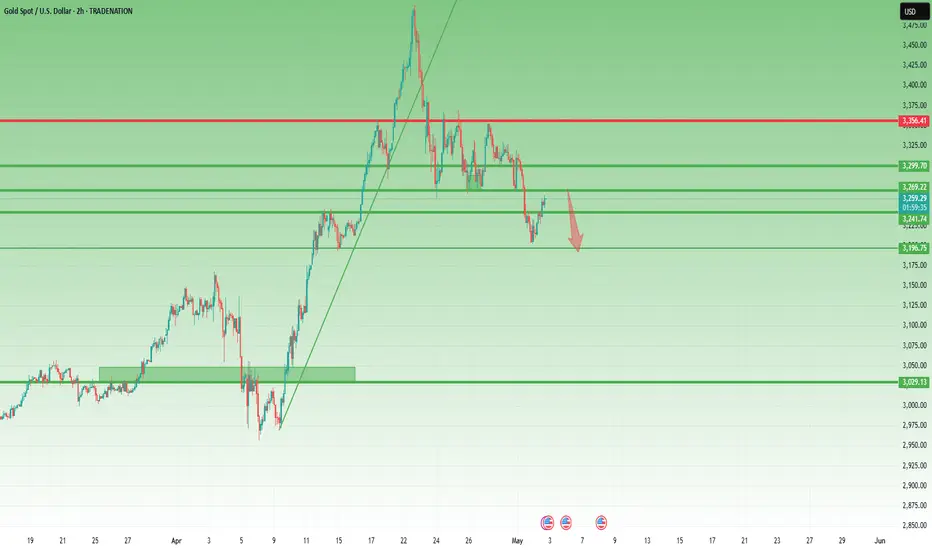
Gold Bears Won Big – Here’s the Next Resistance to WatchYesterday was a great day for Gold bears – just as anticipated, price dropped nearly 1,000 pips and hit my target zone around 3200.
After such a strong move, we’re now seeing a typical rebound, which might offer a fresh opportunity to sell into strength and ride the prevailing trend.
🔍 Key Zone:
- 3270 now acts as resistance.
- If price stalls here, it’s the ideal area to look for short entries targeting a retest of 3200.
🛠️ Plan: Sell spikes into 3270 resistance and stay with the trend.
EURUSD – Bear Flag Before Further Drop?Like most of the market, EURUSD reacted strongly on April 22–23 with a sharp move down. Since then, price has entered a consolidation phase — and thIS pause has now taken the shape of a bear flag, a classic continuation pattern that often leads to further correction once confirmed.
📉 Key levels to watch:
1.1350 – Initial trigger for the flag break
1.1300 – Confirmation of bearish momentum
Target: 1.1100
Invalidation: A return above 1.1500 would negate the pattern and call for reassessment.
Disclosure: I am part of Trade Nation's Influencer program and receive a monthly fee for using their TradingView charts in my analyses and educational articles.

GBPUSD Analysis – Classic Spike, But Bearish Bias HoldsTwo days ago, TRADENATION:GBPUSD did what it often does – spiked above the previous high with no solid fundamental reason, likely just to hunt stops.
This return into the resistance zone might look bullish on the surface, but the bigger picture remains unchanged.
Has the market really resumed its up move, or was this just a trap?
Despite the upward push, the overall outlook stays bearish. A drop towards the 1.3000 zone is still highly probable – but we need confirmation.
Why the bearish scenario remains valid:
• The spike occurred without strong fundamental backing.
• Price hasn't broken the strong 1.35 resistance.
• Key support for a breakdown lies at 1.3330–1.3350 – a clear break here is the signal for downside continuation.
Trading Plan:
Wait for a break below 1.3330–1.3350, and then look for short setups on lower timeframes.
Invalidation comes only if the pair pushes and sustains above 1.3500, in which case the bearish thesis is off the table.
Disclosure: I am part of Trade Nation's Influencer program and receive a monthly fee for using their TradingView charts in my analyses and educational articles.

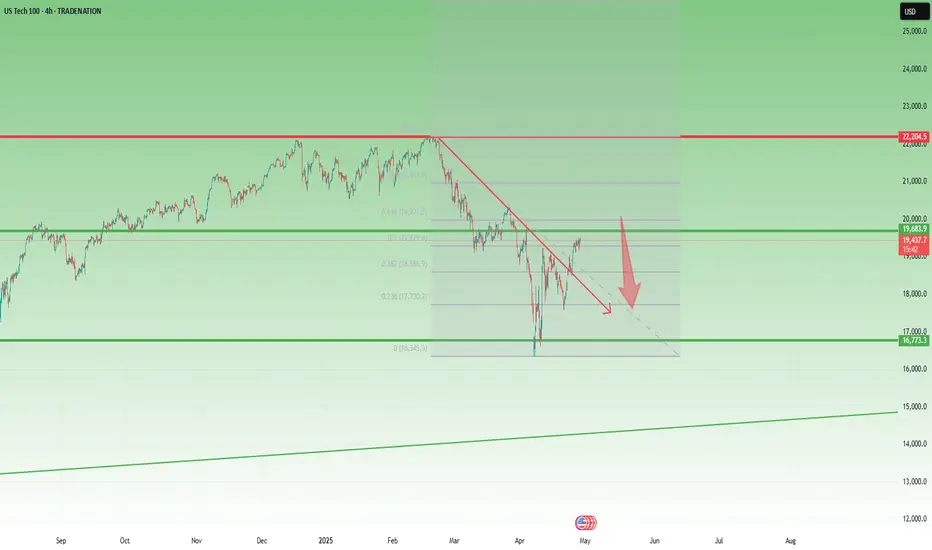
NASDAQ Recovery Looks Fragile Below 20,500After the steep drop to 16,300, NAS100 started to recover, forming a higher low and managing to break back above the falling trendline drawn from the all-time high (ATH).
While these are positive developments, in my opinion, the trend is likely to reverse to the downside soon.
Technically, the index is now entering a heavy resistance zone, marked by:
• The golden sell zone between the 50% and 61.8% Fibonacci retracement,
• Psychological resistance at 20,000,
• Major horizontal resistance around 20,500.
As long as the price remains below 20,500, I favor short trades, targeting a potential drop to at least 18,000
Disclosure: I am part of Trade Nation's Influencer program and receive a monthly fee for using their TradingView charts in my analyses and educational articles.
Gold Plan: Waiting for the 1000 Pips Drop UnderwayYesterday, I highlighted that the 3280 support zone looked fragile and warned of a potential breakdown.
However, once New York opened, bulls stepped in aggressively, pushing Gold above Friday’s close and triggering my stop loss along the way.
Key Question:
Has the bullish momentum changed the bigger picture?
Why I Still Expect a Drop:
- Despite yesterday's green close, the broader structure remains bearish.
- The 3370 resistance zone is still intact, and Gold is vulnerable under it.
- My target remains a move under 3280, aiming for the 3200 area.
T rading Plan:
I will continue to look for selling opportunities, especially on spikes toward resistance zones, targeting a 1000 pips move down.
Final Words:
The market needs to confirm the plan, but patience and discipline will bring the 🚀 in the right direction!
Disclosure: I am part of Trade Nation's Influencer program and receive a monthly fee for using their TradingView charts in my analyses and educational articles.

Gold Stuck in Limbo- Sell Rallies, Ride the DropAfter the explosive rally that pushed Gold up to the 3500 area, the market quickly reversed with a sharp sell-off on April 22–23, dropping almost 2500 pips.
Since then, price has entered a consolidation phase.
Initially, the range was between 3270 and 3370, but since yesterday, the range has started to tighten — a classic sign that a breakout is approaching.
Looking at the structure, we’re dealing with a blow-off top followed by a range with clear support and resistance levels. In this context, I lean toward a downside breakout.
The key support is now at 3300 — and a break below it would likely expose 3270 again.
However, I don’t expect the move to stop there. If 3300 is broken, a continuation toward the 3200 zone becomes very likely.
🔹 Trading Plan:
As long as price stays below the 3360–3370 resistance zone, the strategy is to sell rallies, especially when price approaches the upper boundary of the range. Entries can be taken on rejection candles or confirmation patterns near resistance, with stops just above 3370. If 3300 breaks, watch for continuation setups toward 3200.
Only a sustained breakout above 3370 with strong bullish momentum would invalidate the bearish scenario and call for a reassessment.
Disclosure: I am part of Trade Nation's Influencer program and receive a monthly fee for using their TradingView charts in my analyses and educational articles.

EURGBP Technical Setup: 1:3 R:R Opportunity on RetestAfter the drop to 0.8250 — a level not touched since 2022 — EURGBP rebounded to 0.8450 before starting another decline.
However, the 0.8250 support held firm once again, a higher low follow, and EURGBP eventually broke above 0.8450, confirming a double bottom pattern.
Price acceleration quickly took the pair above 0.8700, and now EURGBP is undergoing a normal correction.
The broken neckline at 0.8450 now acts as clear support.
Traders could look to buy near the 0.8450 retest, using a tight stop below the neckline, and aiming for at least a 1:3 risk-reward ratio.
Disclosure: I am part of Trade Nation's Influencer program and receive a monthly fee for using their TradingView charts in my analyses and educational articles.

XAUUSD: Massive Volatility, Weak Support at 3270!Last week was extremely volatile for Gold, with incredible swings that caught many traders off-guard. After reaching a new all-time high at 3500, the price dropped by more than 2000 pips in less than 24 hours!
After this crash, the market settled somewhat, and towards the end of the week, Gold established a strong ceiling around 3370 – exactly as we discussed in last week's analysis.
The key question now: Is the correction over or is there more downside coming?
At the same time, we can clearly observe a floor around 3270, a level that Gold is testing again at the time of writing.
Here’s why I believe the correction is not over yet:
- Price action remains vulnerable below 3370 resistance.
- The support at 3270 looks fragile, with pressure building for a break.
- Market volatility is still extremely high, favoring continuation moves.
Trading Plan:
I am looking to sell rallies above 3300, aiming for a target around 3200.
Due to the recent wild volatility, I will adjust my stop losses accordingly, allowing enough room for noise without exposing the position to unnecessary risk.
Disclosure: I am part of Trade Nation's Influencer program and receive a monthly fee for using their TradingView charts in my analyses and educational articles.

AVAX Analysis: Building Up for a Potential Breakout🔹 Since mid-December, AVAX dropped hard, losing more than 70% from the highs.
🔹 Recently, the coin found strong support around the $15 zone, testing it twice — possibly forming a double bottom pattern.
🔹 At the time of writing, price is consolidating right under the neckline and seems to be building momentum for a move.
Key technical points:
• Massive drop from $55 opens room for a stronger relief rally.
• A breakout above the $23 resistance would confirm bullish continuation.
• $18 is now the new support zone — as long as it holds, the bias remains bullish.
• Major target for bulls: $30–31 area.
🚀 Plan: Watching for a confirmed breakout above $23 for potential continuation higher. As long as $18 support holds, dips could be seen as opportunities.

GBPJPY Reclaims 190 – Ready for 195?After breaking below the 188.00 support zone and testing 184.50 support, GBPJPY quickly reversed, signaling strong buying interest and a classic false breakdown.
Last week, the pair also reclaimed the key 190.00 level – an important technical and psychological area – showing clear strength and readiness for a potential continuation higher.
The key question now: Is GBPJPY ready to launch towards new highs?
Here’s why I stay bullish:
- Strong rejection at 184.50 confirms buyer dominance.
- Recovery above 190.00 is a major bullish signal.
- Market structure now favors buying dips
T rading Plan:
I’m looking to buy dips, staying bullish as long as 187.00 remains intact.
🎯 Targeting a move towards 195.00.
Disclosure: I am part of Trade Nation's Influencer program and receive a monthly fee for using their TradingView charts in my analyses and educational articles.

GBPUSD Rejected at Key Resistance – Bearish Outlook StaysLast week, in my GBPUSD analysis, I highlighted that the pair had reached a major resistance area – a level that has acted as both support and resistance over the past few years. I mentioned that a correction from this zone was very likely.
The market reacted perfectly: GBPUSD dropped from that resistance, and after the initial move, it entered into a consolidation phase.
The key question now: Is the correction finished or will the downside continue?
My outlook remains the same – I still expect further downside towards the 1.3000 level.
Here’s why I stay bearish:
- Strong historical resistance rejected the price.
- No real bullish momentum above 1.34 zone.
- Consolidation after the drop looks more like a pause, not a reversal.
Trading Plan:
I will look to sell rallies, staying bearish as long as the 1.3400 area (recent high) is not broken.
Disclosure: I am part of Trade Nation's Influencer program and receive a monthly fee for using their TradingView charts in my analyses and educational articles.

USDJPY – Searching for a Bottom After a Brutal DropSince the start of the year, USDJPY has been in an almost free fall, losing nearly 2,000 pips and breaking multiple key supports, including the critical 150 level.
Yesterday, we even saw a spike below 140, a level not touched for quite some time.
🔄 However, after that spike, the pair reversed sharply to the upside, showing strong demand in that area.
Interestingly, this zone was tested at the start of 2024 and again back in September, adding even more technical relevance.
📊 Despite the poor outlook for the USD overall, I now expect a meaningful rebound from here, aiming for a retest of the former 146 support, which has now turned into resistance.
💡 Trading Plan:
I will be looking to buy dips near the current support, targeting a 1:3 Risk/Reward setup toward the 146 resistance area.
Disclosure: I am part of Trade Nation's Influencer program and receive a monthly fee for using their TradingView charts in my analyses and educational articles.

Gold Analysis – New Leg of Correction Incoming?It’s been a “special” week for Gold, with wild swings that kept me mostly on the sidelines – except for Monday’s take profit. Now, however, the market is starting to show more clarity.
❓ Has the Market Topped Out?
After a dip to 3260, the price reversed sharply, gaining over 1,000 pips to reach 3367. Yet, both recent attempts to push higher were rejected.
Now, with the spike from 3360 to 3500 looking like a blow-off top, the stage seems set for a new leg of correction.
🔍 Key Technical Signs:
• Heavy selling pressure near recent highs.
• Price action suggests buyers are exhausted.
• 3370 becomes a key resistance – as long as it holds, bearish setups are favored.
📉 Trading Plan:
My approach is simple:
👉 Sell rallies
🎯 Target: a 1,000+ pip drop if 3370 remains intact.
Disclosure: I am part of Trade Nation's Influencer program and receive a monthly fee for using their TradingView charts in my analyses and educational articles.

EUR/USD: Is the Uptrend Losing Steam?EUR/USD has had an exceptionally strong month, gaining over 7% from bottom to top – one of the best performances in EUR’s history against the dollar.
But now, things are starting to shift.
🧭 Possible Long-Term Trend Change?
Beyond the impressive rally, the bigger story might be the potential shift in the long-term trend. However, after such a sharp move up, a correction is not only likely – it may already be underway.
🔍 Technical Outlook:
- Price pushed above the key 1.15 psychological level but failed to hold momentum.
- A bearish consolidation is forming.
- A classic Head and Shoulders pattern appears to be developing, with a neckline near 1.13.
- A break of that level could open the door for a deeper retracement, with a target around 1.11.
🛠️ Trading Plan:
I’m looking to sell rallies, ideally near 1.1450, to maintain a 1:3 risk-to-reward ratio.
Disclosure: I am part of Trade Nation's Influencer program and receive a monthly fee for using their TradingView charts in my analyses and educational articles.

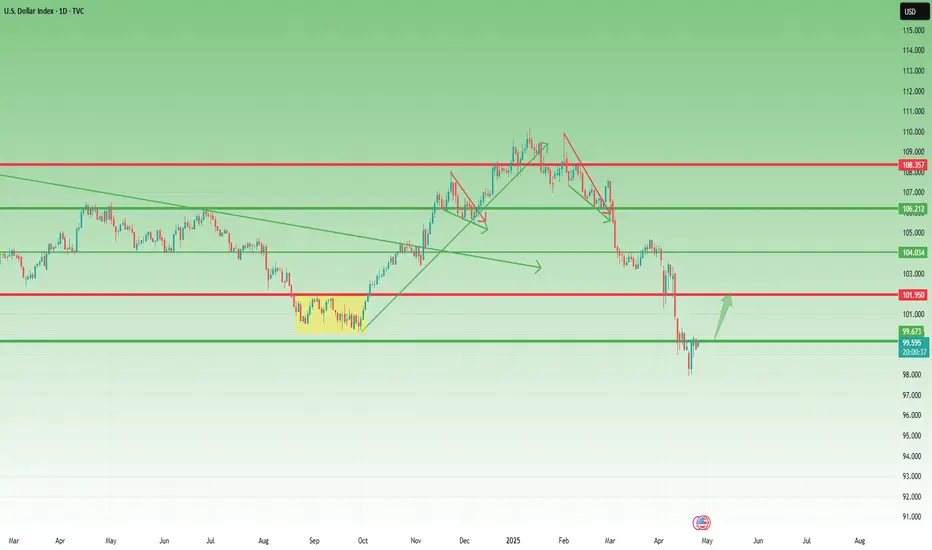
USD Index: A Possible Reversal in Sight?Since early February, right after Trump’s inauguration, the USD Index (DXY) has been under pressure, falling sharply by over 10%.
However, after hitting the 98.00 level, things seem to have stabilized. We're seeing the early signs of a relief rally.
🔍 Technical Perspective:
- This week’s candlestick pattern suggests a bullish reversal.
- The dip on Wednesday was quickly bought, showing buyer interest.
- A minor correction occurred yesterday, but dips are being well supported.
- Currently, the DXY trades around 99.60, just under the psychological level of 100.
🎯 Outlook:
As long as 98 remains intact, the bias shifts towards a potential rebound.
First target: 102 – a logical resistance zone and prior support.
This is not yet a confirmed trend reversal, but the price action is shifting. The key now is how the market reacts around the 100 level. A break above could trigger further bullish momentum.
Solana – Bear Market Rally or Reversal?Like the rest of the crypto market, Solana started rebounding on April 8th, pushing more than 50% up from the recent lows. But just like with many altcoins, I'm not convinced this is a true trend reversal. Instead, it looks more like a classic bear market rally.
Let’s not forget: SOL is coming down from nearly $300. A bounce from $95 to $150 is strong, yes—but in the bigger picture, it’s still just a correction.
📍 Key resistance zone: $160–$170
As long as price remains under this zone, the probability of another leg down remains high.
🧠 My plan:
If Solana creates a new local high around $160, I’ll be looking to sell into the rally.
🎯 Target:
$100 at least, depending on how the market reacts.

Crypto Euphoria Is Back, But Should It Be?📈 Bitcoin is back above 90k and the crowd is cheering again: moons, 150k by summer, non-stop hopium.
But is the overall picture that bullish? Not even close.
📊 Looking at the Total Market Cap chart :
- After that long November to late February consolidation, Total finally broke below the 3T support
- We retested the break and new local lows followed
- The recent bounce? Looks corrective, not impulsive
- And we’re still trading below 3T and with good percentages
❗ Conclusion:
I’m not buying into the hype.
In fact, I’m expecting a new leg lower – possibly all the way to 2T
📌 Trading Focus:
Shorting Solana and ETH

SP500 remains very bearish overall📈 In my previous post, I highlighted the confluence support zone and the potential for a bounce — and we got it. SP500 rallied around +10% off the lows.
But let’s not get too comfortable...
❓ I s the worst behind or is this just a trap before the next leg down?
From my perspective, the correction is not over.
The current bounce looks more like a bear market rally than a true reversal.
📉 Why I expect another drop:
1. Technically, as long as SP500 is trading below 5500-5600 zone, the structure remains bearish
2. Fundamentally, the backdrop hasn’t improved — if anything, it’s getting worse
3. Price is approaching a major resistance zone, which I plan to sell into
📌 My Plan:
I’m watching this zone for signs of weakness.
If momentum fades, I’ll look to short, targeting at least 5k, potentially even a new local low.
Disclosure: I am part of Trade Nation's Influencer program and receive a monthly fee for using their TradingView charts in my analyses and educational articles.

GOLD – Will the Correction Continue or Is It Over?📉 What happened yesterday?
Gold extended its drop and touched a low around 3260. A recovery of around 1000 pips followed — a typical day for Gold lately, just daily noise...
However, during the Asian Session, selling pressure kicked in again and we’re now seeing fresh weakness.
❓ Has Gold finished correcting or is there more to come?
That's the big question. And the answer might lie in the 3300 zone — specifically the 3285–3300 range. Why? Because this is where the last powerful bullish impulse started, the one that took Gold to kiss the 3500 level.
🔍 Why continuation of the correction is still possible:
- We’re seeing a retest of support, not a new higher low – this weakens the bullish case.
- The Asian Session high lines up with the old ATH, potentially forming a Head and Shoulders pattern – not confirmed, but worth watching.
At least the market madness of the past days has now given us clearer levels to work with:
→ Below 3280 = further downside possible, with 2k pips target if H&S confirms
→ Above 3350 = likely trend resumption, aiming again for 3500
📌 My trading plan:
Even though I always work with 2 scenarios, I usually have a preferred one. It's not the case at this moment, so I'm still out.
- If I see momentum above 3350, I’ll look to buy.
- If I see a break under 3300 with confirmation, I’ll look to sell continuation.
Disclosure: I am part of Trade Nation's Influencer program and receive a monthly fee for using their TradingView charts in my analyses and educational articles.
