GILD Gilead Sciences Options Ahead of EarningsIf you haven`t bought GILD before the previous earnings:
Then analyzing the options chain and the chart patterns of GILD Gilead Sciences prior to the earnings report this week,
I would consider purchasing the 80usd strike price Calls with
an expiration date of 2024-6-21,
for a premium of approximately $3.10.
If these options prove to be profitable prior to the earnings release, I would sell at least half of them.
Signalprovider

VINU LONG hello Traders, here is the full analysis for this pair, let me know in the comment section below if you have any questions, the entry will be taken only if all rules of the strategies will be satisfied. I suggest you keep this pair on your watchlist and see if the rules of your strategy are satisfied. Please also refer to the Important Risk Notice linked below.

Bitcoin- 36k zone remains my targetIn my previous Bitcoin analysis, I argued that, in my opinion, the correction for BITSTAMP:BTCUSD was not yet over, and we could potentially witness a drop to the 36k zone. Since then, the price dipped below the 40k zone and rebounded back to almost 44k. However, this rebound exhibits a corrective structure, resembling a bearish flag, suggesting that a new downward leg could follow.
In conclusion, as long as the 45k level remains intact, selling rallies could prove to be a sound strategy with favorable risk-reward potential.

Gold- where to?It has been a tough week for OANDA:XAUUSD traders with very choppy price action.
In this video, I try to see the forest from the trees I try to figure out what Gold could do next.

EurUsd could resume its up trendIn the past two weeks, EUR/USD has been very choppy.
In fact, the pair has remained relatively unchanged in terms of price since the beginning of the year.
Upon examining the chart, we notice that although the pair has reached new lows, these were very close to each other and were quickly reversed.
This type of price action typically suggests a medium-term reversal, which could indeed be the case for EUR/USD. Confirmation of an upside reversal would occur if the pair stabilizes above the 1.09 zone.
In such an instance, reaching the 1.12 zone could be feasible in Q1.

EURAUD TODAYEURAUD is HL/LL. For me is downtrend
My potential setups you see on chart.
This is not recommendation ;) Just my view.
Usully I use 3 or 4 orders with TP1-TP4
Minimal Risk reward is 1:1 NOT LESS

Gold could turn to the downside and target 2010 zoneI've held a bullish stance on OANDA:XAUUSD since the beginning of the week, anticipating a climb towards 2080 while acknowledging the 2060 resistance level. However, despite the price gaining ground and breaking above the 2040 resistance on two occasions during this period, upon closer examination of the price action, the situation is not as straightforward as anticipated. There are indications of a possible reversal to the downside, especially considering that the price rise was swiftly erased on three occasions (January 30th, 31st, and today).
Upon analyzing the chart, it becomes evident that rallies were consistently sold off. Despite still being in an upward trend, the potential for a reversal seems increasingly likely. Consequently, I'm currently refraining from any trades and am inclined to sell.
My target zone for selling is around 2010.

XCD could see a reboundAfter August's high above 0.9, KUCOIN:XDCUSDT started to drop, losing more than half of its value.
However, at this moment the coin is sitting on an important confluence support and a rebound could be next.
My target for this rebound is 0.615 recent high and considering a tight stop loss, a 1:3 risk: reward trade could be found for this coin.

Gold traders are waiting for the FEDIn my commentary from yesterday, I mentioned that as long as the price remains above the 2015 support zone, bulls hold the upper hand, and OANDA:XAUUSD could rise, potentially breaking above the 2040 resistance level. Indeed, this occurred.
However, strong volatility ensued following the break, and buyers were unable to maintain the price above this level. Gold remains in a state of uncertainty, between support and resistance for now...
Today's press conference from the Fed could shed some light and provide insight into future medium-term movements.
From a strictly technical standpoint, as I explained yesterday, the outlook is bullish, with a daily close above resistance serving as confirmation.
In such a scenario, I anticipate a continuation towards the 2080 zone.

GbpJpy to rise at 195In December, GbpJpy experienced a corrective phase, typical of JPY pairs in this period (repatriation of capital).
However, after testing the 179 support level three times, the pair reversed course at the beginning of the year, swiftly recovering previous losses and returning to previous highs.
Currently, the pair is undergoing a minor correction following its rise in January. This presents a promising opportunity to participate in the overall bullish trend. A favorable buying range lies between 185.50 and 186.50.
In terms of targets, aiming for the 195 resistance level in the medium term is reasonable.

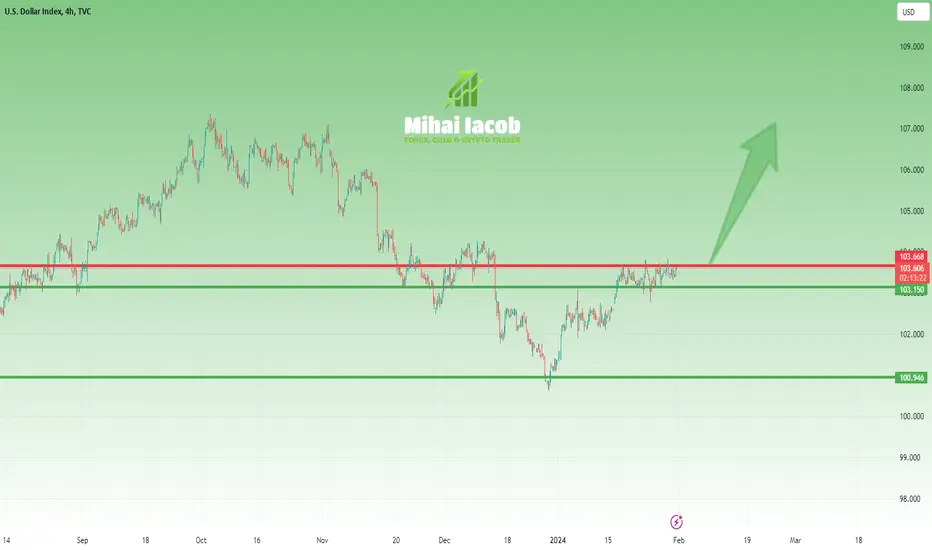
DXY: Will the Fed Be a Catalyst for Direction in the USD Index?For the past two weeks, the DXY has been trading within a frustratingly narrow range, lacking clear direction. Today's FED press conference may provide some resolution to this stagnant pattern.
Leading up to this event, prominent Fed members have cautioned against overly optimistic expectations regarding future rate cuts. They emphasized that the Fed does not intend to reduce the benchmark rate as rapidly as markets had anticipated.
Supporting data further reinforced the Fed's stance. December's CPI surpassed expectations, indicating persistent price pressures, although much of this was influenced by base effects that are now mostly behind us. Additionally, January's flash PMI data and Q4 GDP print were strong, albeit slightly lower than the 4.9% growth seen in Q3. Despite this, equity markets rallied, and the unemployment rate now stands well below 4%, suggesting a positive outlook for a 'soft landing' or 'golden path' scenario.
If the Fed identifies upside risks to services inflation due to the strong data, it will proceed with caution. However, there's a general expectation that the Fed's statement will adopt a more neutral tone.
Technically, as indicated in the posted chart, the DXY is trading within a defined range between the 103.10 zone and the 103.70 zone. A breakout from either of these zones could provide insight into a medium-term direction.
In my view, considering the market's overly optimistic anticipation of rate cuts and the upward pressure on prices, we may see a breakthrough above resistance. In such a scenario, a bullish medium-term trend could emerge, potentially driving the index back towards the 107 zone.
Gold could accelerate to the upsideAfter a false break of support and reaching the year's low just above $2,000, Gold has returned to its familiar range and has remained there for the past 10 days. However, at this juncture, the 2015 zone is providing a robust support base, prompting bullish investors to buy into dips.
I anticipate a forthcoming breach of the 2040 resistance zone, with my target set at the beginning of the year's price, which stood above 2080. In the interim, resistance is noted at 2060, which could also serve as a target for shorter-term traders.

GOLD / XAUUSD TodayGold for me still down.
On chart my option. i open another trade.
Few days ago I opened short. and I stll keep.
This is not recommendation ;) Just my view.
Usully I use 3 or 4 orders with TP1-TP4
Minimal Risk reward is 1:1 NOT LESS

ICP- I expect a new leg upIn my previous ICP post, I presented a potential trading plan for this coin. I stated that a break above 14 would indicate that the correction was over. Conversely, if we experienced a break of the symmetrical triangle to the downside, ICP/USDT could drop to 10, presenting a great buying opportunity.
The coin followed the latter scenario. As observed from the chart, it reversed precisely from the indicated support zone and reached a local high at 13. Now, ICP/USDT is undergoing a correction of this initial upward movement, potentially providing a new opportunity to enter long positions.
In conclusion, my preference is to buy dips around 11.50-11.70, with a target in the recent high zone around 16 and negation occurring under 10. Looking at the longer term, as explained in my previous posts, my target is the 20-22 zone.

Rune- Correction is probably overAfter an impressive 7x rally that began in mid-summer last year and peaked above 7, Rune initiated a correction in December, dropping 50% from its peak.
At this moment, Rune/USDT has reversed from the golden zone of the last leg up and appears poised to continue its upward trajectory.
As long as the 3.5 zone remains intact, I anticipate a retest of at least 7, if not even 10.

AudUsd to resume its up move?Two weeks ago, AUD/USD reached a significant support zone at 0.65. Following a slight rebound from this zone, the pair entered a consolidation phase throughout last week. The overall bullish trend that began in late October remains intact, suggesting that the pair may continue its upward movement.
My bullish stance persists as long as the 0.65 support level holds, with the possibility of a retest of the 0.69 high in the medium term.

GM General Motors Company Options Ahead of Earnings If you haven`t bought the dip on GM before the previous earnings:
Then analyzing the options chain and the chart patterns of GM General Motors Company prior to the earnings report this week,
I would consider purchasing the 35usd strike price at the money Puts with
an expiration date of 2024-4-19,
for a premium of approximately $1.85.
If these options prove to be profitable prior to the earnings release, I would sell at least half of them.

AUDJPY M15 / Short Trade Opportunity✅Hello Traders!
I see a confirmation of the market structure changes on M15 AUDJY. I Will execute a short trade as I expect a bearish move until the BOSS.
Traders, if you liked my idea or if you have a different vision related to this trade, write in the comments. I will be glad to see your perspective.
____________________________________
Follow, like, and comment to see my content:
www.tradingview.com

EURUSD TodayEURUSD Today for me.
My potential setups you see on chart.
This is not recommendation ;) Just my view.
Usully I use 3 or 4 orders with TP1-TP4
Minimal Risk reward is 1:1 NOT LESS
Here potential is a lot of pips ;)

Gold could continue down and drop under 2k
In yesterday's post, I said there's a good chance OANDA:XAUUSD might go below the important 2020 support level. If that happens, we could see a change in the medium-term trend. Bears were in control all day and managed to break that level, hitting a low of 2002.
Technically, breaking the upward trend line, smashing through horizontal support, and setting a new low for the year suggests XauUsd might keep going down, with 1980 as the likely next stopping point.
The bearish scenario is negated by a break back above yesterday's high

XRP to 10usd, what about 30 cents?I frequently watch various XRP videos where individuals predict a price surge, ranging from $10 (the "less" optimistic view) to $100 or even $1000. These predictions often come with fantastical explanations about why such increases will occur.
However, the harsh reality contradicts these optimistic forecasts, as XRP hasn't shown significant movement during this bullish trend. Despite an initial rise of approximately 50%, this gain has been nearly entirely offset.
Analyzing the chart reveals a conspicuous presence of selling pressure, with each upward spike promptly followed by selling activity.
From a strictly technical standpoint, if XRP falls below $0.5, the path to $0.3 seems inevitable, carrying a high probability of a drop to that level.
The bearish scenario can be dismissed if XRP rises above $0.65, but even in such a situation, substantial growth seems unlikely. From my perspective, $1 is the most optimistic scenario for this coin, even under the best circumstances.

EurUsd- Strongly bearish under 1.0950As mentioned in my analysis of OANDA:EURUSD from two days ago, the pair failed to break above 1.1. Consequently, there was a potential for it to dip below the support level and continue its decline to the next significant support at 1.0750.
Indeed, the price dropped below the support zone and hit a local low at 1.0845 yesterday. Currently, the pair is undergoing an upward correction, presenting an opportunity for short trades.
In my view, any rallies toward 1.0950 should be considered for selling. Depending on risk tolerance and patience, the target can be set at either the recent low of 1.0850 or the major support at 1.0750.
The negation of this scenario occurs if EURUSD manages to break above 1.1.

MOB long idea 55% gains dont miss hello Traders, here is the full analysis for this pair, let me know in the comment section below if you have any questions, the entry will be taken only if all rules of the strategies will be satisfied. I suggest you keep this pair on your watchlist and see if the rules of your strategy are satisfied. Please also refer to the Important Risk Notice linked below.
