Lingrid | GOLD Short-Term Correction From Psychological LevelOANDA:XAUUSD is currently retesting the broken triangle structure from below, having rebounded from the ascending support zone. The price is approaching a confluence near 3,400–3410, where prior breakdown and resistance meet. If this level holds as resistance, the setup favors a bearish continuation toward 3,340 and possibly deeper. The broader structure shows lower highs and increasing rejection pressure below the resistance zone.
📉 Key Levels
Sell trigger: 3,400 rejection
Sell zone: 3,398.660–3,410
Target: 3,340
Invalidation: Break and hold above 3,410
💡 Risks
Momentum from recent rebound could challenge resistance
A higher low formation could tilt sentiment bullish
External factors (Fed, inflation data) may inject volatility beyond the range
If this idea resonates with you or you have your own opinion, traders, hit the comments. I’m excited to read your thoughts!
Signals

Gold – Bulls Hold the Line, Pressure Builds for Upside BreakoutIn yesterday’s analysis, I argued that following Tuesday’s reversal — which printed a strong continuation bullish Pin Bar — buyers had regained control despite the intraday pullback.
For this reason, I suggested looking to buy dips, as the structure remained constructive.
And once again, during yesterday’s session, the scenario repeated itself.
The drop toward the 3360 zone was met with renewed buying interest, keeping the bullish structure intact.
________________________________________
🔍 Technical Context – Higher Lows Building Pressure
At the time of writing, Gold is trading around 3380, a short-term resistance area that has capped gains so far.
However, the technical picture remains bullish:
Starting with Monday’s low at 3340, which came after a strong impulsive leg up, price has printed a clear succession of higher lows.
This behavior strongly suggests increasing buying pressure and builds the case for a potential breakout to the upside.
________________________________________
🎯 Trading Bias – Holding My Long Position
My bias remains bullish.
In fact, I’m currently holding a long position, entered yesterday, which is now running with a 150 pips unrealized profit.
I’m sticking with the trade, anticipating that a confirmed break above 3380–3390 could trigger upside acceleration toward my final target — a 750 pips profit objective.
________________________________________
🔄 What to Watch Next
• Daily close: A close above 3380=3385 zone would add confirmation to the bullish thesis.
• Key support: The zone around 3360 is now support.
• Breakout trigger: A move above 3380–3385 could unleash momentum buying and open the path to higher levels.
________________________________________
Let’s stay patient and let the market confirm the breakout.
Until then, the structure favors the bulls. 🚀
Disclosure: I am part of TradeNation's Influencer program and receive a monthly fee for using their TradingView charts in my analyses and educational articles.

Lingrid | GBPUSD Shorting Opportunity At Confluence ZoneThe price perfectly fulfilled my previous idea . FX:GBPUSD is climbing toward the key confluence zone between the downward channel resistance and the 1.34418 horizontal level. The broader trend remains bearish, with repeated lower highs and clear rejection patterns near trendline resistance. A rejection at 1.34418 could trigger another leg lower toward the 1.32500 zone. As long as the pair remains under the red trendline, bearish continuation remains in play.
📉 Key Levels
Sell trigger: Rejection near 1.34418
Sell zone: 1.34418–1.34500
Target: 1.32500
Invalidation: Break and close above 1.34500
💡 Risks
A strong breakout above 1.34500 may flip the structure into bullish
Macro news events could override technical rejection zones
Sideways movement near resistance may reduce clarity of setup
If this idea resonates with you or you have your own opinion, traders, hit the comments. I’m excited to read your thoughts!

XAUUSD – Bears Gave It a Shot, But Bulls Still in Control1. Quick recap of yesterday
In yesterday’s analysis, I highlighted the possibility of a short-term correction on Gold and noted that, although risky, a short trade could be justified. Acting on that conviction, I took a short with a sniper entry, capturing over 250 pips in floating profit. However, Gold found strong support around 3350 and reversed aggressively. I closed the trade with a more modest +140 pips gain.
2. Key development: NY session reversal
Despite early signs of weakness, the New York session flipped the script, sending Gold back toward the top of the daily range. The daily close near highs tells us one thing:
➡️ The bulls aren’t done just yet.
3. Technical outlook
• Resistance remains firm at 3375–3380+ zone
• A clear breakout above this zone opens the door for 3400+, with a likely magnet at 3430
• As long as the market holds above this week’s low, dips are buyable opportunities
4. Trading plan
For now, the bias shifts back to the long side. I’m watching for intraday dips to build longs, with invalidation below this week’s low. The structure favors continuation — but only if 3380 gives way we have confirmation.
5. Final thoughts
Gold may have teased the bears, but the real power still lies with the bulls. If momentum kicks in above 3380, we could be on our way to test 3430 soon. 🏹
Disclosure: I am part of TradeNation's Influencer program and receive a monthly fee for using their TradingView charts in my analyses and educational articles.

Lingrid | BNBUSDT Potential Bullish ContinuationThe price perfectly fulfilled my previous idea . BINANCE:BNBUSDT is rebounding from a higher low along the upward trendline, maintaining its position within the broader bullish channel. After the recent retracement from the peak at resistance, price has stabilized above 750, suggesting accumulation before a potential push higher. As long as it holds the trendline and the key 735–750 support zone, bulls are likely to target the 820 level next. This bullish continuation is fueled by a strong structure of higher lows and a healthy trend.
📉 Key Levels
Buy trigger: Close above 780
Buy zone: 735–750
Target: 820
Invalidation: Break below 730
💡 Risks
Failure to hold 735 support may trigger deeper pullback toward 700
Rejection at 780 could result in extended range-bound movement
Resistance near 820 may cap gains without strong momentum
If this idea resonates with you or you have your own opinion, traders, hit the comments. I’m excited to read your thoughts!

Gold Is Conquering New Highs!Hello everyone, what do you think about XAUUSD?
Gold has had an impressive week of growth, currently approaching its historical peak at 3,380 USD/ounce.
This is a clear sign of the precious metal's sustained strength amidst a volatile market. Weak U.S. employment data, along with expectations that the Federal Reserve (Fed) may cut interest rates in September, have weakened the USD, which in turn has propelled gold to new heights.
From a technical standpoint, gold is trading in an upward channel and continuously recovering from solid support levels, indicating strong buying momentum. Notably, we’ve seen a bearish crossover at the EMA 34 and 89 lines, along with a break below the previous uptrend line – both of which strengthen the current upward move.
If there is any pullback before the next leg up, Support 1 (which aligns with the lower boundary of the upward channel and the EMA lines) will be an important area to watch. This could be the ideal zone for potential trade setups.
Looking ahead, the next resistance target is around 3,440 USD. If this level is broken, nothing will hold gold back from pushing even higher, possibly heading toward the psychological 3,500 USD level.
What do you think? Will XAUUSD continue its breakout this week? Drop your thoughts in the comments below!

EURUSD Holds Above 1.1600 – Where Will The Upside Go?Hey everyone, do you think EURUSD will continue to rise?
Yesterday, EUR/USD had a strong rally, breaking through the 1.1600 level, and it’s currently holding its gains in today’s European session.
The main reason behind this rise is an improved risk sentiment, making it harder for the US dollar to gain traction. Investors are awaiting comments from Fed officials, which is providing support to EURUSD.
In the short term, the market seems ready for another push higher. The next key resistance level to watch is 1.1800, and if it breaks through, the path towards 1.19XX could open up.
What do you think? Will EURUSD continue this strong upward momentum? Share your thoughts below!
Good luck with your trading!

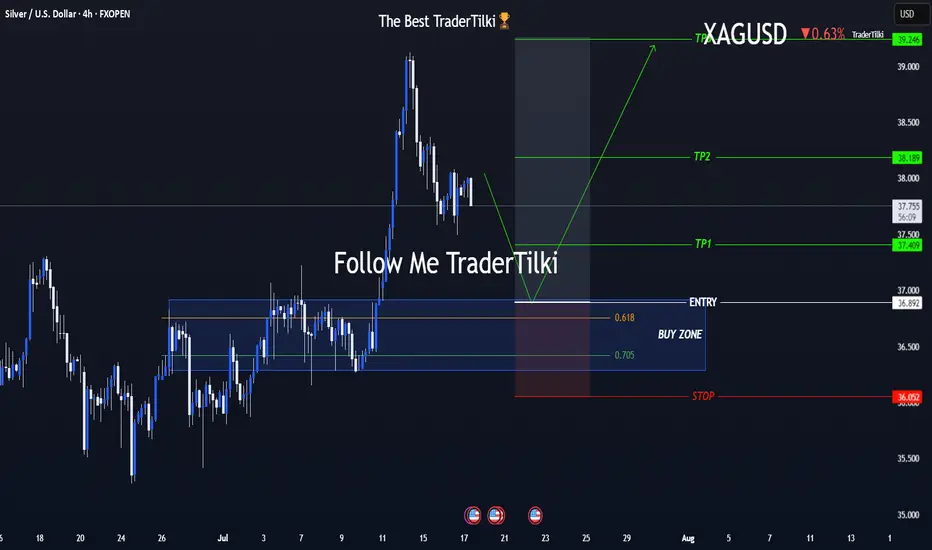
One Shot, Clear Strategy – Silver Buy Zone in SightHey everyone 👋
📌 BUY LIMIT ORDER / XAGUSD-SILVER Key Levels
🟢 Entry: 36,892
🎯 Target 1: 37,409
🎯 Target 2: 38,189
🎯 Target 3: 39,246
🔴 Stop: 36,052
📈 Risk/Reward Ratio: 2,79
I double-checked the levels and put together a clean, focused analysis just for you. Every single like seriously boosts my motivation to keep sharing 📈 Your support means the world to me! Huge thanks to everyone who likes and backs this work 💙 Our goals are crystal clear, our strategy is solid. Let’s keep moving forward with confidence and smart execution!
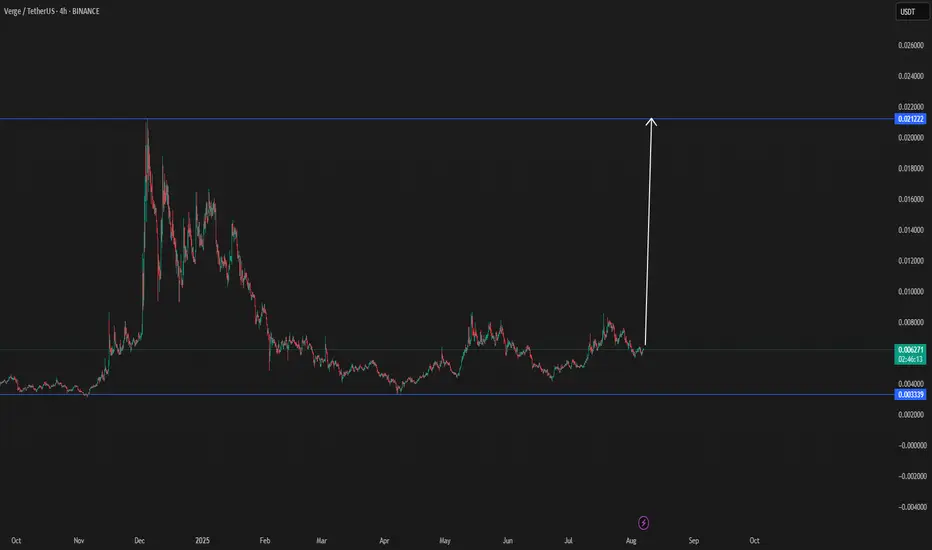
XVG (VERGE) BACK TO OLD TIMES up $0,01There is new data that shows an increase in interest of the verge increase.
This could mean a new return to the up $0,01 price action
I did expect before the floki increase from start to end, and expecting verge to taking the same way.
Last break was able to do in 2 days and 16H
XAUUSD Gold Trading Strategy August 7, 2025XAUUSD Gold Trading Strategy August 7, 2025:
Gold prices are steady as US President Donald Trump has imposed an additional 25% tariff on Indian goods due to India's continued purchases of Russian energy. This new measure raises the current 25% tariff on Indian goods to 50%.
Fundamental news: The current market pulse is still mainly revolving around the tariff story initiated by Trump, in which spot gold is trading in a fairly narrow range. Gold is still waiting for further impact from the Fed's interest rate cut process, a weaker dollar will create support for non-yielding gold.
Technical analysis: The trading range of gold prices is currently narrowing, RSI on H1 and H4 frames is approaching the overbought zone. Gold prices have recovered, but resistance zones such as 3400 - 3405 and 3420 - 3425 can be short-term profit-taking areas for investors. Liquidity zones and Fibonacci frames show that the upward force of gold prices is showing signs of slowing down.
Important price zones today: 3373 - 3378, 3400 - 3405 and 3420 - 3425.
Trading trend today: SELL.
Recommended orders:
Plan 1: SELL XAUUSD zone 3402 - 3404
SL 3407
TP 3399 - 3390 - 3380 - 3360 - OPEN.
Plan 2: SELL XAUUSD zone 3423 - 3425
SL 3428
TP 3420 - 3410 - 3390 - 3370 - OPEN.
Plan 3: BUY XAUUSD zone 3373 - 3375
SL 3370
TP 3378 - 3388 - 3400 (small volume).
Wishing you a safe, successful and profitable trading day.💗💗💗💗💗

GBP/JPY Trap? Smart Money Might Be Setting Up the Next Drop📊 1. Technical Overview
Price broke the bullish structure decisively, closing below a key demand zone between 195.00–196.00, leaving a large unfilled imbalance.
Last week's recovery candle suggests a potential pullback toward 197.40–197.80, now acting as a resistance confluence.
The descending channel and weak RSI further support a continuation of the bearish trend.
Bearish targets: 193.50 and 192.20
📈 2. COT (Commitment of Traders) Report
GBP:
Non-commercials are cutting long positions (–5,961) and adding shorts (+6,637) → Bearish divergence developing on GBP.
JPY:
Non-commercials are heavily increasing short exposure (+15,113), but remain strongly net-long overall, indicating a potential exhaustion of bullish JPY positioning.
💭 3. Retail Sentiment
Positioning is neutral: 51% long / 49% short.
This balance suggests no excessive retail bias, leaving room for directional moves without immediate contrarian pressure.
📆 4. Seasonality
August is historically bearish for GBP/JPY:
• –2.82% (20Y average)
• –3.04% (15Y average)
• –1.44% (5Y average)
The data shows a consistent historical bias to the downside during this month.
🎯 5. Strategic Outlook
• Primary Bias: Bearish below 197.40–197.80
• Invalidation: Weekly close above 198.10
• Targets: 195.00 > 193.50 > 192.20
The confluence of technical rejection, bearish COT dynamics, neutral sentiment, and negative seasonality supports a corrective scenario for August.

EUR-NZD Local Long! Buy!
Hello,Traders!
EUR-NZD made a retest
Of the horizontal support
Level of 1.9540 from where
We are already seeing a
Local bullish rebound so
We will be expecting a
Further bullish move up
Buy!
Comment and subscribe to help us grow!
Check out other forecasts below too!
Disclosure: I am part of Trade Nation's Influencer program and receive a monthly fee for using their TradingView charts in my analysis.

SILVER: Strong Bearish Sentiment! Short!
My dear friends,
Today we will analyse SILVER together☺️
The recent price action suggests a shift in mid-term momentum. A break below the current local range around 38.167 will confirm the new direction downwards with the target being the next key level of 37.993.and a reconvened placement of a stop-loss beyond the range.
❤️Sending you lots of Love and Hugs❤️

SILVER WILL GO UP|LONG|
✅SILVER is going up
Now and the pair made a bullish
Breakout of the key horizontal
Level of 37.73$ and the breakout
Is confirmed so we are bullish
Biased and we will be expecting
A further bullish move up
LONG🚀
✅Like and subscribe to never miss a new idea!✅

BTC cares US liquidity risks in AugustMorning folks,
So, in general as you can see our upside AB=CD that we discussed last time is working. But...
as you know BTC is strongly related to liquidity dynamic on US domestic system. This month Mr. Bessent wants to re-finance 1Trln in debt, with net borrowing around 250 Bln. Hardly BTC will get a small chunk of this funds.
it means that the volatility could rise significantly in nearest 1-2 weeks with downside price gravitating. Overall action looks rather heavy. Maybe BTC somehow will complete AB=CD target around 116.20-116.25K, but now this action looks like retracement - no thrust, slow action a lot of overlapping candles. So lows might be re-tested or even broken.
In current situation we think it would be better to not take any new longs and watch for clarity. If you have position already - move stops to breakeven.

Lingrid | GOLD Potential Bullish Extension Following Pullback OANDA:XAUUSD is rebounding strongly from the support zone after a deep correction from the previous top near 3,437. The price has broken back above the range and formed a new impulse leg, now hovering just above the upward trendline. As long as the structure holds above 3,330, further continuation toward the 3,410–3,437 resistance zone remains likely. The projected wave path shows a bullish scenario targeting a retest of the top trendline.
📉 Key Levels
Buy trigger: Above 3,360
Buy zone: 3,330–3,340
Target: 3,410
Invalidation: Below 3,320
💡 Risks
Rejection from 3,360 trendline may lead to retracement
Failure to hold above 3,330 support could shift bias bearish
Upcoming macroeconomic data might increase volatility
If this idea resonates with you or you have your own opinion, traders, hit the comments. I’m excited to read your thoughts!

Lingrid | XRPUSDT Potential Upside Move From Support ZoneThe price perfectly fulfilled my previous idea . BINANCE:XRPUSDT is rebounding after a breakout from the consolidation zone and testing support around 2.897. The price is forming a bullish structure within a downward channel, aiming to reclaim the mid-level resistance. As long as it remains above 2.897, the bullish wave has room to target the descending channel’s upper boundary near 3.230. Momentum is gradually shifting toward upside continuation following the recent breakout and rebound.
📉 Key Levels
Buy trigger: Break and hold above 2.960
Buy zone: 2.850–2.960
Target: 3.230
Invalidation: Drop below 2.740
💡 Risks
Failure to hold 2.870 could invalidate the rebound
Overall channel remains bearish, posing structural resistance
Broader market sentiment may weigh on breakout momentum
If this idea resonates with you or you have your own opinion, traders, hit the comments. I’m excited to read your thoughts!

EURUSD: Will Go Up! Long!
My dear friends,
Today we will analyse EURUSD together☺️
The market is at an inflection zone and price has now reached an area around 1.16337 where previous reversals or breakouts have occurred.And a price reaction that we are seeing on multiple timeframes here could signal the next move up so we can enter on confirmation, and target the next key level of 1.16551.Stop-loss is recommended beyond the inflection zone.
❤️Sending you lots of Love and Hugs❤️

XAUUSD Gold Trading Strategy August 7, 2025XAUUSD Gold Trading Strategy August 7, 2025:
Gold prices are steady as US President Donald Trump has imposed an additional 25% tariff on Indian goods due to India's continued purchases of Russian energy. This new measure raises the current 25% tariff on Indian goods to 50%.
Fundamental news: The current market pulse is still mainly revolving around the tariff story initiated by Trump, in which spot gold is trading in a fairly narrow range. Gold is still waiting for further impact from the Fed's interest rate cut process, a weaker dollar will create support for non-yielding gold.
Technical analysis: The trading range of gold prices is currently narrowing, RSI on H1 and H4 frames is approaching the overbought zone. Gold prices have recovered, but resistance zones such as 3400 - 3405 and 3420 - 3425 can be short-term profit-taking areas for investors. Liquidity zones and Fibonacci frames show that the upward force of gold prices is showing signs of slowing down.
Important price zones today: 3373 - 3378, 3400 - 3405 and 3420 - 3425.
Trading trend today: SELL.
Recommended orders:
Plan 1: SELL XAUUSD zone 3402 - 3404
SL 3407
TP 3399 - 3390 - 3380 - 3360 - OPEN.
Plan 2: SELL XAUUSD zone 3423 - 3425
SL 3428
TP 3420 - 3410 - 3390 - 3370 - OPEN.
Plan 3: BUY XAUUSD zone 3373 - 3375
SL 3370
TP 3378 - 3388 - 3400 (small volume).
Wishing you a safe, successful and profitable trading day.💗💗💗💗💗

Lingrid | GBPAUD Consolidation - Continuation ScenarioFX:GBPAUD is breaking down from the upward trendline and testing key horizontal support near 2.0500 after rejecting from a lower high in the downward channel. This structure confirms a bearish continuation bias within the broader descending pattern. A clean break below 2.0500 opens the path toward the next support level around 2.0358. The failure to reclaim the lower high signals growing bearish pressure on the pair.
📉 Key Levels
Sell trigger: Break and hold below 2.0500
Sell zone: 2.0500–2.0480
Target: 2.0358
Invalidation: Return above 2.0506
💡 Risks
Bullish defense of 2.0500 could trigger a rebound
Re-entry into the broken trendline may trap sellers
Broader AUD weakness may delay downside move
If this idea resonates with you or you have your own opinion, traders, hit the comments. I’m excited to read your thoughts!

NATGAS WILL FALL|SHORT|
✅NATGAS made a retest of the
Strong horizontal resistance level of 3.150$
And as you can see the price is already
Making a local pullback from
The level which sends a clear
Bearish signal to us therefore
We will be expecting a
Further bearish correction
SHORT🔥
✅Like and subscribe to never miss a new idea!✅

Gold Price Action Update: Neutral to Bearish BiasThis week, apart from my short trade on Tuesday, I’ve maintained a bullish outlook on Gold, suggesting buying the dips with the expectation of a breakout above the 3380-85 zone. I was targeting an acceleration above 3400 and eventually 3440. I followed through with this idea and bought in anticipation of the move.
However, something about Gold's recent price action raised a red flag for me, prompting me to close my buy positions. Let’s break it down:
Starting yesterday morning, the price action became erratic. Initially, we saw the expected breakout, but it was quickly reversed, and the price action turned choppy. Then came a series of quick pumps, followed by quick reversals—each time the market would move up, only to fall back again. As of writing, we’re sitting at 3388.
This kind of erratic movement usually suggests that we’re nearing a top, and even if Gold spikes again above 3400, I don’t want to hold positions in a market that’s so volatile and unsustainable in either direction.
So, I’m out for now, adopting a neutral to bearish stance.
If the price drops below 3370, it would indicate a likely top formation, and at that point, I’ll be looking to sell rallies; till then, wait and see.
Disclosure: I am part of TradeNation's Influencer program and receive a monthly fee for using their TradingView charts in my analyses and educational articles.

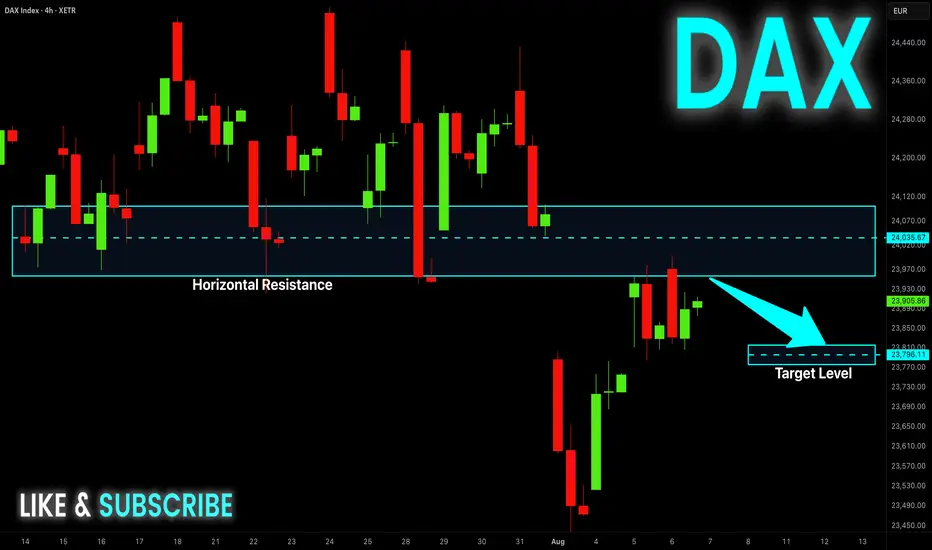
DAX Potential Short! Sell!
Hello,Traders!
DAX went up nicely
But is now about to hit
A horizontal resistance
Around 24,000 so after
The retest we will be
Expecting a local pullback
Sell!
Comment and subscribe to help us grow!
Check out other forecasts below too!
Disclosure: I am part of Trade Nation's Influencer program and receive a monthly fee for using their TradingView charts in my analysis.