NAS100 steadies at high levels, pay attention nextThe most recent move on NAS100 saw a sharp drop that briefly recovered, likely triggering stops before aggressively reversing from the lower boundary of the newly projected channel. This isn't a cause for concern, on the contrary, it's another opportunity to get involved.
That is because this drop and recovery is a common behavior in strong uptrends before resuming bullish momentum.
The market is likely in the early stages of a new impulsive leg to the upside right here.
We could either have short-term consolidation or pullback, then a continuation toward the upper channel boundary or straight upwards, and with NAS100, the latter is more plausible.
My target will be at 23,300 around the upper boundary of the projected channel resistance.
In this context, the market remains bullish clearly. The most interesting aspect is the emotional flush on the last drop, trapping sellers before fueling what could be another big leg up.
Signals

Lingrid | GOLD Corrective Move: Potential Long Trade OpportunityThe price perfectly fulfilled my last idea . OANDA:XAUUSD is pulling back sharply after facing rejection from the key resistance level at 3431, following a two-leg impulse wave. The structure shows a correction within an active uptrend, nearing confluence support from the upward trendline and horizontal level. As long as price holds above 3342, a bounce and continuation toward 3400 remain the favored scenario. Broader bullish structure and momentum buildup point to a possible resumption after the current retracement.
📉 Key Levels
Buy trigger: Break above 3350
Buy zone: 3345 – 3340
Target: 3400
Invalidation: Break below 3320
💡 Risks
Failure to hold the upward trendline could shift momentum
Weak bounce may trap buyers before real breakout
Resistance at 3400 could remain firm without stronger volume support
If this idea resonates with you or you have your own opinion, traders, hit the comments. I’m excited to read your thoughts!

Lingrid | TONUSDT Potential Rebound from Support ZoneThe price perfectly fulfilled my last idea . OKX:TONUSDT is testing support after pulling back from the consolidation zone and forming a higher low above key structure. The chart shows a breakout from the downward trendline followed by a corrective retracement back toward confluence support. As long as price stays above 2.903, a bounce and renewed move toward 3.595 remains the base case. Structure favors bullish continuation after the retest of the breakout level.
📉 Key Levels
Buy trigger: Break and hold above 3.200
Buy zone: 2.903 – 3.050
Target: 3.595
Invalidation: Break below 2.903
💡 Risks
Failure to hold confluence of upward trendline and horizontal support
Weak follow-through above 3.2 could indicate distribution
Resistance at 3.595 may trigger renewed selling before breakout
If this idea resonates with you or you have your own opinion, traders, hit the comments. I’m excited to read your thoughts!

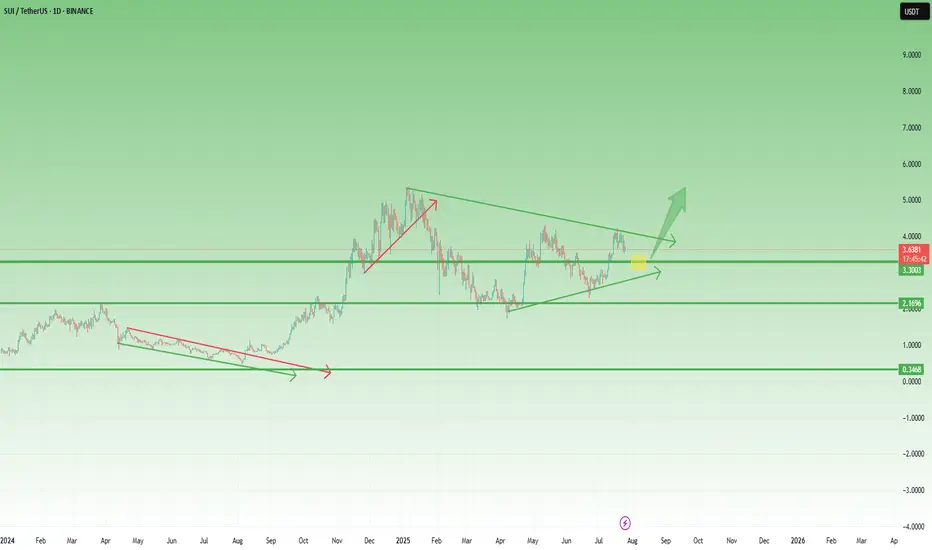
SUI – Preparing for a Breakout? Symmetrical Triangle in PlaySince the beginning of the year, SUI has been consolidating inside a classic symmetrical triangle — marked by higher lows and lower highs, a sign of tightening price action and growing pressure.
This kind of structure doesn’t last forever.
Usually, it ends with a strong breakout — especially if supported by volume.
🔍 What to watch:
- A break above the upper trendline could trigger a strong move, with potential targets in the $5 area and even a new ATH, if altcoins enter a real revival phase.
- On the flip side, $2.80 remains the key support level.
As long as it holds, bulls remain in control of the structure.
📍 My game plan:
I’m watching the $3.25 area as a potential buy zone —a great spot inside the pattern, offering tight risk and strong upside if the breakout comes.
Until then, it’s all about patience.
Pressure is building. The triangle is tightening.
And the market is waiting for a reason to move.
ETHEREUM Massive Triangle break-out ahead??Ethereum (ETHUSD) has been trading within a 4-year Triangle for the entirety of this Cycle. The recent post April rally has been the most aggressive since the parabolic rally that led to the Top of the previous Cycle.
The price is now almost on the top (Lower Highs trend-line) of the Triangle. A break above it, can initiate an aggressive Bullish Leg towards the 1.618 Fibonacci extension ($8000), which was the level that was marginally exceeded during ETH's first rally of this Cycle.
-------------------------------------------------------------------------------
** Please LIKE 👍, FOLLOW ✅, SHARE 🙌 and COMMENT ✍ if you enjoy this idea! Also share your ideas and charts in the comments section below! This is best way to keep it relevant, support us, keep the content here free and allow the idea to reach as many people as possible. **
-------------------------------------------------------------------------------
💸💸💸💸💸💸
👇 👇 👇 👇 👇 👇

NZD-CHF Local Bearish Bias! Sell!
Hello,Traders!
NZD-CHF made a retest of
The horizontal resistance
of 0.4810 so we are locally
Bearish biased and we
Will be expecting a
Further bearish move down
Sell!
Comment and subscribe to help us grow!
Check out other forecasts below too!
Disclosure: I am part of Trade Nation's Influencer program and receive a monthly fee for using their TradingView charts in my analysis.

NZD_CAD POTENTIAL SHORT|
✅NZD_CAD has been growing recently
And the pair seems locally overbought
So as the pair is approaching
A horizontal resistance of 0.8260
Price decline is to be expected
SHORT🔥
✅Like and subscribe to never miss a new idea!✅
Disclosure: I am part of Trade Nation's Influencer program and receive a monthly fee for using their TradingView charts in my analysis.

S&P500 This is why every CORRECTION is a GIFT.The S&P500 index (SPX) has been steadily rising since the April bottom to new All Time Highs (ATH). On the grand 100 year scale, the February - March tariff fueled correction, has been nothing significant. The last true technical correction has been the 2022 Inflation Crisis because it touched, and instantly rebounded on, the 1M MA50 (blue trend-line).
This is not the first time we bring forward our multi-decade perspective on stock and in particular this chart. But it serves well, keeping us into the meaningful long-term outlook of the market. This suggests that since the Great Depression and the first signs of recovery after the 1935 - 1941 Bear Cycle, the market has entered a multi-decade Channel Up, which is divided into long-term aggressive expansion periods (Bull Cycles) and shorter term depressions (Bear Cycles).
During a Bull Cycle, every test of the 1M MA50 is a instant cyclical buy opportunity and in fact that isn't presented very often. During a Bear Cycle, the market makes an initial aggressive correction below the 1M MA50, turns increasingly volatile for 5-7 years, trading sideways within the Channel Up with its second peak resulting into a 2nd correction that eventually breaks below the 1M MA200 (orange trend-line).
That is what we call a 'generational buy opportunity' as in the past 80 years, it has only been taken place 2 times.
Right now (again this is not something we mention for the first time), the market is at the start of the A.I. Bubble, with incredibly strong similarities with the Internet Bubble of the 1990s.
In fact, relative to the Internet Bubble, it appears that we are on a stage similar to 1993 - 1994, before the market turned parabolic to the eventual Dotcom Bust of 2000.
As a result, from a technical perspective, every 'small' correction such as the one we had this year, is a blessing in disguise (buy opportunity). As the index grew by 5 times during the Internet Bubble (300 to 1500), it is also very possible to see it approach this feat going from roughly 3500 (late 2022) to 14000 (by late 2032) and touch the top of the multi-decade Channel Up.
Are you willing to miss out on this generational wealth creation opportunity?
-------------------------------------------------------------------------------
** Please LIKE 👍, FOLLOW ✅, SHARE 🙌 and COMMENT ✍ if you enjoy this idea! Also share your ideas and charts in the comments section below! This is best way to keep it relevant, support us, keep the content here free and allow the idea to reach as many people as possible. **
-------------------------------------------------------------------------------
💸💸💸💸💸💸
👇 👇 👇 👇 👇 👇

AUD-NZD Local Long! Buy!
Hello,Traders!
AUD-NZD is about to retest
A strong horizontal support
Level of 1.0912 and as we are
Bullish biased we will be expecting
A local bullish rebound
Buy!
Comment and subscribe to help us grow!
Check out other forecasts below too!
Disclosure: I am part of Trade Nation's Influencer program and receive a monthly fee for using their TradingView charts in my analysis.

NZD_JPY SHORT FROM RESISTANCE|
✅NZD_JPY is going up now
But a strong resistance level is ahead at 88.900
Thus I am expecting a pullback
And a move down towards the target of 88.572
SHORT🔥
✅Like and subscribe to never miss a new idea!✅
Disclosure: I am part of Trade Nation's Influencer program and receive a monthly fee for using their TradingView charts in my analysis.

EUR-CAD Bullish Wedge! Buy!
Hello,Traders!
EUR-CAD is trading in an
Uptrend and the pair formed
A bullish wedge pattern and
Now we are seeing a bullish
Breakout from the wedge so
We are bullish biased and we
Will be expecting a further
Bullish move up
Buy!
Comment and subscribe to help us grow!
Check out other forecasts below too!
Disclosure: I am part of Trade Nation's Influencer program and receive a monthly fee for using their TradingView charts in my analysis.

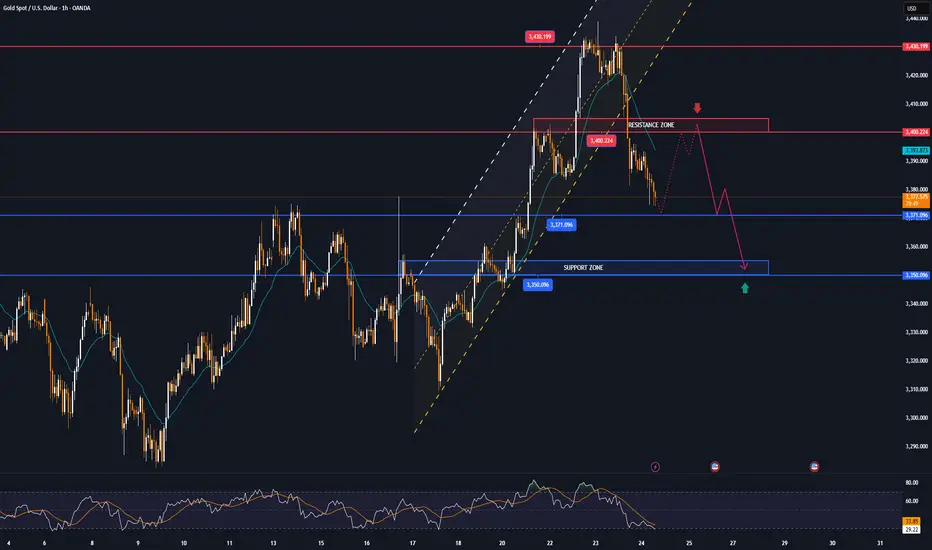
From 3,430 USD GOLD falls below 3,400 USD on optimistic newsOANDA:XAUUSD has suffered a sharp sell-off after rising sharply earlier in the week. Media reports said the United States and the European Union were getting closer to reaching a tariff deal, and the news weighed on safe-haven demand.
OANDA:XAUUSD fell below $3,400 an ounce on Wednesday, down more than 1.2%, following news that the United States and the European Union were close to signing a deal similar to the one Washington and Tokyo signed on Tuesday. It is now trading below that key base point.
The European Union and the United States are moving toward a trade deal that could see more EU goods hit with a 15 percent U.S. import tariff, two diplomats said. Earlier, U.S. President Donald Trump reached a trade deal with Japan that would cut auto tariffs to 15 percent.
Optimism about an imminent U.S.-EU trade deal overshadowed a decline in the U.S. dollar. The U.S. dollar index (DXY), which measures the greenback against a basket of six currencies, fell 0.05 percent on the day to 97.160.
U.S. Treasury yields rose, with the 10-year Treasury yield rising to 4.396%. U.S. real yields, calculated by subtracting inflation expectations from nominal yields, rose nearly 4 basis points to 1.994%.
Gold tends to gain in value during times of uncertainty and low-interest-rate environments because gold itself does not generate interest, and in low-interest-rate environments, the opportunity cost of holding gold is relatively low.
U.S., EU near trade deal
The Financial Times reported on Wednesday that the European Union and the United States are close to reaching a trade deal that would impose a 15% tariff on imports from Europe, similar to the one reached between US President Donald Trump and Japan this week.
The Financial Times reported that Brussels is likely to agree to so-called “reciprocal tariffs” to avoid tariffs that Trump has threatened to impose on EU goods of up to 30% from August 1.
“The agreement reached with Japan is clearly extortionate in terms. Most member states are swallowing their anger and are likely to accept the deal,” an EU diplomat said.
The two sides will exempt some products, including aircraft, spirits and medical equipment, from tariffs.
The agreement between the US and Japan has also left Brussels reluctant to accept higher reciprocal tariffs to avoid a damaging trade war, according to the Financial Times.
Technical Outlook Analysis OANDA:XAUUSD
On the daily chart, after gold reached its target at $3,430, it failed to break above this important resistance level and fell slightly. The decline brought gold back to test the support confluence area, which is the location of the 0.236% Fibonacci retracement with the lower edge of the price channel. And with the current position, gold still technically has enough conditions for a possible increase in price.
Specifically, gold is still in/above the supports from the short-term price channel, the long-term rising price channel and the support from the EMA21, as long as gold is still trading above the EMA21, it still has a bullish outlook in the short term. On the other hand, the short-term target is still at 3,430 USD, while once the 3,430 USD level is broken, it will provide the possibility of further upside with the next target at around 3,450 USD in the short term, more than the all-time high.
RSI remains above 50, far from the 80 – 100 area (overbought area). Showing that there is still a lot of room for upside ahead.
During the day, the technical outlook for gold prices continues to favor upside and notable positions will be listed as follows.
Support: 3,371 – 3,350 USD
Resistance: 3,400 – 3,430 – 3,450 USD
SELL XAUUSD PRICE 3421 - 3419⚡️
↠↠ Stop Loss 3425
→Take Profit 1 3413
↨
→Take Profit 2 3407
BUY XAUUSD PRICE 3354 - 3356⚡️
↠↠ Stop Loss 3350
→Take Profit 1 3362
↨
→Take Profit 2 3368
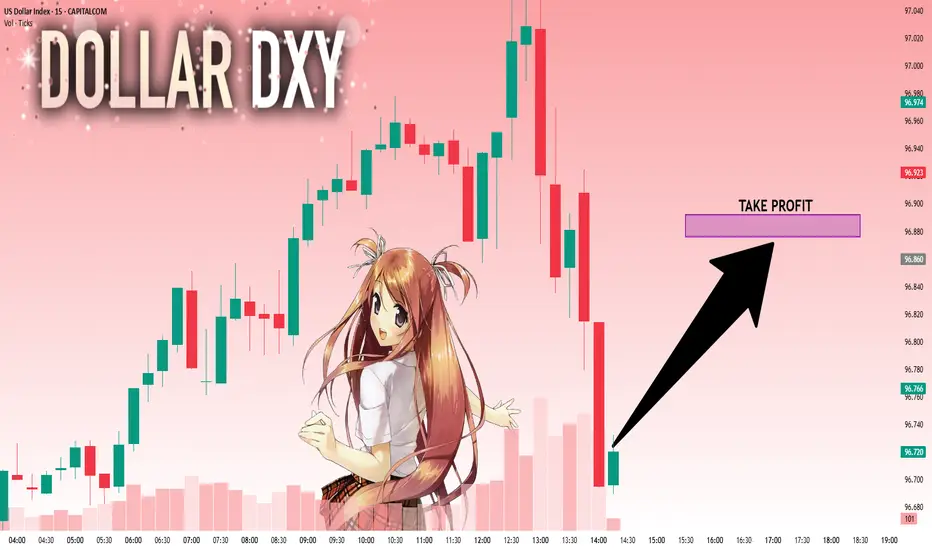
DXY: Strong Bullish Sentiment! Long!
My dear friends,
Today we will analyse DXY together☺️
The in-trend continuation seems likely as the current long-term trend appears to be strong, and price is holding above a key level of 96.722 So a bullish continuation seems plausible, targeting the next high. We should enter on confirmation, and place a stop-loss beyond the recent swing level.
❤️Sending you lots of Love and Hugs❤️
GBPNZD: Bullish Move in a Channel 🇬🇧🇳🇿
I see a horizontal parallel channel on GBPNZD on a daily.
The price is currently testing its support.
On an hourly time frame, a cup & handle pattern was formed on that.
Its neckline was violated with the today's high impact news.
I think that the price may bounce at least to 2.246 level.
❤️Please, support my work with like, thank you!❤️
I am part of Trade Nation's Influencer program and receive a monthly fee for using their TradingView charts in my analysis.

SILVER: Bulls Are Winning! Long!
My dear friends,
Today we will analyse SILVER together☺️
The market is at an inflection zone and price has now reached an area around 39.025 where previous reversals or breakouts have occurred.And a price reaction that we are seeing on multiple timeframes here could signal the next move up so we can enter on confirmation, and target the next key level of 39.148.Stop-loss is recommended beyond the inflection zone.
❤️Sending you lots of Love and Hugs❤️

EURUSD: Next Move Is Down! Short!
My dear friends,
Today we will analyse EURUSD together☺️
The price is near a wide key level
and the pair is approaching a significant decision level of 1.17658 Therefore, a strong bearish reaction here could determine the next move down.We will watch for a confirmation candle, and then target the next key level of 1.17506..Recommend Stop-loss is beyond the current level.
❤️Sending you lots of Love and Hugs❤️

GOLD: Target Is Down! Short!
My dear friends,
Today we will analyse GOLD together☺️
The recent price action suggests a shift in mid-term momentum. A break below the current local range around 3,359.59 will confirm the new direction downwards with the target being the next key level of 3,350.22.and a reconvened placement of a stop-loss beyond the range.
❤️Sending you lots of Love and Hugs❤️

Trading balanceTrading balance The price of the asset has rebounded from the balance zone. With the prospect of growth into the resistance zone.

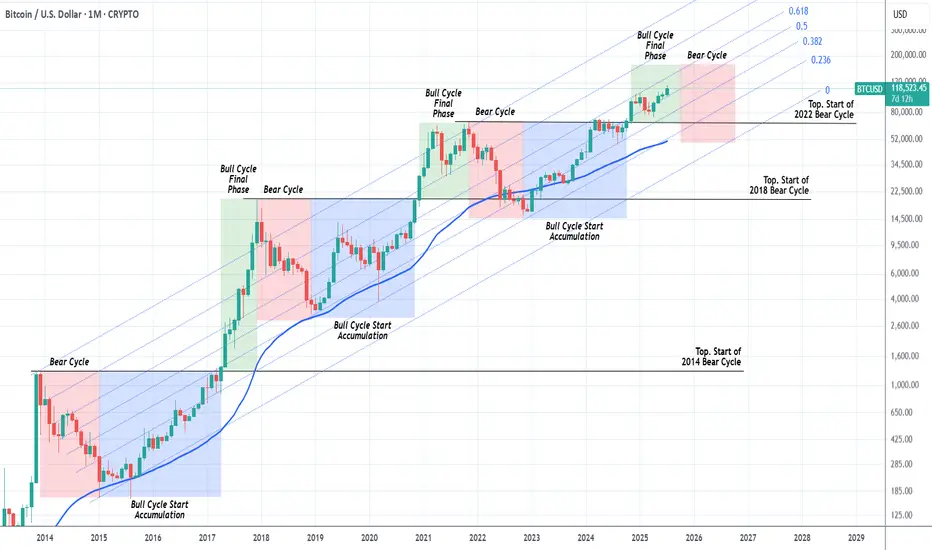
BITCOIN Should we start thinking about the next Bear Cycle yet?Bitcoin (BTCUSD) has had extremely symmetric (time-wise) Cycles in the past +10 years and this is a subject we've analyzed extensively many times. We've spent the last months projecting potential Targets for each stage of the bull run and only the last few are left.
This is exactly why we thought today's chart would be very fitting. The current Bull Cycle isn't over yet but also, based on the 4-year Cycle Theory, isn't far of either. By October 2025, that model suggests that all profit should have been taken.
As you can see, we are in the green zone, the Bull Cycle's Final Phase and since this Cycle has been trading entirely within the 0.236 - 0.618 Fibonacci Channel range, by October the price shouldn't be much higher than $160k.
In any event, this is a good guide, presented to you in a good time, to keep your mindset inside a long-term perspective and prepare you for not only the upcoming Top but also the next (1 year) Bear Cycle, which could again push the price below the 1M MA50 (blue trend-line), which would be a solid level for long-term buy positions again.
So do you think the Top is closer than it looks? Feel free to let us know in the comments section below!
-------------------------------------------------------------------------------
** Please LIKE 👍, FOLLOW ✅, SHARE 🙌 and COMMENT ✍ if you enjoy this idea! Also share your ideas and charts in the comments section below! This is best way to keep it relevant, support us, keep the content here free and allow the idea to reach as many people as possible. **
-------------------------------------------------------------------------------
💸💸💸💸💸💸
👇 👇 👇 👇 👇 👇
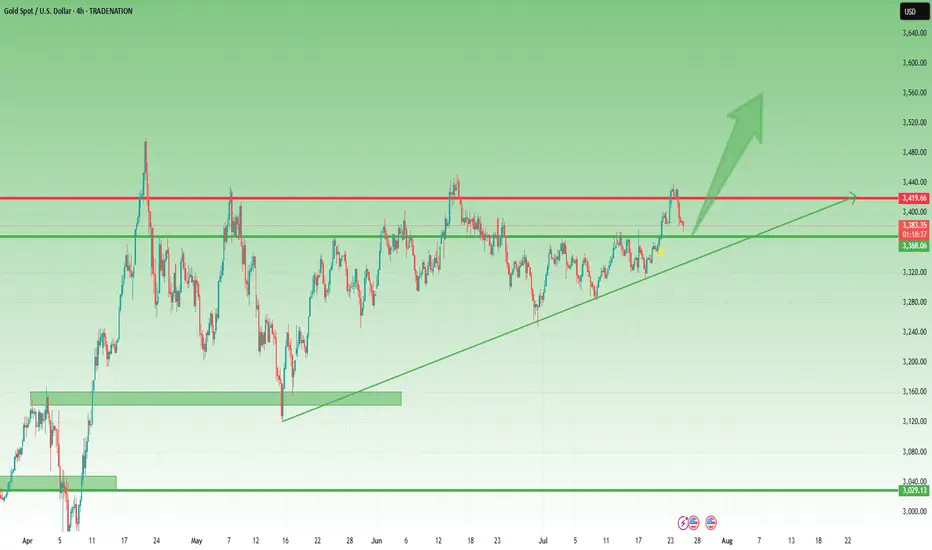
Gold Correction Went Deeper, but the Bullish Structure Intact📌 Quick recap from yesterday:
In my previous analysis, I mentioned that I was looking to buy dips around 3400, expecting a continuation move toward the ATH near 3500.
That was the plan.
But as the day unfolded, I removed my pending buy order — and explained exactly why in an educational post on how context can override entry levels.
If you read that, you already understand:
It’s not where price goes. It’s how it gets there.
________________________________________
📉 So… where are we now?
The big question is:
Was this just a deeper correction, or is Gold preparing to shift direction entirely?
In my opinion, we’re still in a healthy correction, not a reversal.
Why?
• Price remains above the horizontal support — the same level that acted as resistance last week
• The market is still above the trendline from mid-May
• No breakdown, no major structure violation — just deeper retracement after a sharp impulsive move
________________________________________
📈 What’s the plan going forward?
As long as these two supports hold, I believe the buy-the-dip narrative remains valid — even at better prices.
In fact, I already entered a new long position about an hour ago, which is currently up around 90 pips at the time of writing.
My bias stays bullish unless proven otherwise.
________________________________________
📌 Conclusion:
Yes, the correction went deeper than expected.
Yes, I removed a pending order — because the reaction was not what I wanted to see.
But structure still supports continuation, and I remain in the buy-the-dip camp as long as key support holds. 🚀
Disclosure: I am part of TradeNation's Influencer program and receive a monthly fee for using their TradingView charts in my analyses and educational articles.
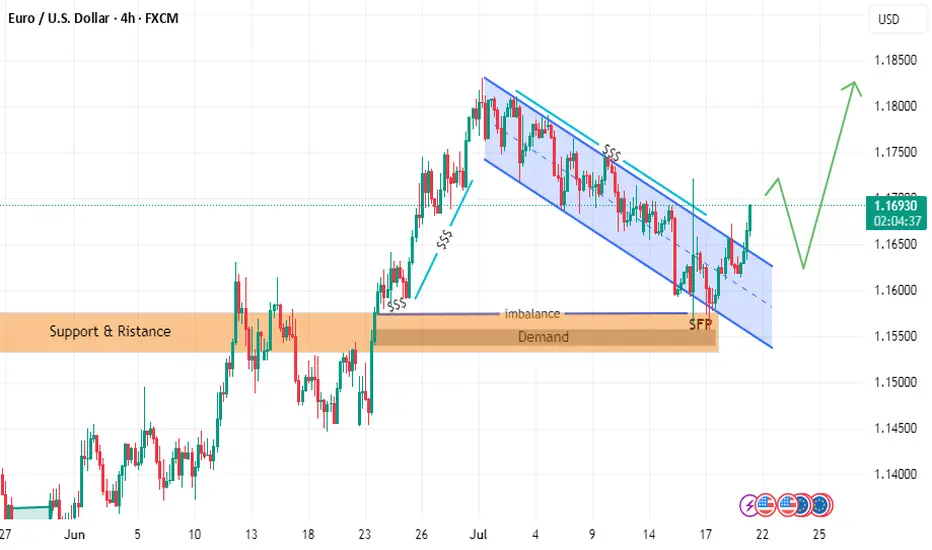
follow EURUSD LION & PLANE BUY SETUPTHE PRICE has moved as I explained in the last two posts
but we have some update to go along the way
the price could break failing channel
and withdrawal liquidity and filled imbalance
hence reflect from demand zone with zero reflection as i explained in last post with rock and plane
and it will go up to take liquidity in failing channel or downtrend
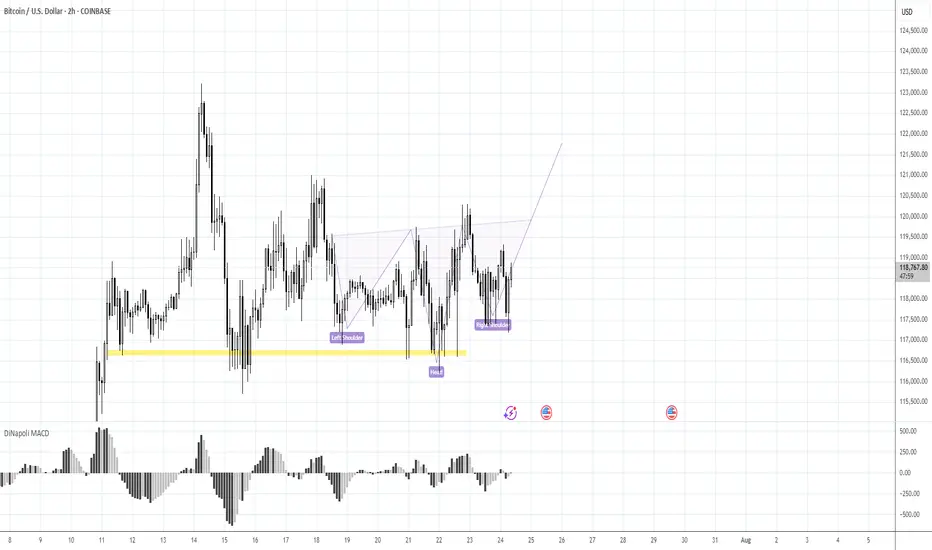
BTC Ready to Start to 125KMorning folks,
Better if you combine this update with previous idea. Now it seems that BTC stands in swamp action, flirting around 116K, which might be looking a bit bearish.
But by our view, this is not quite so. First is, triangle patterns as on daily chart as on 4H chart are look great and quite bullish. Pay attention that on 4H chart all sell-offs were bought out.
Our 1.16 lows that we set as vital ones for this scenario area still intact. So, it means that butterfly with 125K target that we discussed last time is also intact. I would say more. If you take a careful look at 1H chart - you could recognize reverse H&S pattern that could trigger all this stuff. It means that we're not in swamp, but at the point where the decision on long entry has to be made...
Take care
S.
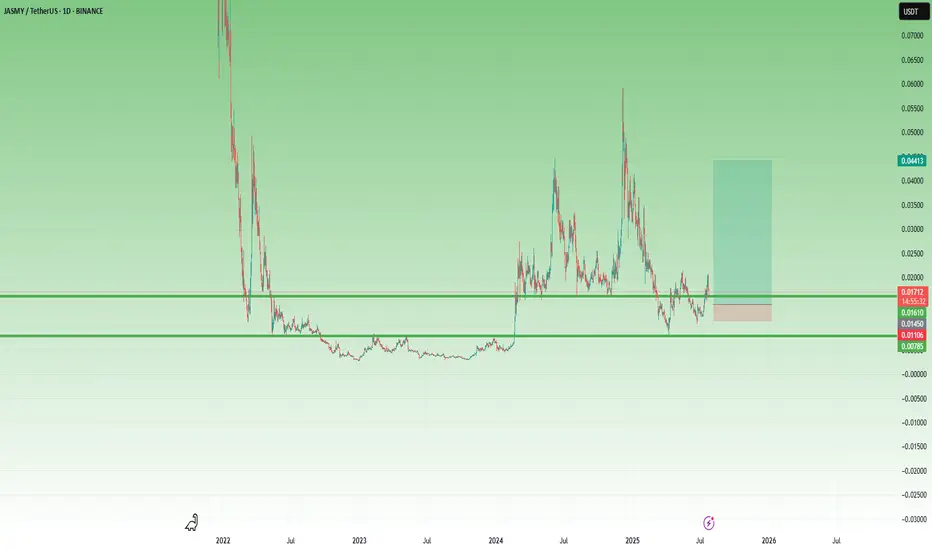
JASMY – A Volatile Setup with x3 Potential 🔸 After bottoming out at 0.003 and spending over a year in accumulation, JASMY finally broke above the key 0.008 resistance zone in February 2024. That breakout triggered a series of explosive moves – but just as violent were the drops that followed.
🔸 What stands out:
• The first post-breakout spike found a new support at 0.015.
• Then came a second vertical move toward 0.06, followed (of course) by a brutal drop.
• But… 0.008 held, and by late June, the chart printed a higher low, showing that buyers became interested.
📍 Right now, the price has reclaimed the 0.015 zone and is trying to stabilize above it. If this level holds, it could become the new base for the next wave.
💡 My plan?
This is very speculative, but I like the setup.
I’m looking to buy around 0.015–0.016, with clear negation below 0.010.
Target? Around 0.045, for a potential x3 move and a tasty 1:8 risk/reward.
⚠️ I’m not the guy who repeats the cliché “ only trade what you can afford to lose, ”
but seriously – this one is for clubbing money, not summer vacation money.
Let the volatility work in our favor. 🚀