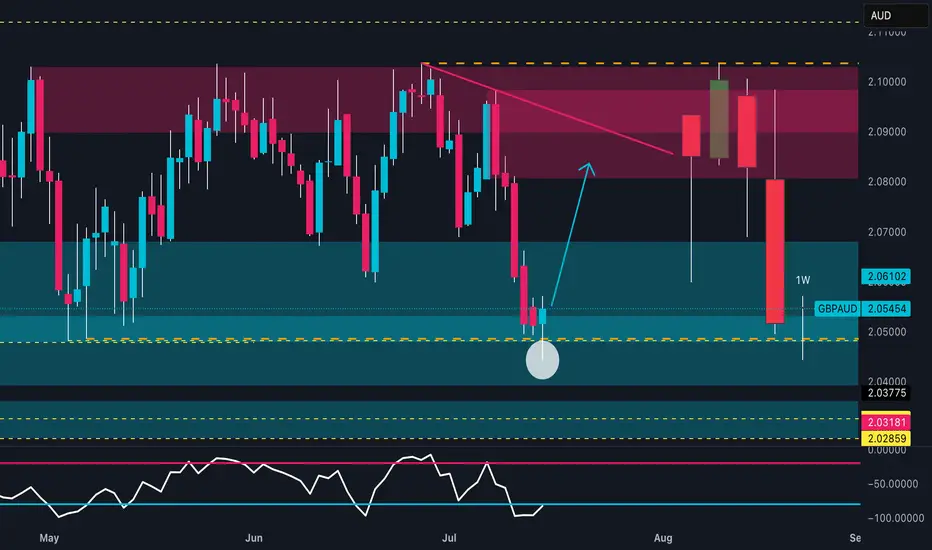
GBPAUD: Weekly Reversal | COT & Seasonality Support Bullish📊 Technical Outlook
Price strongly reacted from a key weekly demand zone between 2.0400 and 2.0500, showing clear absorption of bearish pressure. The RSI is rebounding from the 30 area, signaling early reversal potential.
The next technical target lies between 2.08900 and 2.10000, within a well-defined supply zone.
An early bullish reversal is in progress, with potential for a swing move toward the red zone.
🧠 Commitment of Traders (COT Report – 08/07/2025)
GBP: Non-commercial traders are net long, with positioning growing across the board: +869 longs / -926 shorts. Commercials reduce shorts and increase longs → Bullish bias.
AUD: Non-commercials are clearly short (-2,267 longs / +1,957 shorts). Commercials are increasing long exposure (+2,629), but still in the minority → Bearish bias.
➡️ The COT spread confirms a GBP long vs AUD short bias.
📅 Seasonality (July)
GBP: Historically strong in July, with average monthly gains across all timeframes (especially the 2Y window).
AUD: Less favorable seasonal profile in July; flat to slightly negative across all time horizons.
➡️ Seasonality supports GBP strength.
📉 Retail Sentiment
58% Long / 42% Short on GBPAUD
➡️ Retail traders are still heavily long → a shakeout of weak long hands is possible before the real rally begins.
🎯 Strategic Conclusion
GBP shows bullish convergence across technical, COT, and seasonal factors. AUD presents clear weakness.
The current price zone offers a clean entry point for longs, targeting the 2.08900–2.10000 supply zone.
Signals
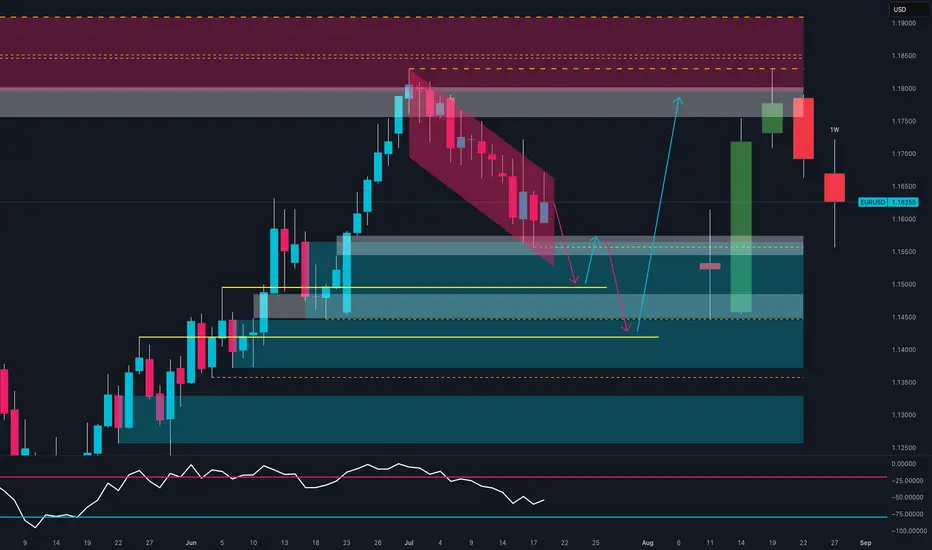
Smart Money Reloading: Will EUR/USD Explode from Demand Zone?📊 Technical Context (Daily)
EUR/USD is currently in a corrective phase following the strong June rebound from the 1.1450 area, which culminated in a high near the 1.1850 supply zone.
The recent bearish move has pushed the pair back into a key demand area between 1.1450 and 1.1550, a zone that has acted as support multiple times in the past.
The latest weekly candle shows a potential bullish exhaustion signal (long lower wick), with the RSI hovering in oversold territory.
📌 Primary scenario: Possible consolidation above 1.1550 followed by a bullish continuation toward 1.1750–1.1800.
📌 Alternative scenario: Break of the recent lows could lead to a deeper retest of the 1.1350 zone.
📈 COT (Commitment of Traders)
Non-commercial positioning shows growing bullish interest in the euro:
EUR: +971 new longs, -6,654 shorts → strong increase in net long exposure.
USD Index: -267 longs, +92 spreads → signs of institutional indecision on the dollar.
This suggests a favorable shift toward the euro by smart money.
💡 Retail Sentiment
Retail traders remain heavily short on EUR/USD (63% short) with an average entry price of 1.1579.
This reinforces the contrarian bullish case, as retail traders are trapped short in a potential reversal zone.
📆 Seasonality
Historically, July has been a bullish month for EUR/USD:
➕ 2Y average return: +0.0287
➕ 5Y average return: +0.0166
This supports a seasonal bullish bias aligning with the current technical setup.
✅ Operational Outlook
EUR/USD is trading at a technically and macroeconomically significant area. The confluence of:
Weekly demand zone being tested
RSI in oversold conditions
COT positioning favoring the euro
Retail sentiment skewed short
Bullish seasonality
…makes a bullish bounce plausible in the coming weeks, with a first target at 1.1750. Invalidation level below 1.1450.
📌 Bias: Moderately Bullish
📍 Technical Activation Zone: Above 1.1550 with confirmed bullish price action
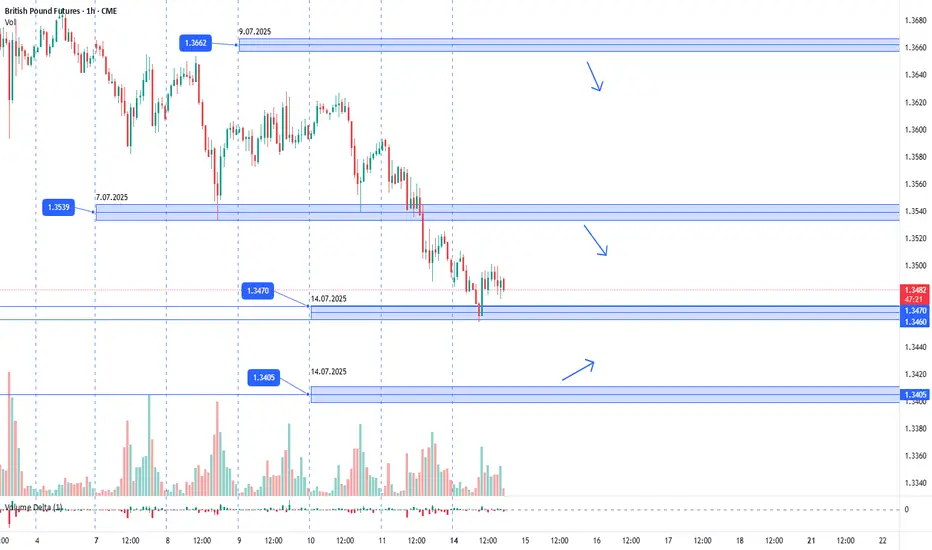
GBPUSD. 14.07.2025. The plan for the next few days.The nearest interesting resistance zone was already worked out in the morning and gave a good reaction. Let's mark the others where we can expect a reaction. It's not certain that there will be a major reversal, but I think we'll see a correction that can be monetized. We're waiting for a reaction and looking for an entry point.
The post will be adjusted based on any changes.
Don't forget to click on the Rocket! =)
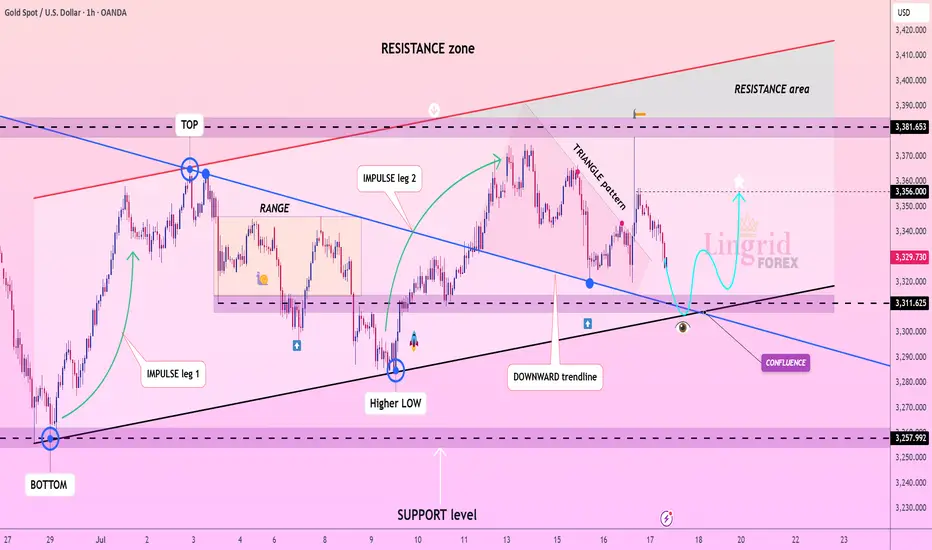
Lingrid | GOLD Continues to See Range-Bound MovementOANDA:XAUUSD is forming a bullish structure above the confluence of the downward trendline and horizontal support at 3,310. A strong impulse move followed by a triangle consolidation hints at an emerging continuation pattern, with buyers preparing for another leg higher. Price is currently approaching a key decision zone where previous support and diagonal confluence intersect, creating a launchpad scenario. If price confirms support above 3,311, a rebound toward the 3,356–3,382 zone becomes likely.
📉 Key Levels
Buy trigger: Rebound from 3,310–3,320
Buy zone: 3,300–3,315
Target: 3,356 and potentially 3,380
Invalidation: Break and close below 3,250
💡 Risks
Breakdown below the support zone may trigger extended retracement
False breakout through triangle resistance without volume
Sudden volatility from macroeconomic catalysts (e.g., Fed comments or CPI data)
If this idea resonates with you or you have your own opinion, traders, hit the comments. I’m excited to read your thoughts!
ETHUSD Will Fall! Short!
Take a look at our analysis for ETHUSD.
Time Frame: 1D
Current Trend: Bearish
Sentiment: Overbought (based on 7-period RSI)
Forecast: Bearish
The market is approaching a key horizontal level 3,555.51.
Considering the today's price action, probabilities will be high to see a movement to 3,087.51.
P.S
Please, note that an oversold/overbought condition can last for a long time, and therefore being oversold/overbought doesn't mean a price rally will come soon, or at all.
Disclosure: I am part of Trade Nation's Influencer program and receive a monthly fee for using their TradingView charts in my analysis.
Like and subscribe and comment my ideas if you enjoy them!

AUDJPY Will Go Lower From Resistance! Sell!
Please, check our technical outlook for AUDJPY.
Time Frame: 1D
Current Trend: Bearish
Sentiment: Overbought (based on 7-period RSI)
Forecast: Bearish
The market is approaching a significant resistance area 96.835.
Due to the fact that we see a positive bearish reaction from the underlined area, I strongly believe that sellers will manage to push the price all the way down to 93.887 level.
P.S
The term oversold refers to a condition where an asset has traded lower in price and has the potential for a price bounce.
Overbought refers to market scenarios where the instrument is traded considerably higher than its fair value. Overvaluation is caused by market sentiments when there is positive news.
Disclosure: I am part of Trade Nation's Influencer program and receive a monthly fee for using their TradingView charts in my analysis.
Like and subscribe and comment my ideas if you enjoy them!

GBPAUD Will Go Up From Support! Long!
Here is our detailed technical review for GBPAUD.
Time Frame: 4h
Current Trend: Bullish
Sentiment: Oversold (based on 7-period RSI)
Forecast: Bullish
The market is on a crucial zone of demand 2.060.
The oversold market condition in a combination with key structure gives us a relatively strong bullish signal with goal 2.071 level.
P.S
We determine oversold/overbought condition with RSI indicator.
When it drops below 30 - the market is considered to be oversold.
When it bounces above 70 - the market is considered to be overbought.
Disclosure: I am part of Trade Nation's Influencer program and receive a monthly fee for using their TradingView charts in my analysis.
Like and subscribe and comment my ideas if you enjoy them!

GBPJPY: Get Ready to Buy 🇬🇧🇯🇵
GBPJPY is consolidating within a narrow horizontal range
on a daily time frame.
I am waiting for its bullish breakout and a daily candle close above
199.85 to confirm the next bullish wave.
A rise will be expected to 201 level then.
❤️Please, support my work with like, thank you!❤️
I am part of Trade Nation's Influencer program and receive a monthly fee for using their TradingView charts in my analysis.

CAD_JPY BULLISH BIAS|LONG|
✅CAD_JPY is trading along
The rising support
And as the pair will soon retest it
I am expecting the price to go up
To retest the supply levels
Above at 108.708
LONG🚀
✅Like and subscribe to never miss a new idea!✅
Disclosure: I am part of Trade Nation's Influencer program and receive a monthly fee for using their TradingView charts in my analysis.

EUR-AUD Strong Uptrend! Buy!
Hello, Traders!
EUR-AUD is trading along
The rising support line in a
Strong uptrend so we we are
Bullish biased and as the pair
Is going down to retest the
Support we will be expecting
A rebound and a move up
Buy!
Comment and subscribe to help us grow!
Check out other forecasts below too!
Disclosure: I am part of Trade Nation's Influencer program and receive a monthly fee for using their TradingView charts in my analysis.

EUR_NZD LONG FROM RISING SUPPORT|
✅EUR_NZD is trading in an uptrend
Along the rising support line
Which makes me bullish biased
And the pair is about to retest the rising support
Thus, a rebound and a move up is expected
With the target of retesting the level above at 1.9544
LONG🚀
✅Like and subscribe to never miss a new idea!✅
Disclosure: I am part of Trade Nation's Influencer program and receive a monthly fee for using their TradingView charts in my analysis.

USD-JPY Will Keep Growing! Buy!
Hello,Traders!
USD-JPY is trading in an
Uptrend along the rising
Support line and the pair
Already made a bullish
Rebound and is consolidating
In a local range so as we
Are bullish biased we will
Be expecting a further
Bullish move up
Buy!
Comment and subscribe to help us grow!
Check out other forecasts below too!
Disclosure: I am part of Trade Nation's Influencer program and receive a monthly fee for using their TradingView charts in my analysis.

Gold Potential UpsidesHey Traders, in today's trading session we are monitoring XAUUSD for a buying opportunity around 3,336 zone, Gold is trading in an uptrend and currently is in a correction phase in which it is approaching the trend at 3,336 support and resistance area.
Trade safe, Joe.

NZD-USD Will Go Down! Sell!
Hello,Traders!
NZD-USD already made a retest
Of the horizontal resistance
Of 0.5992 from where we
Are seeing a bearish reaction
And we will be expecting a
Further bearish move down
Sell!
Comment and subscribe to help us grow!
Check out other forecasts below too!
Disclosure: I am part of Trade Nation's Influencer program and receive a monthly fee for using their TradingView charts in my analysis.

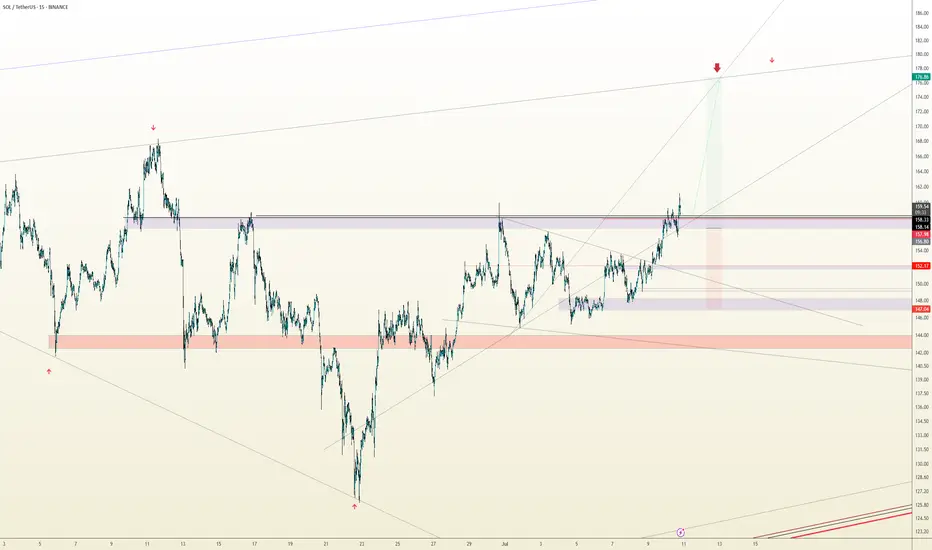
SOL/USDT Technical Outlook – Breakout Holding, Eyes on 175+Solana has successfully broken above the key resistance zone at $155–157 and is currently testing it as new support. If the level holds, this breakout could extend toward the next major target around $175–178.
📌 Key Insights:
Clean breakout followed by a potential SR flip
Watch for confirmation of support before continuation
Target aligns with previous swing high
Invalidated on breakdown below reclaimed level
🟢 Bias remains bullish as long as price holds above the breakout zone. A confirmed retest could provide a high-probability long setup.
The Critical Blue Line – Will Bitcoin Soar or Sink
🔹 Bitcoin Technical Analysis – Key Blue Line, Bear Trap Possibility & Long-Term Scenario
On the Bitcoin chart, the blue horizontal level has acted multiple times as both support and resistance. The price has broken it several times but failed to sustain above, indicating high-volume decision-making zones by institutions and large players.
📉 Why this pattern keeps repeating:
Strong supply and demand concentration at this level.
Inability to break and hold shows market indecision.
Repeated fakeouts are likely used to shake out weak hands.
🔍 Important hidden scenario: Bear Trap Potential
If the price dips below the blue line but quickly reclaims it, it may form a bear trap, tricking short sellers into entering prematurely. This move could ignite strong bullish momentum from trapped sellers and renewed buyers.
🔮 If price holds above the blue line:
Signals market strength and potential bullish structure shift.
Targets:
109,800
117,200
120,000+ (Long-term)
📛 If support fails again:
Retracement toward the lower channel near 101,000 or lower is possible.
📊 Conclusion:
This zone is one of the most critical decision points in the current market. Traders should combine volume, candlestick behavior, and confirmation signals to avoid getting trapped by fake breaks

Wings of Opportunity: LINK’s Harmonic Setup Unfolding🦋 Title: A Butterfly on the Edge – But Only with Confirmation
On the 2H timeframe, a Bullish Butterfly Harmonic Pattern is unfolding. The wave structure (X → A → B → C → D) aligns closely with harmonic principles, and point D lies above X, within the 1.27 to 1.618 Fibonacci extension of XA — reinforcing the pattern’s validity.
📌 No entry has been triggered yet.
We are currently waiting for price to break and hold above the key resistance at 13.60 to confirm the bullish scenario.
🔹 Bullish Scenario (our primary and preferred outlook):
Given the strong reaction around the 12.74 demand zone and the harmonic structure completion, we are primarily focused on a long opportunity, if and only if confirmation is achieved above 13.60.
📥 Entry Zone: 13.05 – 13.65
🎯 Target 1: 17.94
🎯 Target 2: 18.76
🛑 Stop-Loss: Below 12.74 (structural invalidation)
🔻 Alternative Bearish Scenario:
If price fails to break 13.60 and instead loses the 12.74 support, the bullish setup becomes invalid, and the market could enter a deeper correction phase.
Potential downside targets in that case:
📉 11.80
📉 10.90 – 10.30 (if bearish momentum continues)
📊 Risk Management Notes:
Position sizing should not exceed 1% of total capital
Avoid early entries before confirmation
Prefer partial entries after breakout and retest
Stick to the invalidation level strictly
📈 While both scenarios are on the table, we are currently favoring the bullish setup, as long as price action supports it. Discipline and patience are key — confirmation first, trade second.

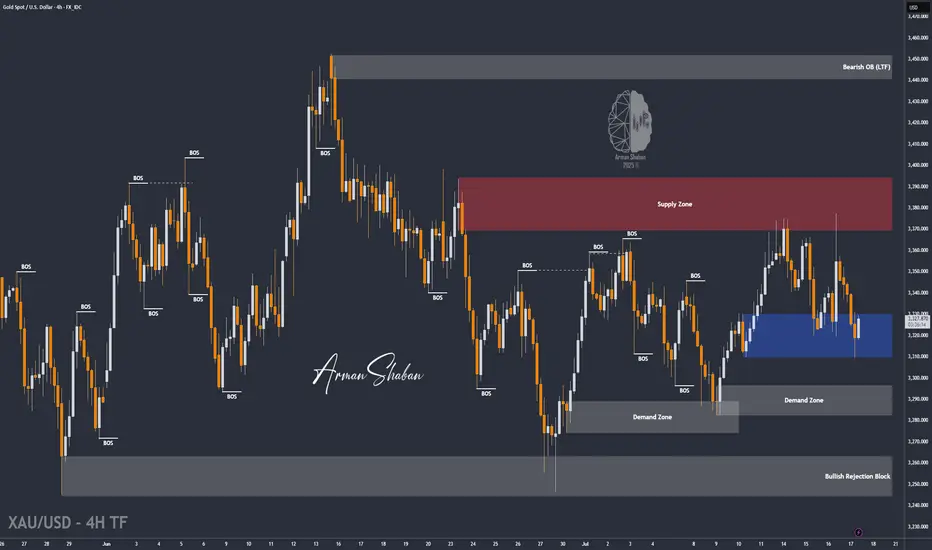
XAU/USD | First LONG to $3345, Then a Potential DROP Below $3300By analyzing the gold chart on the 4-hour timeframe, we can see that last night the price first tapped into the $3340 level, showing an initial push up to $3352. However, the drop intensified soon after, breaking the $3340 resistance and, according to the second scenario, falling to $3310. Upon reaching this key demand level, buying pressure kicked in, pushing the price back up to $3325. Now, the key question is whether gold can hold the $3310 support. If this level holds, we can expect a rise toward $3331 as the first target and $3345 as the second. After this move, a rejection from the $3345 area could trigger another drop, possibly pushing gold below $3300. So, first LONG, then SHORT!
THE LATEST VIDEO ANALYSIS :
Please support me with your likes and comments to motivate me to share more analysis with you and share your opinion about the possible trend of this chart with me !
Best Regards , Arman Shaban
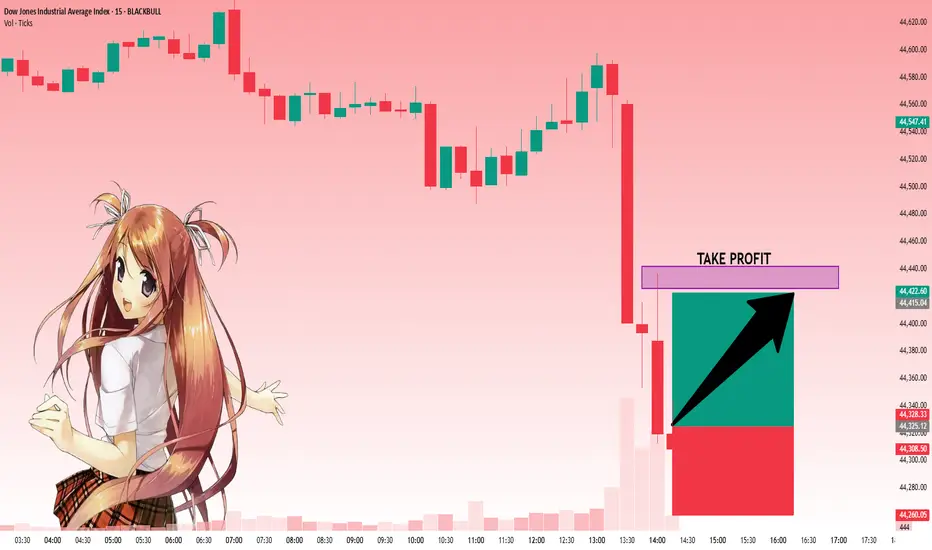
US30: Move Up Expected! Long!
My dear friends,
Today we will analyse US30 together☺️
The price is near a wide key level
and the pair is approaching a significant decision level of 44,325.14 Therefore, a strong bullish reaction here could determine the next move up.We will watch for a confirmation candle, and then target the next key level of 44,425.56.Recommend Stop-loss is beyond the current level.
❤️Sending you lots of Love and Hugs❤️
GOLD: Local Bearish Bias! Short!
My dear friends,
Today we will analyse GOLD together☺️
The recent price action suggests a shift in mid-term momentum. A break below the current local range around 3,358.13 will confirm the new direction downwards with the target being the next key level of 3,349.76.and a reconvened placement of a stop-loss beyond the range.
❤️Sending you lots of Love and Hugs❤️

SILVER: Strong Bullish Sentiment! Long!
My dear friends,
Today we will analyse SILVER together☺️
The in-trend continuation seems likely as the current long-term trend appears to be strong, and price is holding above a key level of 38.281 So a bullish continuation seems plausible, targeting the next high. We should enter on confirmation, and place a stop-loss beyond the recent swing level.
❤️Sending you lots of Love and Hugs❤️

EURUSD: Bears Are Winning! Short!
My dear friends,
Today we will analyse EURUSD together☺️
The market is at an inflection zone and price has now reached an area around 1.16557 where previous reversals or breakouts have occurred.And a price reaction that we are seeing on multiple timeframes here could signal the next move down so we can enter on confirmation, and target the next key level of 1.16419..Stop-loss is recommended beyond the inflection zone.
❤️Sending you lots of Love and Hugs❤️

Gold- Still needs to resolve the range🔸 Still Rangebound, But Not for Long
In yesterday’s analysis, I mentioned that two scenarios are in play for Gold:
1. Bullish above 3375
2. Bearish under 3320
Throughout the session, price action leaned toward the bearish side, and I aligned with that by opening a short position. It ended with a minor loss — just 50 pips, which is negligible considering I'm looking for a potential 1,000 pip move in the bigger picture.
________________________________________
🔍 What's Next?
As the title says, Gold still needs to resolve the current range before a clear directional move unfolds.
The same key levels discussed yesterday remain valid and relevant.
And since it’s Friday, today’s daily and weekly candle close will be critical in shaping expectations for next week.
________________________________________
📈 Bullish Case: Close Above 3360
• A daily/weekly close around 3360 would bring strong pressure on the 3375 resistance.
• That could lead to a bullish breakout from the ascending triangle pattern.
• It would also leave behind a bullish weekly pin bar (last week was a bullish pin bar too).
• This scenario would bring 3450 into focus — with 3500 and even a new ATH on the table in the coming weeks.
________________________________________
📉 Bearish Case: Close Near 3300
• A close near 3300 would signal a failed rally attempt
• That would expose 3250 support short term, and 3150 medium term.
________________________________________
🧭 Final Thoughts
At the moment, I’m flat and waiting for clearer confirmation later in the day.
The next move big will be defined by the weekly close — it’s as simple as that.
P.S.: It’s just a hunch , but I’m still leaning toward a break under 3300 as the next major move.
Disclosure: I am part of TradeNation's Influencer program and receive a monthly fee for using their TradingView charts in my analyses and educational articles.
