GOLD LONG FROM RISING SUPPORT|
✅GOLD is trading in an uptrend
Which makes me bullish biased
And the price is retesting the rising support
Thus, a rebound and a move up is expected
With the target of retesting the level above at 3,350$
LONG🚀
✅Like and subscribe to never miss a new idea!✅
Disclosure: I am part of Trade Nation's Influencer program and receive a monthly fee for using their TradingView charts in my analysis.
Signals

Arbitrage Opportunity!I believe I’ve identified an arbitrage opportunity involving the DEFI cryptocurrency: it trades at $0.003200 on Bybit, compared to only $0.002390 on MEXC.
I recall encountering a similar situation with Shiba Inu, when the price gap between Binance and Coinbase was as high as 8X. Feel free to play the chart below to see the outcome:
I also remember the 2016–2017 period, when such arbitrage opportunities existed even with Bitcoin, due to price discrepancies between Asian exchanges and those available to European traders.

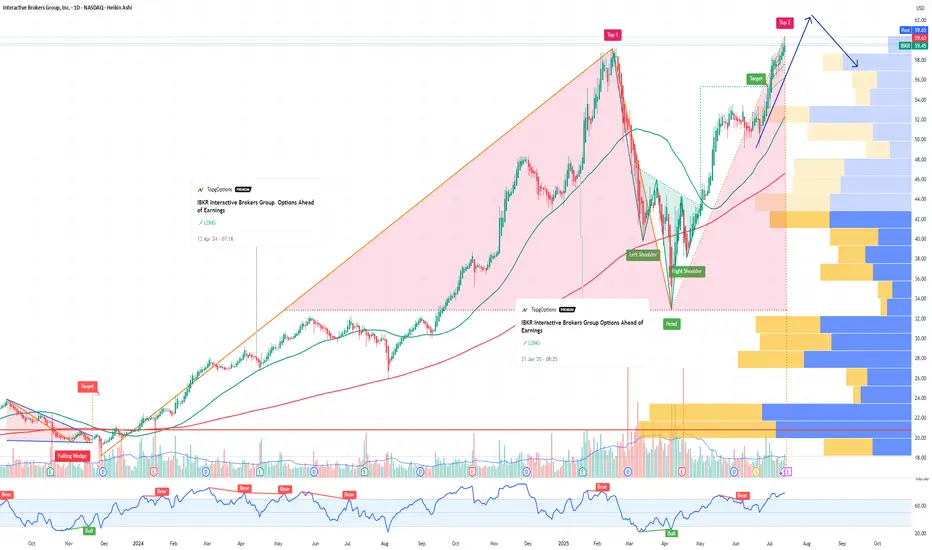
IBKR Interactive Brokers Group Options Ahead of EarningsIf you haven`t bought IBKR before the rally:
Now analyzing the options chain and the chart patterns of IBKR Interactive Brokers prior to the earnings report this week,
I would consider purchasing the 60usd strike price Calls with
an expiration date of 2025-9-19,
for a premium of approximately $3.90.
If these options prove to be profitable prior to the earnings release, I would sell at least half of them.
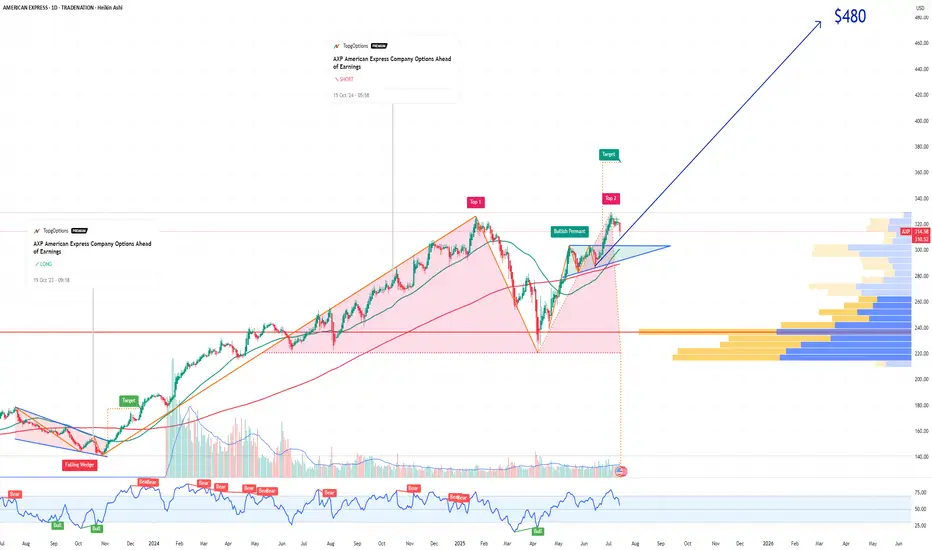
AXP American Express Company Options Ahead of EarningsIf you haven`t bought AXP before the rally:
Now analyzing the options chain and the chart patterns of AXP American Express Company prior to the earnings report this week,
I would consider purchasing the 480usd strike price Calls with
an expiration date of 2027-1-15,
for a premium of approximately $6.25.
If these options prove to be profitable prior to the earnings release, I would sell at least half of them.
Disclosure: I am part of Trade Nation's Influencer program and receive a monthly fee for using their TradingView charts in my analysis.
ETHEREUM WILL KEEP GROWING|LONG|
✅ETHEREUM is going up
Now and the coin made a bullish
Breakout of the key horizontal
Level of 3000$ and the breakout
Is confirmed so we are bullish
Biased and we will be expecting
A further bullish move up
LONG🚀
✅Like and subscribe to never miss a new idea!✅
Disclosure: I am part of Trade Nation's Influencer program and receive a monthly fee for using their TradingView charts in my analysis.

SILVER Support Ahead! Buy!
Hello,Traders!
SILVER is going down now
But the price is trading in a
Long-term uptrend so we are
Bullish biased and after the
Price retests of the horizontal
Support support below
Around 37.20$ we will be
Expecting a bullish rebound
Buy!
Comment and subscribe to help us grow!
Check out other forecasts below too!
Disclosure: I am part of Trade Nation's Influencer program and receive a monthly fee for using their TradingView charts in my analysis.

EUR_USD BEARISH BREAKOUT|SHORT|
✅EUR_USD was trading along
The rising support line but
Now we are seeing a strong bearish
Breakout and the breakout is
Confirmed so we are bearish
Biased and we will be expecting
A further bearish move down
After the potential pullback
SHORT🔥
✅Like and subscribe to never miss a new idea!✅
Disclosure: I am part of Trade Nation's Influencer program and receive a monthly fee for using their TradingView charts in my analysis.

CAD-JPY Strong Bullish Breakout! Buy!
Hello,Traders!
CAD-JPY keeps trading in a
Strong uptrend and the pair
Made a strong bullish breakout
Of the key horizontal level
Of 108.299 so we are bullish
Biased and we will be expecting
A further bullish move up
Buy!
Comment and subscribe to help us grow!
Check out other forecasts below too!
Disclosure: I am part of Trade Nation's Influencer program and receive a monthly fee for using their TradingView charts in my analysis.

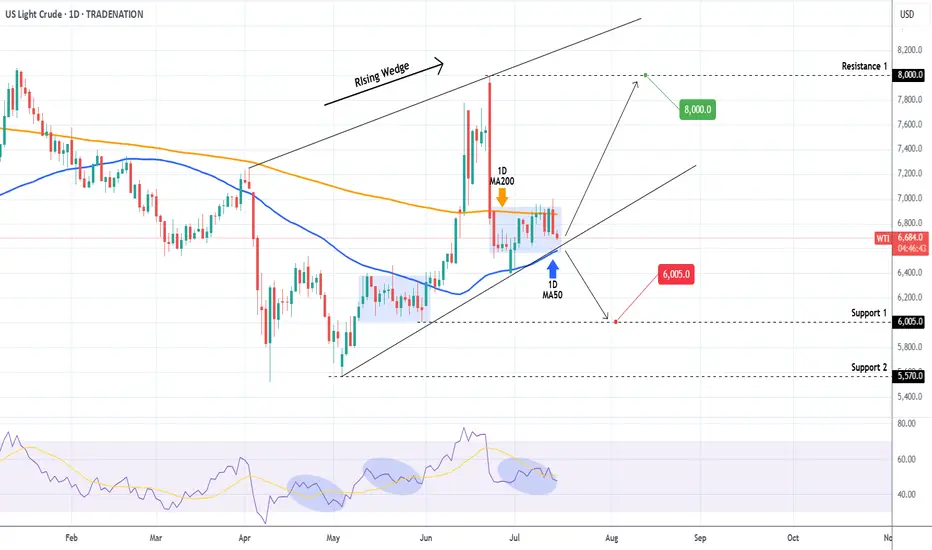
WTI OIL Is it forming a bottom?WTI Oil (USOIL) Has been trading within a Rising Wedge pattern and since June 02, it has turned its 1D MA50 as a Support. Technically the recent 2-week consolidation within the 1D MA50 (blue trend-line) and 1D MA200 (orange trend-line) is a bottom formation on the Higher Lows trend-line of the Rising Wedge.
As long as the 1D MA50 holds, we remain bullish, targeting $80.00 (Resistance 1). If the 1D MA50 breaks (closes a 1D candle below it), we will take the loss, and turn bearish instead, targeting $60.05 (Support 1).
-------------------------------------------------------------------------------
** Please LIKE 👍, FOLLOW ✅, SHARE 🙌 and COMMENT ✍ if you enjoy this idea! Also share your ideas and charts in the comments section below! This is best way to keep it relevant, support us, keep the content here free and allow the idea to reach as many people as possible. **
-------------------------------------------------------------------------------
Disclosure: I am part of Trade Nation's Influencer program and receive a monthly fee for using their TradingView charts in my analysis.
💸💸💸💸💸💸
👇 👇 👇 👇 👇 👇
S&P500 Accumulation almost over. New rally begins.The S&P500 index (SPX) has been trading within a 3-month Channel Up pattern, within which, it's been replicating almost the same structure. This involves an aggressive Bullish Leg Phase (dotted Channel Up), followed by a correction/ Accumulation Phase (blue Channels), which eventually leads to the new Bullish Leg.
The 1D RSI fractals among those patterns are similar and right now it seems that we are about to complete the latest Accumulation Phase. Having completed a 1D Golden Cross 2 weeks ago, the time-frame looks more bullish than ever and as long as the 1D MA50 (blue trend-line) holds, we expect at least a +5.68% rise (the minimum of the previous Bullish Legs), targeting 6550.
-------------------------------------------------------------------------------
** Please LIKE 👍, FOLLOW ✅, SHARE 🙌 and COMMENT ✍ if you enjoy this idea! Also share your ideas and charts in the comments section below! This is best way to keep it relevant, support us, keep the content here free and allow the idea to reach as many people as possible. **
-------------------------------------------------------------------------------
Disclosure: I am part of Trade Nation's Influencer program and receive a monthly fee for using their TradingView charts in my analysis.
💸💸💸💸💸💸
👇 👇 👇 👇 👇 👇

Lingrid | EURUSD Pulled Back to Key Support levelFX:EURUSD is approaching a major confluence zone at 1.16422 where the downward channel meets the upward trendline and horizontal support. The structure remains bullish with a sequence of higher highs and higher lows, and the current pullback fits within a healthy correction phase. A strong bounce from this triple-support region could trigger a reversal toward 1.18320, validating the continuation of the broader uptrend. All eyes are now on the 1.16450 reaction point for early momentum signs.
📉 Key Levels
Buy trigger: bullish reaction from 1.16422 support zone
Buy zone: 1.16200–1.16500 (channel base + trendline + demand)
Target: 1.18320
Invalidation: confirmed 4H close below 1.1600 breaks upward structure
💡 Risks
Deeper push below the trendline may trap early buyers
Low liquidity during the bounce can cause fakeouts
Unexpected USD strength could stall recovery momentum
If this idea resonates with you or you have your own opinion, traders, hit the comments. I’m excited to read your thoughts!

Lingrid | PEPEUSDT Corrective Channel BreakoutThe price perfectly fulfilled my previous idea . BINANCE:PEPEUSDT rebounded powerfully from the 0.00000843 support and broke out of the long-standing downward channel, marking the start of a bullish impulse leg. Price is now holding above the breakout point and consolidating above the 0.00001159 structure, setting the stage for continuation. As long as buyers defend this reclaimed level, price could attempt another leg toward the upper resistance zone at 0.00001500. Structure and volume suggest that accumulation is complete and bulls are in control.
📉 Key Levels
Buy trigger: sustained support above 0.00001159 and breakout follow-through
Buy zone: 0.00001100–0.00001159 (former resistance turned support)
Target: 0.00001500
Invalidation: breakdown below 0.00001100 risks trapping longs
💡 Risks
Volatility around breakout retests may shake weak hands
Failure to reclaim momentum at 0.00001250 could stall the push
Re-entry into the old consolidation range may delay upside momentum
If this idea resonates with you or you have your own opinion, traders, hit the comments. I’m excited to read your thoughts!

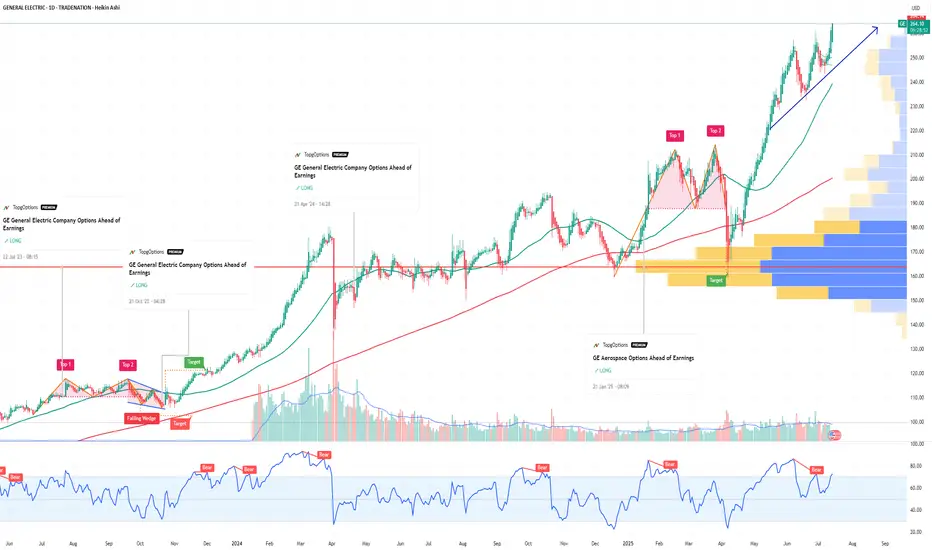
GE Aerospace Options Ahead of EarningsIf you haven`t bought GE before the rally:
Now analyzing the options chain and the chart patterns of GE Aerospace prior to the earnings report this week,
I would consider purchasing the 270usd strike price Calls with
an expiration date of 2025-8-15,
for a premium of approximately $8.60.
If these options prove to be profitable prior to the earnings release, I would sell at least half of them.
Disclosure: I am part of Trade Nation's Influencer program and receive a monthly fee for using their TradingView charts in my analysis.
BITCOIN Will it go lower?Bitcoin (BTCUSD) pulled back rather aggressively yesterday after marginally breaking above $123000 and making a new All Time High (ATH).
We've mentioned before the similarities of this Bullish Leg to the April - May structure and so far the current pull-back having already touched the 0.236 Fibonacci retracement level, resembles the late April pull-back.
However, besides the 0.236 Fib, that pull-back also hit its 4H MA50 and rebounded, so that's a condition that hasn't been fulfilled. If it does, we are potentially looking for a Low around the $115k mark. Notice also how both fractals are supported by a Higher Lows trend-line exactly on their respective 4H MA100 (green trend-line) levels.
If BTC continues to replicate this pattern, we expect to see $140000 (+43.05% from the bottom) by early August.
Will the Support levels hold and push it that high? Feel free to let us know in the comments section below!
-------------------------------------------------------------------------------
** Please LIKE 👍, FOLLOW ✅, SHARE 🙌 and COMMENT ✍ if you enjoy this idea! Also share your ideas and charts in the comments section below! This is best way to keep it relevant, support us, keep the content here free and allow the idea to reach as many people as possible. **
-------------------------------------------------------------------------------
💸💸💸💸💸💸
👇 👇 👇 👇 👇 👇

US30: Bears Are Winning! Short!
My dear friends,
Today we will analyse US30 together☺️
The price is near a wide key level
and the pair is approaching a significant decision level of 44,420.7 Therefore, a strong bearish reaction here could determine the next move down.We will watch for a confirmation candle, and then target the next key level of 44,379.6..Recommend Stop-loss is beyond the current level.
❤️Sending you lots of Love and Hugs❤️

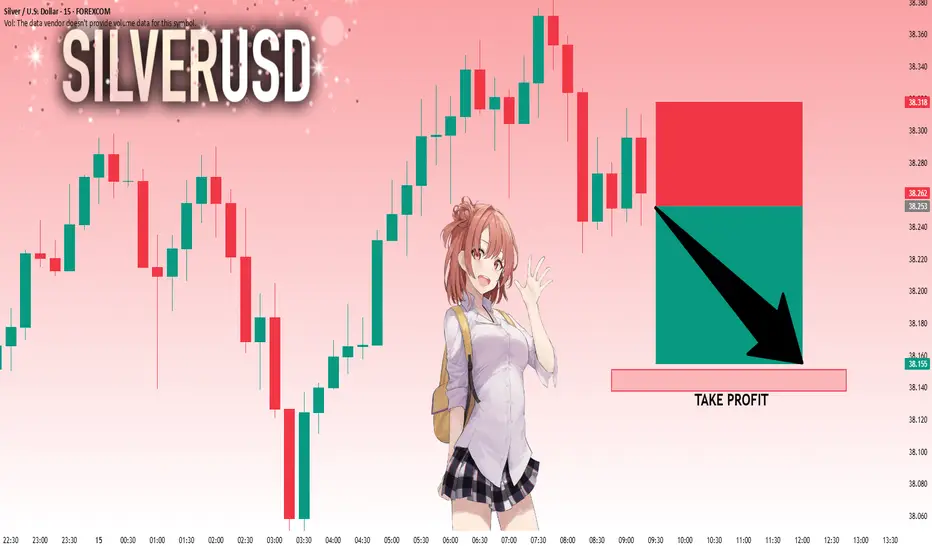
SILVER: Next Move Is Down! Short!
My dear friends,
Today we will analyse SILVER together☺️
The recent price action suggests a shift in mid-term momentum. A break above the current local range around 38.253 will confirm the new direction upwards with the target being the next key level of 38.151 and a reconvened placement of a stop-loss beyond the range.
❤️Sending you lots of Love and Hugs❤️
NAS100 Is Very Bullish! Long!
Take a look at our analysis for NAS100.
Time Frame: 12h
Current Trend: Bullish
Sentiment: Oversold (based on 7-period RSI)
Forecast: Bullish
The market is on a crucial zone of demand 23,006.9.
The oversold market condition in a combination with key structure gives us a relatively strong bullish signal with goal 23,667.5 level.
P.S
Overbought describes a period of time where there has been a significant and consistent upward move in price over a period of time without much pullback.
Disclosure: I am part of Trade Nation's Influencer program and receive a monthly fee for using their TradingView charts in my analysis.
Like and subscribe and comment my ideas if you enjoy them!

GBPJPY Will Grow! Buy!
Here is our detailed technical review for GBPJPY.
Time Frame: 1D
Current Trend: Bullish
Sentiment: Oversold (based on 7-period RSI)
Forecast: Bullish
The market is trading around a solid horizontal structure 198.531.
The above observations make me that the market will inevitably achieve 202.938 level.
P.S
The term oversold refers to a condition where an asset has traded lower in price and has the potential for a price bounce.
Overbought refers to market scenarios where the instrument is traded considerably higher than its fair value. Overvaluation is caused by market sentiments when there is positive news.
Disclosure: I am part of Trade Nation's Influencer program and receive a monthly fee for using their TradingView charts in my analysis.
Like and subscribe and comment my ideas if you enjoy them!

AUDCHF Will Go Higher From Support! Long!
Take a look at our analysis for AUDCHF.
Time Frame: 1D
Current Trend: Bullish
Sentiment: Oversold (based on 7-period RSI)
Forecast: Bullish
The market is testing a major horizontal structure 0.522.
Taking into consideration the structure & trend analysis, I believe that the market will reach 0.533 level soon.
P.S
We determine oversold/overbought condition with RSI indicator.
When it drops below 30 - the market is considered to be oversold.
When it bounces above 70 - the market is considered to be overbought.
Disclosure: I am part of Trade Nation's Influencer program and receive a monthly fee for using their TradingView charts in my analysis.
Like and subscribe and comment my ideas if you enjoy them!

GOLD: Target Is Up! Long!
My dear friends,
Today we will analyse GOLD together☺️
The in-trend continuation seems likely as the current long-term trend appears to be strong, and price is holding above a key level of 3,363.43 So a bullish continuation seems plausible, targeting the next high. We should enter on confirmation, and place a stop-loss beyond the recent swing level.
❤️Sending you lots of Love and Hugs❤️

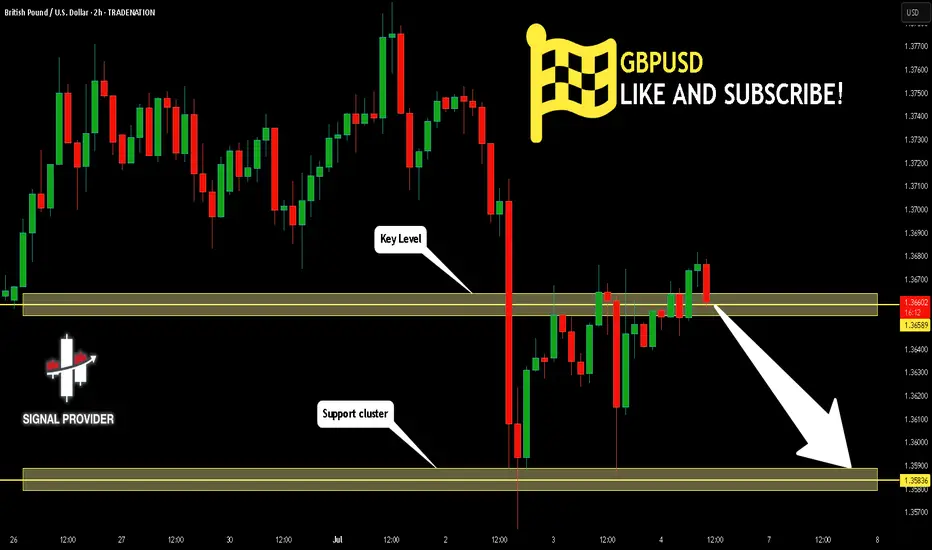
GBPUSD Will Go Lower! Sell!
Take a look at our analysis for GBPUSD.
Time Frame: 2h
Current Trend: Bearish
Sentiment: Overbought (based on 7-period RSI)
Forecast: Bearish
The market is testing a major horizontal structure 1.365.
Taking into consideration the structure & trend analysis, I believe that the market will reach 1.358 level soon.
P.S
Overbought describes a period of time where there has been a significant and consistent upward move in price over a period of time without much pullback.
Disclosure: I am part of Trade Nation's Influencer program and receive a monthly fee for using their TradingView charts in my analysis.
Like and subscribe and comment my ideas if you enjoy them!
EURUSD: Move Up Expected! Long!
My dear friends,
Today we will analyse EURUSD together☺️
The market is at an inflection zone and price has now reached an area around 1.16869 where previous reversals or breakouts have occurred.And a price reaction that we are seeing on multiple timeframes here could signal the next move up so we can enter on confirmation, and target the next key level of 1.16975.Stop-loss is recommended beyond the inflection zone.
❤️Sending you lots of Love and Hugs❤️

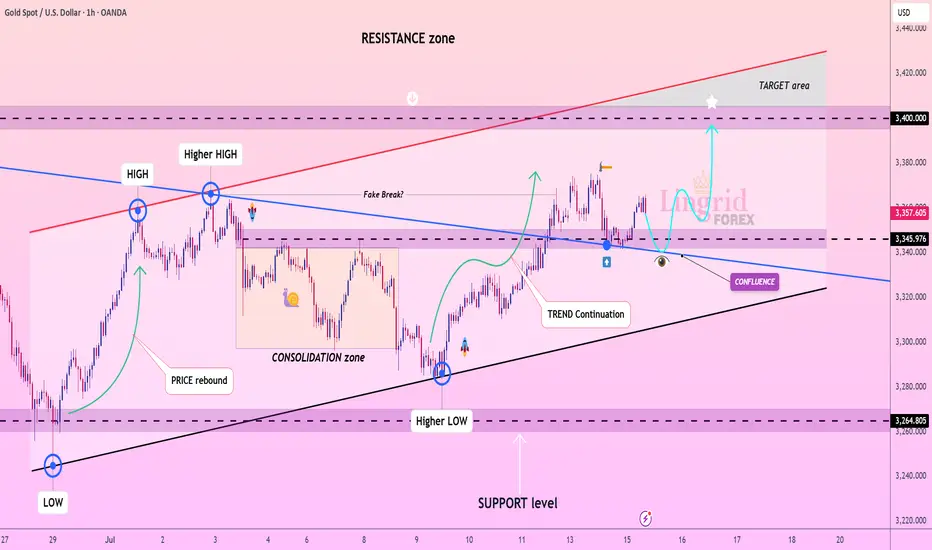
Lingrid | GOLD potential Bullish Move From Confluence ZoneOANDA:XAUUSD is forming a higher low above trend support, following a breakout from the consolidation zone and a bullish continuation leg. Price is currently pulling back toward the 3345–3350 region, which aligns with the previous breakout and key structure support. A successful retest of this area would provide confirmation for a renewed push toward the 3400 resistance zone. Momentum favors further upside if bulls defend the support and reclaim bullish control.
📉 Key Levels
Buy trigger: bullish bounce from 3345 with reclaim above 3360
Buy zone: 3345–3360 (trend support and previous breakout)
Target: 3400
Invalidation: drop below 3345 with sustained pressure cancels bullish thesis
💡 Risks
Weak volume on bounce could lead to range-bound price action
Global macro shifts may interfere with expected trend continuation
Another fake breakout near 3400 could trigger sharp rejection
If this idea resonates with you or you have your own opinion, traders, hit the comments. I’m excited to read your thoughts!