GBPAUD Will Move Higher! Buy!
Please, check our technical outlook for GBPAUD.
Time Frame: 1D
Current Trend: Bullish
Sentiment: Oversold (based on 7-period RSI)
Forecast: Bullish
The price is testing a key support 2.052.
Current market trend & oversold RSI makes me think that buyers will push the price. I will anticipate a bullish movement at least to 2.082 level.
P.S
We determine oversold/overbought condition with RSI indicator.
When it drops below 30 - the market is considered to be oversold.
When it bounces above 70 - the market is considered to be overbought.
Disclosure: I am part of Trade Nation's Influencer program and receive a monthly fee for using their TradingView charts in my analysis.
Like and subscribe and comment my ideas if you enjoy them!
Signals

Lingrid | BTCUSDT strong Bullish Trend Continues The price perfectly fulfilled my last idea . BINANCE:BTCUSDT CRYPTOCAP:BTC broke out of a long consolidation range and confirmed a higher low at 98,200, initiating a new impulsive rally inside the upward channel. The price is now trading well above the 116,643 breakout level and holding near the mid-range of the next resistance zone. As long as the bullish structure holds, price is expected to target the upper resistance band near 130,000 in the coming sessions. Momentum and structure remain in favor of the bulls, supported by trendline and volume strength.
📉 Key Levels
Buy trigger: breakout and sustained move above 116,643
Buy zone: 116,643–120,000 (retest of structure and upper trendline)
Target: 130,000
Invalidation: drop below 116,000 breaks upward trend bias
💡 Risks
False breakouts around resistance zone may delay continuation
Macro uncertainty or ETF-related news can shift sentiment
Failure to hold above 116,643 would expose the trend to deeper correction
If this idea resonates with you or you have your own opinion, traders, hit the comments. I’m excited to read your thoughts!

EURUSD Will Go Down From Resistance! Short!
Here is our detailed technical review for EURUSD.
Time Frame: 2h
Current Trend: Bearish
Sentiment: Overbought (based on 7-period RSI)
Forecast: Bearish
The market is trading around a solid horizontal structure 1.177.
The above observations make me that the market will inevitably achieve 1.172 level.
P.S
We determine oversold/overbought condition with RSI indicator.
When it drops below 30 - the market is considered to be oversold.
When it bounces above 70 - the market is considered to be overbought.
Disclosure: I am part of Trade Nation's Influencer program and receive a monthly fee for using their TradingView charts in my analysis.
Like and subscribe and comment my ideas if you enjoy them!

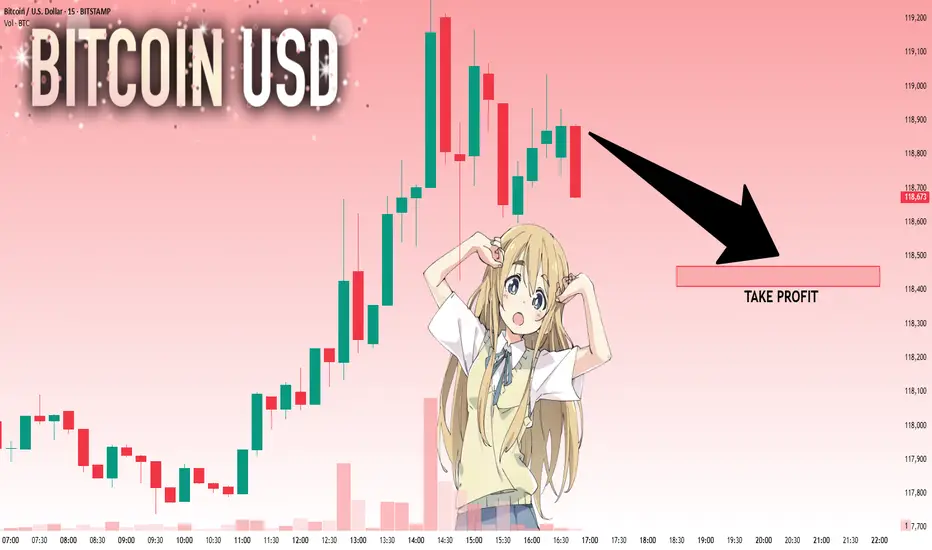
127KMorning folks,
So, BTC shows even better performance that we thought, although it obviously something stands behind, this is not market-natural motion. Anyway, we consider 127K level as all-time nearest target that stands on monthly chart.
If any pullback starts (BTC now is at daily overbought and near Yearly Resistance Pivot), we keep an eye on 117.2K and 113.5K levels to decide on long entry

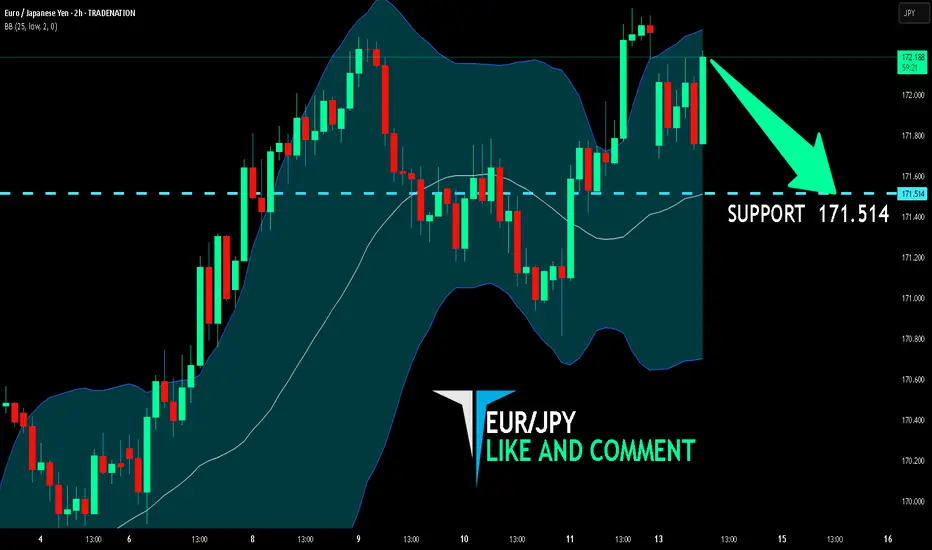
EUR/JPY BEST PLACE TO SELL FROM|SHORT
Hello, Friends!
EUR/JPY pair is trading in a local uptrend which we know by looking at the previous 1W candle which is green. On the 2H timeframe the pair is going up too. The pair is overbought because the price is close to the upper band of the BB indicator. So we are looking to sell the pair with the upper BB line acting as resistance. The next target is 171.514 area.
Disclosure: I am part of Trade Nation's Influencer program and receive a monthly fee for using their TradingView charts in my analysis.
✅LIKE AND COMMENT MY IDEAS✅
Silver Analysis – Strong Bulls and a Clean Setup AheadLast month, Silver printed a new multi-decade high, a major technical milestone.
Since then, price has entered a sideways consolidation, forming a rectangle — but what stands out is this:
👉 Silver bulls have absorbed every dip, even when Gold dropped.
That’s strength. And strength usually precedes breakout.
🔍 Current Situation
At the time of writing, price is trading around 37.20,
and from the current structure, it looks like nothing is standing in the way of an upside break.
We don’t predict — we prepare...
And this chart looks ready.
🎯 Next Target: 40.00 USD?
A push to 40.00 looks like the next “normal” target.
But don’t forget: that’s a 3,000 pip move.
This type of move will require patience
Plan your trade.
Respect your risk.
Let the bulls work. 🚀
Disclosure: I am part of TradeNation's Influencer program and receive a monthly fee for using their TradingView charts in my analyses and educational articles.

GBP_USD RISING SUPPORT AHEAD|LONG|
✅GBP_USD is going down now
But a strong rising support level is ahead
Thus I am expecting a rebound
And a move up towards the target of 1.3600
LONG🚀
✅Like and subscribe to never miss a new idea!✅
Disclosure: I am part of Trade Nation's Influencer program and receive a monthly fee for using their TradingView charts in my analysis.

EUR-CHF Local Long! Buy!
Hello,Traders!
EUR-CHF is about to retest
The strong horizontal support
Of 0.9298 and as the pair
Is locally oversold we will be
Expecting a local bullish
Rebound and a move up
Buy!
Comment and subscribe to help us grow!
Check out other forecasts below too!
Disclosure: I am part of Trade Nation's Influencer program and receive a monthly fee for using their TradingView charts in my analysis.

ETHUSD: Bulls Are Winning! Long!
My dear friends,
Today we will analyse ETHUSD together☺️
The price is near a wide key level
and the pair is approaching a significant decision level of 2,980.5 Therefore, a strong bullish reaction here could determine the next move up.We will watch for a confirmation candle, and then target the next key level of 3,001.1.Recommend Stop-loss is beyond the current level.
❤️Sending you lots of Love and Hugs❤️

GBP-AUD Risky Long! Buy!
Hello,Traders!
GBP-AUD keeps falling and
The pair is locally oversold
So as the pair is retesting
The horizontal support
Of 2.0480 we will be expecting
A local bullish correction
On Monday
Buy!
Comment and subscribe to help us grow!
Check out other forecasts below too!
Disclosure: I am part of Trade Nation's Influencer program and receive a monthly fee for using their TradingView charts in my analysis.

EUR-USD Will Keep Growing! Buy!
Hello,Traders!
EUR-USD keep trading in
An uptrend along the rising support
So as the pair is approaching
A the support we will be
Expecting a bullish rebound
And a move up on Monday
Buy!
Comment and subscribe to help us grow!
Check out other forecasts below too!
Disclosure: I am part of Trade Nation's Influencer program and receive a monthly fee for using their TradingView charts in my analysis.

BTCUSD: Next Move Is Down! Short!
My dear friends,
Today we will analyse BTCUSD together☺️
The recent price action suggests a shift in mid-term momentum. A break below the current local range around 118.878 will confirm the new direction downwards with the target being the next key level of 118.470.and a reconvened placement of a stop-loss beyond the range.
❤️Sending you lots of Love and Hugs❤️
EUR_AUD WILL GO UP|LONG|
✅EUR_AUD is trading in an uptrend
And the bullish bias is confirmed
By the rebound we are seeing
After the pair retested the support
So I think the growth will continue
LONG🚀
✅Like and subscribe to never miss a new idea!✅
Disclosure: I am part of Trade Nation's Influencer program and receive a monthly fee for using their TradingView charts in my analysis.

USOIL RISKY LONG|
✅CRUDE OIL is trading along
The rising support line
And as the price is going up now
After the retest of the line
I am expecting the price to keep growing
To retest the supply levels above at 70.20$
LONG🚀
✅Like and subscribe to never miss a new idea!✅
Disclosure: I am part of Trade Nation's Influencer program and receive a monthly fee for using their TradingView charts in my analysis.

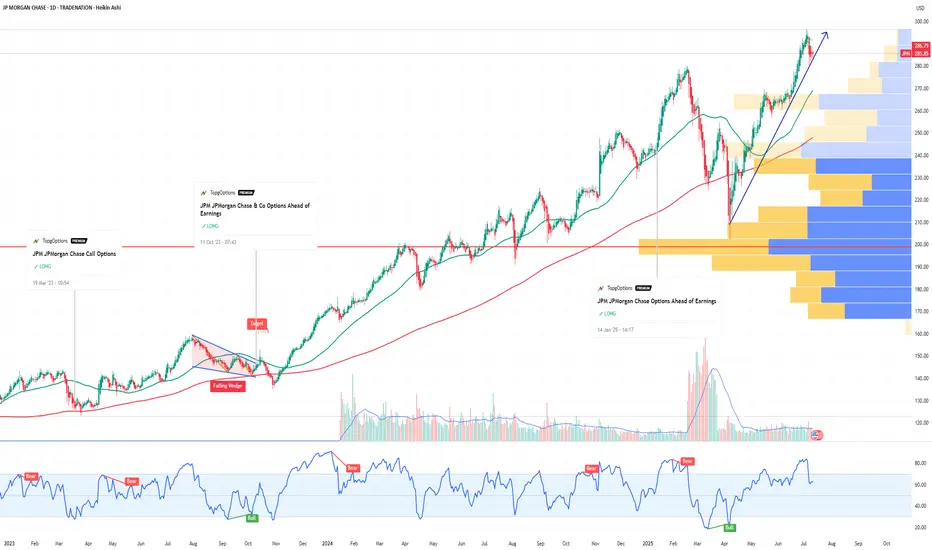
JPM JPMorgan Chase & Co Options Ahead of EarningsIf you haven`t bought JPM befor the rally:
Now analyzing the options chain and the chart patterns of JPM JPMorgan Chase & Co prior to the earnings report this week,
I would consider purchasing the 290usd strike price Calls with
an expiration date of 2026-1-16,
for a premium of approximately $20.20.
If these options prove to be profitable prior to the earnings release, I would sell at least half of them.
Disclosure: I am part of Trade Nation's Influencer program and receive a monthly fee for using their TradingView charts in my analysis.
GOLD MARKET ANALYSIS AND COMMENTARY - [Jul 14 - Jul 18]This week, OANDA:XAUUSD opened at $3,342/oz, dropped to $3,282/oz, but then rebounded sharply to close at $3,355/oz. The recovery was mainly driven by former President Trump's announcement of new tariffs ranging from 20% to 50% on imports from 22 countries, effective August 1st. Particularly, a 35% tariff on Canadian goods — a key U.S. trading partner — raised concerns about global trade stability and supply chains.
Trump also proposed 15–20% tariffs on most other trading partners, reigniting fears of global trade disruptions. At the same time, ongoing conflict between Israel and Hamas continued to weigh on sentiment, despite U.S. diplomatic efforts showing little progress.
However, analysts note that gold still lacks strong momentum for a breakout. Trump's tariff threats may be more about negotiation leverage than triggering a full-blown trade war. Meanwhile, with the labor market recovering and inflation rising, the Fed is expected to maintain its neutral monetary policy, limiting short-term gold price movements.
Although geopolitical tensions remain (e.g., Russia-Ukraine, Israel-Hamas), the ceasefire between Israel and Iran has reduced gold’s geopolitical risk premium.
Looking ahead, key U.S. economic data next week — including CPI, PPI, and retail sales — will be closely watched. A strong June core CPI (0.4% or higher) could reduce the likelihood of a Fed rate cut in September, strengthening the USD and pushing gold lower. Conversely, weaker inflation data could boost expectations of a rate cut, supporting gold prices.
📌In terms of technical analysis, gold prices next week may continue to adjust and accumulate. Accordingly, if they surpass the 3,370 USD/oz mark, gold prices next week will challenge the 3,400-3,450 USD/oz range. On the contrary, gold prices next week will adjust down to 3,285 USD/oz, or even 3,245 USD/oz.
Notable technical levels are listed below.
Support: 3,350 – 3,310 – 3,300USD
Resistance: 3,371 – 3,400 – 3,430USD
SELL XAUUSD PRICE 3435 - 3433⚡️
↠↠ Stop Loss 3439
BUY XAUUSD PRICE 3329 - 3331⚡️
↠↠ Stop Loss 3326

US500 Is Bullish! Long!
Here is our detailed technical review for US500.
Time Frame: 3h
Current Trend: Bullish
Sentiment: Oversold (based on 7-period RSI)
Forecast: Bullish
The market is trading around a solid horizontal structure 6,252.40.
The above observations make me that the market will inevitably achieve 6,297.19 level.
P.S
Overbought describes a period of time where there has been a significant and consistent upward move in price over a period of time without much pullback.
Disclosure: I am part of Trade Nation's Influencer program and receive a monthly fee for using their TradingView charts in my analysis.
Like and subscribe and comment my ideas if you enjoy them!

USDJPY Is Very Bearish! Short!
Take a look at our analysis for USDJPY.
Time Frame: 9h
Current Trend: Bearish
Sentiment: Overbought (based on 7-period RSI)
Forecast: Bearish
The market is testing a major horizontal structure 147.419.
Taking into consideration the structure & trend analysis, I believe that the market will reach 146.283 level soon.
P.S
Please, note that an oversold/overbought condition can last for a long time, and therefore being oversold/overbought doesn't mean a price rally will come soon, or at all.
Disclosure: I am part of Trade Nation's Influencer program and receive a monthly fee for using their TradingView charts in my analysis.
Like and subscribe and comment my ideas if you enjoy them!

AUD_JPY IS OVERBOUGHT|SHORT|
✅AUD_JPY is trading in a strong
Uptrend but the pair is now
Locally overbought so after the
Pair hits the horizontal resistance
Level of 97.350 we will be expecting
A pullback and a bearish correction
On Monday!
SHORT🔥
✅Like and subscribe to never miss a new idea!✅
Disclosure: I am part of Trade Nation's Influencer program and receive a monthly fee for using their TradingView charts in my analysis.

GBP-CHF Bearish Breakout! Sell!
Hello,Traders!
GBP-CHF is trading in a strong
Downtrend and the pair
Broke the key horizontal
Level around 1.0780 which
Reinforces our bearish
Bias and we will be
Expecting a further
Bearish move down
On Monday!
Sell!
Comment and subscribe to help us grow!
Check out other forecasts below too!
Disclosure: I am part of Trade Nation's Influencer program and receive a monthly fee for using their TradingView charts in my analysis.

EUR_CAD GROWTH AHEAD|LONG|
✅EUR_CAD went down to retest
A horizontal support of 1.5964
Which makes me locally bullish biased
And I think that a move up
From the level is to be expected
Towards the target above at 1.6040
LONG🚀
✅Like and subscribe to never miss a new idea!✅
Disclosure: I am part of Trade Nation's Influencer program and receive a monthly fee for using their TradingView charts in my analysis.

EUR-AUD Bullish Bias! Buy!
Hello,Traders!
EUR-AUD went down but
A strong horizontal support
Level is below around 1.7690
And as the pair is trading in
An uptrend we will be expecting
A round and a move up
On Monday!
Buy!
Comment and subscribe to help us grow!
Check out other forecasts below too!
Disclosure: I am part of Trade Nation's Influencer program and receive a monthly fee for using their TradingView charts in my analysis.

USOIL: Local Bearish Bias! Short!
My dear friends,
Today we will analyse USOIL together☺️
The market is at an inflection zone and price has now reached an area around 68.669 where previous reversals or breakouts have occurred.And a price reaction that we are seeing on multiple timeframes here could signal the next move down so we can enter on confirmation, and target the next key level of 67.925..Stop-loss is recommended beyond the inflection zone.
❤️Sending you lots of Love and Hugs❤️
