EUR-USD Bullish Breakout! Buy!
Hello,Traders!
EUR-USD is going up now
And the pair made a bullish
Breakout of the key horizontal
Level of 1.1593 and the breakout
Is confirmed so we are bullish
Biased and we will be
Expecting a further
Bullish move up
Buy!
Comment and subscribe to help us grow!
Check out other forecasts below too!
Disclosure: I am part of Trade Nation's Influencer program and receive a monthly fee for using their TradingView charts in my analysis.
Signals

BITCOIN Bounced on its 1D MA50. Bull Flag breaking soon?Bitcoin (BTCUSD) made a beautiful technical rebound on its 1D MA50 (blue trend-line), testing and holding it on 3 separate 1D candles. This has caused a short-term rebound so far, taking the price to the top of the Channel Down.
As we mentioned on previous analysis, if BTC breaks above that Channel, it will be technically confirmed as a Bull Flag, similar to the May 20 - June 20 pattern. Interestingly enough, that one was confirmed by a 1D MACD Bullish Cross, a formation that the MACD is about to make again. However it is not conclusive as 1 out of the last 3 such sequences was false.
In any case, if the break-out does take place, we are ahead of potentially two targets. Short-term $140000, which would be a +25.45% Bullish Leg, such as the one that led to the current Flag and medium-term $148000, which is the 2.0 Fibonacci extension.
Which Target do you think we'll hit, if any? Feel free to let us know in the comments section below!
-------------------------------------------------------------------------------
** Please LIKE 👍, FOLLOW ✅, SHARE 🙌 and COMMENT ✍ if you enjoy this idea! Also share your ideas and charts in the comments section below! This is best way to keep it relevant, support us, keep the content here free and allow the idea to reach as many people as possible. **
-------------------------------------------------------------------------------
💸💸💸💸💸💸
👇 👇 👇 👇 👇 👇

DAX: Next Move Is Up! Long!
My dear friends,
Today we will analyse DAX together☺️
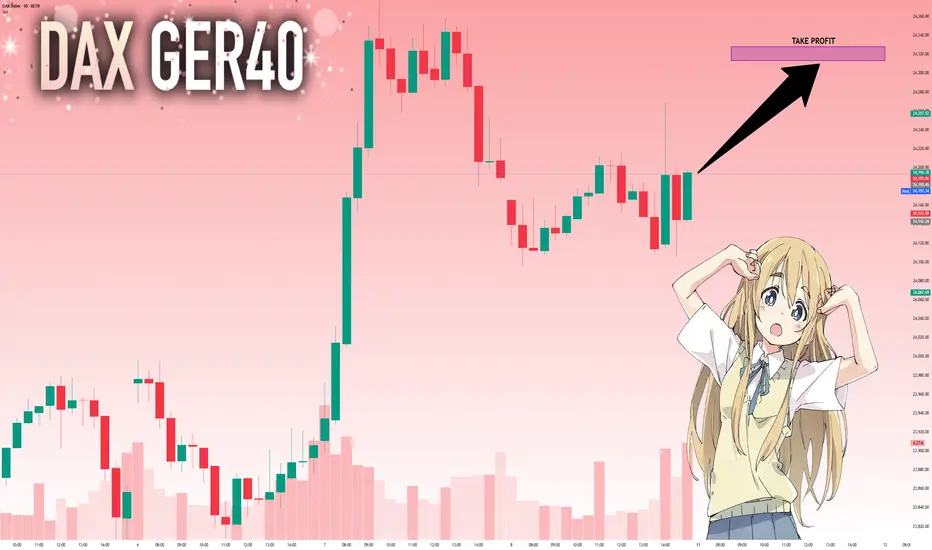
The in-trend continuation seems likely as the current long-term trend appears to be strong, and price is holding above a key level of 24,194.78 So a bullish continuation seems plausible, targeting the next high. We should enter on confirmation, and place a stop-loss beyond the recent swing level.
❤️Sending you lots of Love and Hugs❤️
SILVER: Target Is Up! Long!
My dear friends,
Today we will analyse SILVER together☺️
The market is at an inflection zone and price has now reached an area around 38.330 where previous reversals or breakouts have occurred.And a price reaction that we are seeing on multiple timeframes here could signal the next move up so we can enter on confirmation, and target the next key level of 38.432.Stop-loss is recommended beyond the inflection zone.
❤️Sending you lots of Love and Hugs❤️

DAX WILL GO UP|LONG|
✅DAX is going up now
And the index made a
Breakout of the key horizontal
Level of 24,100 which is
Now a support then
Made a retest and a is now
Making a rebound already so
We are bullish biased and we
Will be expecting a further
Bullish move up
LONG🚀
✅Like and subscribe to never miss a new idea!✅

GOLD: Move Down Expected! Short!
My dear friends,
Today we will analyse GOLD together☺️
The price is near a wide key level
and the pair is approaching a significant decision level of 3,392.87 Therefore, a strong bearish reaction here could determine the next move down.We will watch for a confirmation candle, and then target the next key level of 3,383.49.Recommend Stop-loss is beyond the current level.
❤️Sending you lots of Love and Hugs❤️

EURUSD: Local Bearish Bias! Short!
My dear friends,
Today we will analyse EURUSD together☺️
The recent price action suggests a shift in mid-term momentum. A break below the current local range around 1.16638 will confirm the new direction downwards with the target being the next key level of 1.16530 and a reconvened placement of a stop-loss beyond the range.
❤️Sending you lots of Love and Hugs❤️

USD-JPY Local Short! Sell!
Hello,Traders!
USD-JPY made a retest
Of the horizontal resistance
Of 148.101 from where we
Are already seeing a bearish
Reaction so we will be
Expecting a further
Bearish move down
Sell!
Comment and subscribe to help us grow!
Check out other forecasts below too!
Disclosure: I am part of Trade Nation's Influencer program and receive a monthly fee for using their TradingView charts in my analysis.

This V-Pattern on SPX500 Is Stupid CleanHey, it’s Skeptic.
In this video, I’m breaking down a clean V-pattern setup on SPX500 — right in line with what I taught in yesterday’s educational post.
We’re starting from the Daily time frame and walking through the logic behind my long trigger, why the previous fakeout was actually useful, and how to set your stop-loss depending on your trading style (H4 vs 15min).
This isn’t just chart talk — it’s about reading the story behind the candles.
If it helped you see things clearer, give it a boost and drop your thoughts below.
Let’s keep learning — one trap at a time.
Until next time, peace out.
📌 Disclaimer: This video is for educational purposes only and does not constitute financial advice. Always do your own research and manage your risk.

EURGBP Setup So Clear It Feels IllegalHey, it’s Skeptic.
Spotted a super clean breakout forming on EURGBP — and it lines up across multiple tools (RSI, 7SMA, momentum candles).
In this video, I’ll walk you through the daily trend, explain why I’m only looking for longs, and show the exact 15m trigger I’m watching.
No hype, no FOMO, just reason.
If it helps, boost it. Appreciate you 🫡
Disclaimer: This is not financial advice. Do your own research, manage your risk, and stay sharp out there.

EURJPY Will Go Lower From Resistance! Sell!
Here is our detailed technical review for EURJPY.
Time Frame: 2h
Current Trend: Bearish
Sentiment: Overbought (based on 7-period RSI)
Forecast: Bearish
The market is on a crucial zone of supply 172.145.
The above-mentioned technicals clearly indicate the dominance of sellers on the market. I recommend shorting the instrument, aiming at 171.318 level.
P.S
We determine oversold/overbought condition with RSI indicator.
When it drops below 30 - the market is considered to be oversold.
When it bounces above 70 - the market is considered to be overbought.
Disclosure: I am part of Trade Nation's Influencer program and receive a monthly fee for using their TradingView charts in my analysis.
Like and subscribe and comment my ideas if you enjoy them!

NZDCAD Will Go Lower! Short!
Take a look at our analysis for NZDCAD.
Time Frame: 1D
Current Trend: Bearish
Sentiment: Overbought (based on 7-period RSI)
Forecast: Bearish
The price is testing a key resistance 0.817.
Taking into consideration the current market trend & overbought RSI, chances will be high to see a bearish movement to the downside at least to 0.808 level.
P.S
Overbought describes a period of time where there has been a significant and consistent upward move in price over a period of time without much pullback.
Disclosure: I am part of Trade Nation's Influencer program and receive a monthly fee for using their TradingView charts in my analysis.
Like and subscribe and comment my ideas if you enjoy them!

Fed cuts interest rates or political tensions riseExperts from financial institutions such as Tierra, Goldman Sachs, and UBS predict that the world gold price in August will fluctuate around the threshold of 3,420 - 3,520 USD/ounce, and may exceed 3,600 USD/ounce if the FED cuts interest rates or political tensions increase.
Ms. Soni Kumari - commodity strategist at ANZ, commented: "Uncertainty is back in the spotlight, especially after new developments related to tariffs, which is reviving safe-haven demand. In addition, macro market sentiment also supports gold, especially when the USD weakens and expectations of the FED cutting interest rates increase."

GOLD: The Market Is Looking Up! Long!
My dear friends,
Today we will analyse GOLD together☺️
The price is near a wide key level
and the pair is approaching a significant decision level of 3,386.96 Therefore, a strong bullish reaction here could determine the next move up.We will watch for a confirmation candle, and then target the next key level of 3,397.99.Recommend Stop-loss is beyond the current level.
❤️Sending you lots of Love and Hugs❤️

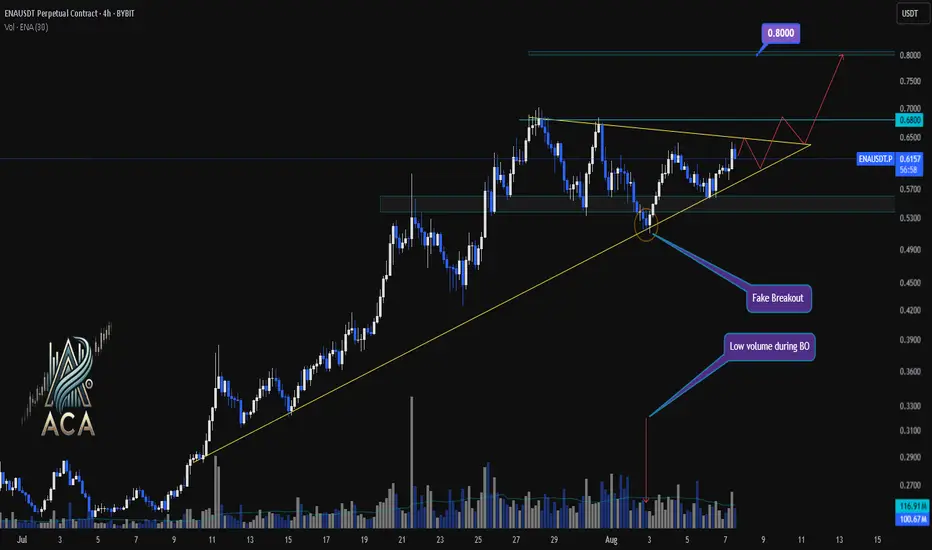
ENAUSDT 4H Chart Analysis | Bullish Breakout Setup in FocusENAUSDT 4H Chart Analysis | Bullish Breakout Setup in Focus
🔍 Let’s dive into the ENAUSDT perpetual contract and analyze the recent price action, spotlighting key technical signals and a potential breakout scenario.
⏳ 4-Hour Overview
The 4-hour chart shows ENAUSDT consolidating above a critical ascending trendline, with price action tightening into a symmetrical triangle formation. Multiple attempts to break down have resulted in a fake breakout, as indicated by low volume during the breakdown — a classic sign of seller exhaustion.
🔺 Bullish Breakout Setup:
On the upside, a confirmed breakout above the $0.6800 resistance could pave the way for a bullish continuation towards the $0.8000 target zone. The structure suggests increasing buying pressure as long as price holds above the trendline and key support ($0.6050).
📊 Key Highlights:
- Price retested the ascending trendline; buyers defended it aggressively.
- A fake breakout with low volume suggests trap for bears and quick recovery by bulls.
- The next major resistance comes at $0.6800, with a projected target at $0.8000 upon breakout.
- Short-term support sits at $0.6050. Price action above this level remains constructive.
🚨 Conclusion:
Watch for a decisive move beyond triangle resistance. A high-volume breakout above $0.6800 could trigger a sharp move toward $0.8000. Bulls are building momentum — keep an eye on volume to confirm breakout strength.
GOLD Will Go Down! Sell!
Please, check our technical outlook for GOLD.
Time Frame: 9h
Current Trend: Bearish
Sentiment: Overbought (based on 7-period RSI)
Forecast: Bearish
The market is trading around a solid horizontal structure 3,372.03.
The above observations make me that the market will inevitably achieve 3,336.24 level.
P.S
Please, note that an oversold/overbought condition can last for a long time, and therefore being oversold/overbought doesn't mean a price rally will come soon, or at all.
Disclosure: I am part of Trade Nation's Influencer program and receive a monthly fee for using their TradingView charts in my analysis.
Like and subscribe and comment my ideas if you enjoy them!

CADJPY Is Bearish! Sell!
Take a look at our analysis for CADJPY.
Time Frame: 2h
Current Trend: Bearish
Sentiment: Overbought (based on 7-period RSI)
Forecast: Bearish
The market is approaching a key horizontal level 107.345.
Considering the today's price action, probabilities will be high to see a movement to 106.396.
P.S
We determine oversold/overbought condition with RSI indicator.
When it drops below 30 - the market is considered to be oversold.
When it bounces above 70 - the market is considered to be overbought.
Disclosure: I am part of Trade Nation's Influencer program and receive a monthly fee for using their TradingView charts in my analysis.
Like and subscribe and comment my ideas if you enjoy them!

BTCUSD: Is the Downtrend About to Accelerate?Hey everyone! What do you think about BTCUSD right now?
Yesterday, XAUUSD continued its downtrend and is currently trading around 114,089 USD.
The main reason for this is the US job data showing higher-than-expected unemployment, increasing the likelihood that the Federal Reserve will cut interest rates in September. This expectation has weakened the USD, making gold and other safe-haven assets more attractive, but at the same time, BTC/USD is facing negative pressure from the price channel.
In the short term, the price continues to maintain a bearish trend. Notably, we observe a bearish crossover between the EMA 34 and 89, along with a break of the previous uptrend line—both of which reinforce the current downtrend.
If there’s a pullback before the next drop, the Fibonacci retracement levels of 0.5–0.618 (which also align with resistance levels and the EMA) will be key zones to watch. This could be the ideal level for potential trade setups.
Looking ahead, the next support target is around 110,000 USD. If this level breaks, BTC could head towards the 10X,000 USD range.
What do you think? Share your thoughts in the comments!

CADCHF SELLSI entered a sell on CADCHF that I didn’t share earlier. The reason behind the trade was that price mitigated a Daily inefficiency, which caused the 4H bullish structure to flip. After the flip, price pulled back into a well-defined 4H supply zone. I waited for confirmation on the 15-minute timeframe, and once the structure shifted there, the entry was triggered. Price has returned to the entry area, but the trade remains valid as long as the structure is intact. I'm aiming for a nice swing move if price cooperates, and I’ll definitely take partials at the first significant low.

SILVER: Target Is Up! Long!
My dear friends,
Today we will analyse SILVER together☺️
The price is near a wide key level
and the pair is approaching a significant decision level of 37.822 Therefore, a strong bullish reaction here could determine the next move up.We will watch for a confirmation candle, and then target the next key level of 37.912.Recommend Stop-loss is beyond the current level.
❤️Sending you lots of Love and Hugs❤️

EURUSD: Move Down Expected! Short!
My dear friends,
Today we will analyse EURUSD together☺️
The recent price action suggests a shift in mid-term momentum. A break above the current local range around 1.16384 will confirm the new direction upwards with the target being the next key level of 1.16133 and a reconvened placement of a stop-loss beyond the range.
❤️Sending you lots of Love and Hugs❤️

XAUUSD – Bears Gave It a Shot, But Bulls Still in Control1. Quick recap of yesterday
In yesterday’s analysis, I highlighted the possibility of a short-term correction on Gold and noted that, although risky, a short trade could be justified. Acting on that conviction, I took a short with a sniper entry, capturing over 250 pips in floating profit. However, Gold found strong support around 3350 and reversed aggressively. I closed the trade with a more modest +140 pips gain.
2. Key development: NY session reversal
Despite early signs of weakness, the New York session flipped the script, sending Gold back toward the top of the daily range. The daily close near highs tells us one thing:
➡️ The bulls aren’t done just yet.
3. Technical outlook
• Resistance remains firm at 3375–3380+ zone
• A clear breakout above this zone opens the door for 3400+, with a likely magnet at 3430
• As long as the market holds above this week’s low, dips are buyable opportunities
4. Trading plan
For now, the bias shifts back to the long side. I’m watching for intraday dips to build longs, with invalidation below this week’s low. The structure favors continuation — but only if 3380 gives way we have confirmation.
5. Final thoughts
Gold may have teased the bears, but the real power still lies with the bulls. If momentum kicks in above 3380, we could be on our way to test 3430 soon. 🏹
Disclosure: I am part of TradeNation's Influencer program and receive a monthly fee for using their TradingView charts in my analyses and educational articles.

ETHUSD Is Going Up! Buy!
Here is our detailed technical review for ETHUSD.
Time Frame: 2h
Current Trend: Bullish
Sentiment: Oversold (based on 7-period RSI)
Forecast: Bullish
The market is on a crucial zone of demand 3,601.00.
The oversold market condition in a combination with key structure gives us a relatively strong bullish signal with goal 3,751.96 level.
P.S
Please, note that an oversold/overbought condition can last for a long time, and therefore being oversold/overbought doesn't mean a price rally will come soon, or at all.
Disclosure: I am part of Trade Nation's Influencer program and receive a monthly fee for using their TradingView charts in my analysis.
Like and subscribe and comment my ideas if you enjoy them!
