EUR-NZD Risky Short! Sell!
Hello,Traders!
EUR-NZD made a retest
Of the local horizontal resistance
Of 1.9485 so despite the uptrend
We are locally bearish biased
And we will be expecting a
Local bearish correction
On Monday
Sell!
Comment and subscribe to help us grow!
Check out other forecasts below too!
Disclosure: I am part of Trade Nation's Influencer program and receive a monthly fee for using their TradingView charts in my analysis.
Signals

CAD_CHF GROWTH AHEAD|LONG|
✅CAD_CHF made a retest
Of the horizontal support
Of 0.5820 and we are already
Seeing a bullish reaction
So we will be expecting a
Further bullish move up
On Monday
LONG🚀
✅Like and subscribe to never miss a new idea!✅
Disclosure: I am part of Trade Nation's Influencer program and receive a monthly fee for using their TradingView charts in my analysis.

GOLD MARKET ANALYSIS AND COMMENTARY - [Jul 07 - Jul 11]OANDA:XAUUSD opened the week at $3,246/oz due to low summer liquidity, easing recession fears and easing geopolitical tensions. However, they later recovered to $3,365/oz due to concerns about a possible re-escalation of the trade war, as some countries faced obstacles in negotiations with the US ahead of the July 9 tariff delay deadline. By the end of the week, prices had adjusted to $3,311/oz and closed at $3,335/oz.
In addition, the US Senate has passed the OBBBA tax cut and spending bill proposed by President Donald Trump. While it helps prevent the risk of a short-term default, the bill could increase the US public debt by more than $3,000 billion over the next 10 years, putting pressure on the bond market and raising concerns about the increasing supply of government bonds while demand is weakening.
However, US economic data over the weekend put downward pressure on gold. Specifically, the June employment report showed that the number of non-farm jobs (NFP) reached 147,000, exceeding the forecast of 111,000. The unemployment rate fell to 4.1%, lower than the expected 4.3%. At the same time, NFP data for April and May were also adjusted up to 158,000 and 144,000 jobs, respectively.
These positive numbers almost erased the expectation that the FED would cut interest rates in July. The FED also reaffirmed its stance on maintaining the current policy due to rising inflationary pressures.
Overall, gold prices are still stuck in a range, and a clearer prospect of interest rate cuts from the FED is needed to make a strong breakthrough in the near future.
📌Technically, the $3,310/oz level is now acting as an important support zone for gold prices next week. If this level is broken, prices may continue to fall further to the $3,245/oz area or even lower.
On the other hand, the $3,365/oz level is a strong resistance. If gold prices break through this area, there is a high possibility that they will approach the $3,400/oz mark. However, the upward momentum may be restrained afterwards due to profit-taking pressure from investors, especially when the US-China trade negotiations are still ongoing and have not reached a final agreement. Investors tend to be cautious, waiting for clearer signals before opening new positions.
Notable technical levels are listed below.
Support: 3,300 – 3,292 – 3,250USD
Resistance: 3,350 – 3,371 – 3,400USD
SELL XAUUSD PRICE 3401 - 3399⚡️
↠↠ Stop Loss 3405
BUY XAUUSD PRICE 3294 - 3296⚡️
↠↠ Stop Loss 3290

EUR/USD – Smart Money Trap at 1.18? Massive Rejection Ahead 1. Technical Context
The pair has been moving inside a well-defined bullish channel since May, forming higher highs and higher lows. Price is currently hovering around 1.1718, approaching the upper boundary of the channel and a key weekly supply zone (1.1750–1.1850).
➡️ Potential scenario:
A short bullish extension toward 1.1780–1.1820 to trigger stop hunts, followed by a bearish rejection toward 1.1500, and potentially 1.1380.
The daily RSI is overbought (>70), suggesting a likely short-term correction.
2. Retail Sentiment
80% of retail traders are short, with an average entry around 1.1318.
This signals a liquidity cluster above current highs, increasing the likelihood of a fake bullish breakout followed by a sell-off.
➡️ Contrarian insight: Retail heavily short → market may push higher first to wipe them out before reversing lower.
3. COT Report – USD Index (DXY)
Non-commercials (speculators) increased their short exposure on USD (+3,134).
Commercials cut their short positions (-1,994), indicating a potential bottoming on the dollar.
➡️ Conclusion: USD strength could return soon → bearish pressure for EUR/USD.
4. COT Report – EUR FX
Non-commercials increased longs on EUR (+2,980) and sharply reduced shorts (-6,602) → market is now heavily net long.
Commercials remain net short (581,664 vs 417,363 longs).
➡️ Over-leveraged spec longs → vulnerable to downside squeeze if macro sentiment shifts.
5. Seasonality
June tends to be mildly bullish for EUR/USD.
July historically shows even stronger upward performance over the last 5–10 years.
➡️ Shorts are high risk in the very short term, but a bearish setup is likely in the second half of July, especially if price action confirms.
6. Trading Outlook
📍 Short-Term Bias: Neutral to bullish toward 1.1780–1.1820
📍 Mid-Term Bias: Bearish on rejection from supply area and break of channel
🎯 Key Levels:
1.1780–1.1850: critical decision zone (liquidity + weekly supply)
1.1500: first key support
1.1380: next downside target (demand zone + previous POC)
📌 Final Conclusion
The most likely play is a short setup from 1.1780–1.1850 on strong rejection, supported by:
Extreme retail positioning (80% short),
COT pointing to USD recovery,
Extended technical structure,
Overbought RSI on the daily chart.

ETHUSD: Next Move Is Down! Short!
My dear friends,
Today we will analyse ETHUSD together☺️
The in-trend continuation seems likely as the current long-term trend appears to be strong, and price is holding below a key level of 2,514.4 So a bearish continuation seems plausible, targeting the next low. We should enter on confirmation, and place a stop-loss beyond the recent swing level.
❤️Sending you lots of Love and Hugs❤️

US30 Will Move Higher! Buy!
Take a look at our analysis for US30.
Time Frame: 1h
Current Trend: Bullish
Sentiment: Oversold (based on 7-period RSI)
Forecast: Bullish
The market is testing a major horizontal structure 44,556.0.
Taking into consideration the structure & trend analysis, I believe that the market will reach 44,867.4 level soon.
P.S
Please, note that an oversold/overbought condition can last for a long time, and therefore being oversold/overbought doesn't mean a price rally will come soon, or at all.
Disclosure: I am part of Trade Nation's Influencer program and receive a monthly fee for using their TradingView charts in my analysis.
Like and subscribe and comment my ideas if you enjoy them!

EURNZD Is Bullish! Long!
Please, check our technical outlook for EURNZD.
Time Frame: 9h
Current Trend: Bullish
Sentiment: Oversold (based on 7-period RSI)
Forecast: Bullish
The market is approaching a key horizontal level 1.944.
Considering the today's price action, probabilities will be high to see a movement to 1.965.
P.S
The term oversold refers to a condition where an asset has traded lower in price and has the potential for a price bounce.
Overbought refers to market scenarios where the instrument is traded considerably higher than its fair value. Overvaluation is caused by market sentiments when there is positive news.
Disclosure: I am part of Trade Nation's Influencer program and receive a monthly fee for using their TradingView charts in my analysis.
Like and subscribe and comment my ideas if you enjoy them!

AUD-NZD Local Long! Buy!
Hello,Traders!
AUD-NZD is already making
A bullish rebound from the
Horizontal support of 1.0810
So we are locally bullish biased
And we will be expecting a
Further bullish move up
Buy!
Comment and subscribe to help us grow!
Check out other forecasts below too!
Disclosure: I am part of Trade Nation's Influencer program and receive a monthly fee for using their TradingView charts in my analysis.

An entry for a long position incoming
It looks like a good entry point for a long position.
Close the position once the price hits the SR above or the Road level
GBP_AUD BEARISH BIAS|SHORT|
✅GBP_AUD is going up to retest
A horizontal resistance of 2.0892
Which makes me locally bearish biased
And I think that we will see a pullback
And a move down from the level
Towards the target below at 2.0805
SHORT🔥
✅Like and subscribe to never miss a new idea!✅
Disclosure: I am part of Trade Nation's Influencer program and receive a monthly fee for using their TradingView charts in my analysis.

GBP/CHF Headed to 1.10 – But Bulls Might Regret It📉 1. Price Action & Technical Structure (D1)
Key demand zone tested with bullish reaction:
Price reacted strongly around the 1.0790–1.0840 structural demand area, previously the origin of a significant bullish impulse. The latest daily candle closed above the previous swing low, suggesting a potential technical rebound.
Immediate target:
The 1.0980–1.1010 zone, aligning with:
A clear supply area
RSI bouncing from oversold territory
A visible imbalance left unfilled
Technical bias: Short-term LONG to fill the imbalance before a potential institutional-driven short setup at supply.
2. Retail Sentiment
86% of traders are LONG, with an average entry of 1.0997
Only 14% are SHORT, with lower volume and better pricing
Current price: 1.0833, meaning most long traders are in drawdown
Contrarian view:
The heavy long positioning creates a liquidity pool between 1.0990–1.1010, making that zone highly attractive for institutional distribution and liquidation of retail longs, especially if accompanied by a structural shift.
🎯 Operational impact:
Supports a technical long to 1.10, but high risk of reversal once that level is reached.
3. COT Report
GBP (British Pound – CME)
Non-commercials:
Long: -6,434 → massive unwind of bullish exposure
Short: +2,028 → rising bearish bets
Net positioning is increasingly bearish
Commercials:
Long: +7,459 → increasing coverage against GBP weakness
Short: -569 → slight reduction
Positioning is mixed, but commercials are taking defensive long positions
GBP interpretation:
Bearish pressure rising from institutional speculators, despite some commercial support.
CHF (Swiss Franc – CME)
Non-commercials:
Long: +327
Short: +1,215
Net positioning still heavily short, but shorts increasing again
Commercials:
Long: +1,909
Short: +307
Commercials are accumulating long CHF positions (bullish sign)
CHF interpretation:
Divergence between commercials (bullish CHF) and speculators (still short) → shift may be underway.
4. July Seasonality
GBP:
Historically strong in July, especially the last 2 years (+3.5%)
Positive tendency across 10y/15y/20y averages
CHF:
Also seasonally positive in July, but underperforms GBP across most timeframes (except 2Y where CHF is also strong)
Operational impact:
Favors short-term bullish GBP/CHF bias, supported by seasonal momentum.
✅ Final Outlook
Current short-term bias is bullish, driven by:
Clear technical rebound
Visible imbalance toward 1.10
Seasonal divergence in favor of GBP
However, excessive retail long positioning + COT speculative pressure on GBP suggest this rally could be a distribution phase, offering an optimal short opportunity at 1.10.

EUR_AUD LOCAL CORRECTION|SHORT|
✅EUR_AUD is set to retest a
Strong resistance level above at 1.8020
After trading in a local uptrend for some time
Which makes a bearish pullback a likely scenario
With the target being a local support below at 1.7940
SHORT🔥
✅Like and subscribe to never miss a new idea!✅
Disclosure: I am part of Trade Nation's Influencer program and receive a monthly fee for using their TradingView charts in my analysis.

EUR-GBP Will Grow! Buy!
Hello,Traders!
EUR-GBP keeps trading in
A strong uptrend and the
Pair made a retest and a
Rebound from the horizontal
Support level around 0.8621
So we are bullish biased and
We will be expecting a
Further bullish move up
Buy!
Comment and subscribe to help us grow!
Check out other forecasts below too!
Disclosure: I am part of Trade Nation's Influencer program and receive a monthly fee for using their TradingView charts in my analysis.

SILVER RESISTANCE AHEAD|SHORT|
✅SILVER has been growing recently
And the pair seems locally overbought
So as the pair is approaching a
Horizontal resistance of 3730$
Price decline is to be expected
SHORT🔥
✅Like and subscribe to never miss a new idea!✅
Disclosure: I am part of Trade Nation's Influencer program and receive a monthly fee for using their TradingView charts in my analysis.

NG1!: Move Up Expected! Long!
My dear friends,
Today we will analyse NG1! together☺️
The price is near a wide key level
and the pair is approaching a significant decision level of 3.403 Therefore, a strong bullish reaction here could determine the next move up.We will watch for a confirmation candle, and then target the next key level of 3.429.Recommend Stop-loss is beyond the current level.
❤️Sending you lots of Love and Hugs❤️

USOIL: Local Bearish Bias! Short!
My dear friends,
Today we will analyse USOIL together☺️
The recent price action suggests a shift in mid-term momentum. A break below the current local range around 66.47 will confirm the new direction downwards with the target being the next key level of 66.19.and a reconvened placement of a stop-loss beyond the range.
❤️Sending you lots of Love and Hugs❤️

NI225: Strong Growth Ahead! Long!
My dear friends,
Today we will analyse NI225 together☺️
The in-trend continuation seems likely as the current long-term trend appears to be strong, and price is holding above a key level of 39,810.33 So a bullish continuation seems plausible, targeting the next high. We should enter on confirmation, and place a stop-loss beyond the recent swing level.
❤️Sending you lots of Love and Hugs❤️

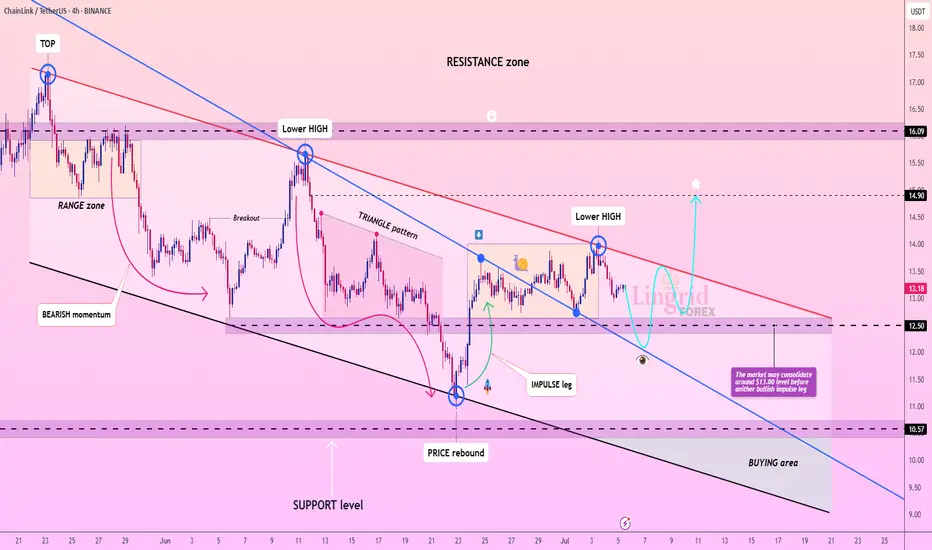
Lingrid | LINKUSDT potential Bullish BreakoutBINANCE:LINKUSDT has formed a sequence of lower highs beneath a descending red trendline, indicating that bearish pressure remains dominant. After a recent rejection near $13.80, price action is now pulling back toward the $12.50–$13.00 range where consolidation is likely. The structure suggests a potential rebound from the lower boundary before another bullish push into the resistance zone near $14.90.
📉 Key Levels
Buy zone: 12.50–13.00 (support + prior consolidation)
Sell trigger: loss of 12.50 support with strong volume
Target: 14.90 – major horizontal resistance
Buy trigger: bullish reversal from the 12.50 support zone
💡 Risks
Breakdown below $12.50 could send price toward $10.57
Lower highs pattern still intact unless $14.00 is cleared
Mid-range chop could delay trend continuation or trap longs
If this idea resonates with you or you have your own opinion, traders, hit the comments. I’m excited to read your thoughts!
Lingrid | SOLUSDT possible Channel BreakoutBINANCE:SOLUSDT is showing early signs of recovery after rebounding from the 127 support zone and reclaiming structure near the 140 level. Price is now consolidating below the red descending trendline, which acts as dynamic resistance. A breakout above 145 could confirm bullish reversal and target the 159 resistance zone as indicated by the star projection. The key lies in whether buyers can sustain pressure above the 140 zone.
📈 Key Levels
Buy zone: 138–142
Sell trigger: break below 127
Target: 159
Buy trigger: breakout and close above 145 trendline
💡 Risks
Failure to hold above 140 may lead to fresh lows
Downtrend may resume if price gets rejected at 145
Low volume breakout may signal a bull trap
If this idea resonates with you or you have your own opinion, traders, hit the comments. I’m excited to read your thoughts!

EURJPY: Bullish Outlook Explained 🇪🇺🇯🇵
There is a high chance that EURJPY will continue rising
from an underlined horizontal support.
I see 2 strong price action confirmations:
the price violated a resistance line of a bullish flag
and a neckline of a double bottom pattern.
Goal - 170.4
❤️Please, support my work with like, thank you!❤️
I am part of Trade Nation's Influencer program and receive a monthly fee for using their TradingView charts in my analysis.

USOIL Is Bearish! Short!
Please, check our technical outlook for USOIL.
Time Frame: 2h
Current Trend: Bearish
Sentiment: Overbought (based on 7-period RSI)
Forecast: Bearish
The market is approaching a key horizontal level 66.402.
Considering the today's price action, probabilities will be high to see a movement to 64.925.
P.S
We determine oversold/overbought condition with RSI indicator.
When it drops below 30 - the market is considered to be oversold.
When it bounces above 70 - the market is considered to be overbought.
Disclosure: I am part of Trade Nation's Influencer program and receive a monthly fee for using their TradingView charts in my analysis.
Like and subscribe and comment my ideas if you enjoy them!

CADCHF Is Going Up! Long!
Take a look at our analysis for CADCHF.
Time Frame: 1h
Current Trend: Bullish
Sentiment: Oversold (based on 7-period RSI)
Forecast: Bullish
The market is on a crucial zone of demand 0.583.
The oversold market condition in a combination with key structure gives us a relatively strong bullish signal with goal 0.585 level.
P.S
Please, note that an oversold/overbought condition can last for a long time, and therefore being oversold/overbought doesn't mean a price rally will come soon, or at all.
Disclosure: I am part of Trade Nation's Influencer program and receive a monthly fee for using their TradingView charts in my analysis.
Like and subscribe and comment my ideas if you enjoy them!

EUR/GBP BEST PLACE TO SELL FROM|SHORT
Hello, Friends!
The BB upper band is nearby so EUR-GBP is in the overbought territory. Thus, despite the uptrend on the 1W timeframe I think that we will see a bearish reaction from the resistance line above and a move down towards the target at around 0.856.
Disclosure: I am part of Trade Nation's Influencer program and receive a monthly fee for using their TradingView charts in my analysis.
✅LIKE AND COMMENT MY IDEAS✅
