GBP-AUD Short From Resistance! Sell!
Hello,Traders!
GBP-AUD made a retest of
The horizontal resistance
Around 2.0800 from where
We will be expecting a
Local bearish move down
Sell!
Comment and subscribe to help us grow!
Check out other forecasts below too!
Disclosure: I am part of Trade Nation's Influencer program and receive a monthly fee for using their TradingView charts in my analysis.
Signals

KAIAUSD Buy this level for a bullish continuation.Kaia (KAIAUSDT) is pulling back towards its 1W MA50 (blue trend-line) for a technical re-test of its natural long-term Support.
We think it will be a January 2024 type of test, with a breach and subsequent rebound to test the Resistance and potentially a 1W MA200 (orange trend-line) test. Target 0.32000.
-------------------------------------------------------------------------------
** Please LIKE 👍, FOLLOW ✅, SHARE 🙌 and COMMENT ✍ if you enjoy this idea! Also share your ideas and charts in the comments section below! This is best way to keep it relevant, support us, keep the content here free and allow the idea to reach as many people as possible. **
-------------------------------------------------------------------------------
💸💸💸💸💸💸
👇 👇 👇 👇 👇 👇

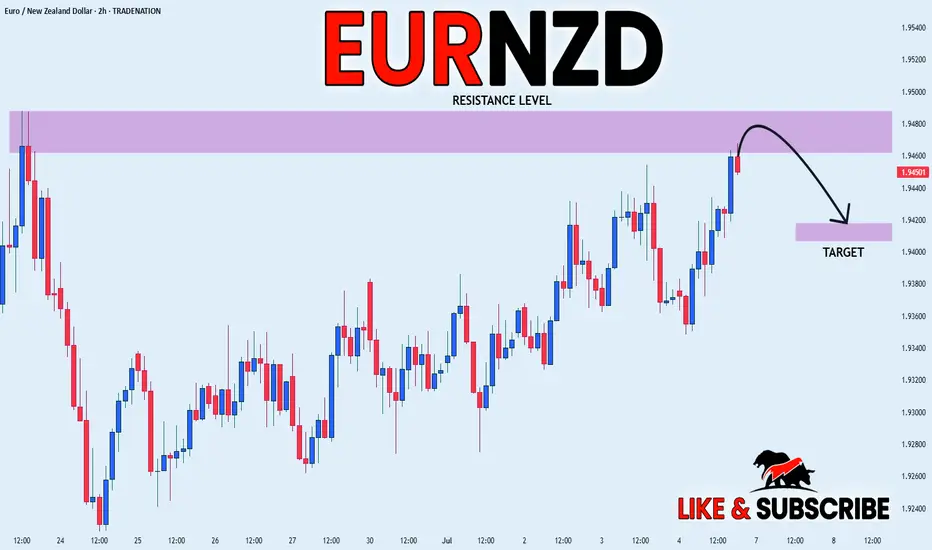
EUR_NZD LOCAL SHORT|
✅EUR_NZD is set to retest a
Strong resistance level above at 1.9488
After trading in a local uptrend for some time
Which makes a bearish pullback a likely scenario
With the target being a local support below at 1.9420
SHORT🔥
✅Like and subscribe to never miss a new idea!✅
Disclosure: I am part of Trade Nation's Influencer program and receive a monthly fee for using their TradingView charts in my analysis.
USD-CAD Local Rebound! Buy!
Hello,Traders!
USD-CAD is trading in a
Strong downtrend but
The pair made a retest
Of the horizontal support
Level of 1.3540 from where
We are already seeing a
Bullish rebound and we
Will be expecting a
Further move up
Buy!
Comment and subscribe to help us grow!
Check out other forecasts below too!
Disclosure: I am part of Trade Nation's Influencer program and receive a monthly fee for using their TradingView charts in my analysis.

Lingrid | BTCUSDT possible Channel Break - Upside Surge The price perfectly fulfilled my last idea . BINANCE:BTCUSDT is pulling back slightly after rejecting the descending red trendline near the 108,000 level, while remaining above the breakout zone around 105,000. The structure suggests a potential bullish continuation if the price holds this level and forms a higher low. A successful breakout above 108,000 could ignite a move toward the 111,000 resistance band.
📈 Key Levels
Buy zone: 105,000–105,300
Sell trigger: breakdown below 105,000
Target: 111,000
Buy trigger: breakout and retest above 108,000 with strong momentum
💡 Risks
Failure to hold 105,000 reopens path to 98,700
Bearish rejection at 108,000 could maintain lower high structure
Weak volume breakout may lead to a bull trap under 111,000
If this idea resonates with you or you have your own opinion, traders, hit the comments. I’m excited to read your thoughts!

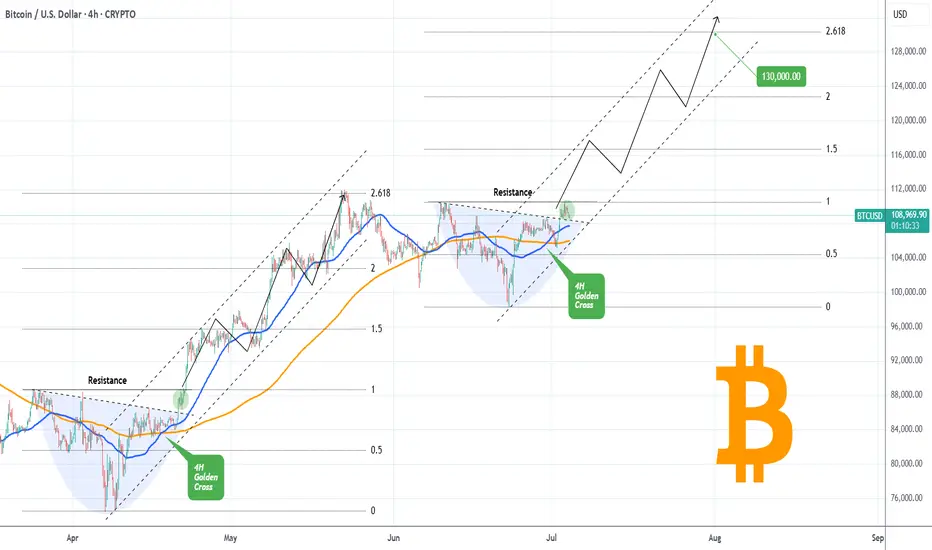
BITCOIN Golden Cross going to slingshot it to $130kBitcoin (BTCUSD) has completed a Golden Cross on the 4H time-frame and is attempting to keep the 4H MA50 (blue trend-line) as Support. If successful, it has high probabilities of staging a Channel Up similar to April - May, which peaked on the 2.618 Fibonacci extension.
So far, the bases of those to fractals are virtually identical, with a Lower Highs trend-line initially acting as a Resistance, which broke and on the current one it is testing the final Resistance (dotted trend-line).
This is the green circle, which on April 21 staged a quick consolidation before breaking aggressively upwards. If the pattern continues to repeat itself, we can get $130k (Fib 2.618 ext) at the end of the Channel Up.
Do you think it will? Feel free to let us know in the comments section below!
-------------------------------------------------------------------------------
** Please LIKE 👍, FOLLOW ✅, SHARE 🙌 and COMMENT ✍ if you enjoy this idea! Also share your ideas and charts in the comments section below! This is best way to keep it relevant, support us, keep the content here free and allow the idea to reach as many people as possible. **
-------------------------------------------------------------------------------
💸💸💸💸💸💸
👇 👇 👇 👇 👇 👇
US30: Will Go Up! Long!
My dear friends,
Today we will analyse US30 together☺️
The market is at an inflection zone and price has now reached an area around 44,585.50 where previous reversals or breakouts have occurred.And a price reaction that we are seeing on multiple timeframes here could signal the next move up so we can enter on confirmation, and target the next key level of 44,663.28.Stop-loss is recommended beyond the inflection zone.
❤️Sending you lots of Love and Hugs❤️

SILVER: The Market Is Looking Up! Long!
My dear friends,
Today we will analyse SILVER together☺️
The price is near a wide key level
and the pair is approaching a significant decision level of 36.830 Therefore, a strong bullish reaction here could determine the next move up.We will watch for a confirmation candle, and then target the next key level 36.903.Recommend Stop-loss is beyond the current level.
❤️Sending you lots of Love and Hugs❤️

EURUSD: Strong Bearish Sentiment! Short!
My dear friends,
Today we will analyse EURUSD together☺️
The recent price action suggests a shift in mid-term momentum. A break below the current local range around 1.17775 will confirm the new direction downwards with the target being the next key level of 1.17696.and a reconvened placement of a stop-loss beyond the range.
❤️Sending you lots of Love and Hugs❤️

GOLD: Bears Are Winning! Short!
My dear friends,
Today we will analyse GOLD together☺️
The in-trend continuation seems likely as the current long-term trend appears to be strong, and price is holding below a key level of 3,336.61 So a bearish continuation seems plausible, targeting the next low. We should enter on confirmation, and place a stop-loss beyond the recent swing level.
❤️Sending you lots of Love and Hugs❤️

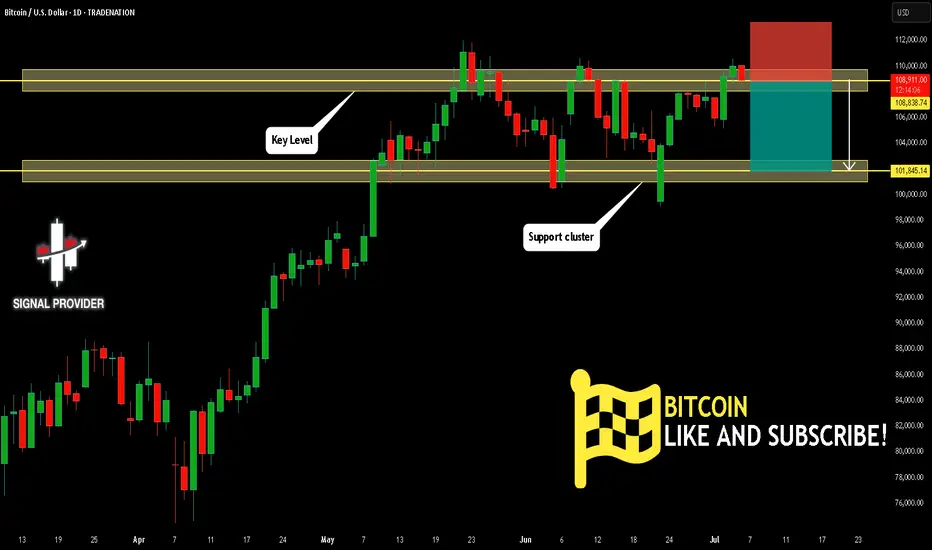
BITCOIN Will Fall! Sell!
Please, check our technical outlook for BITCOIN.
Time Frame: 1D
Current Trend: Bearish
Sentiment: Overbought (based on 7-period RSI)
Forecast: Bearish
The price is testing a key resistance 108,838.74.
Taking into consideration the current market trend & overbought RSI, chances will be high to see a bearish movement to the downside at least to 101,845.14 level.
P.S
The term oversold refers to a condition where an asset has traded lower in price and has the potential for a price bounce.
Overbought refers to market scenarios where the instrument is traded considerably higher than its fair value. Overvaluation is caused by market sentiments when there is positive news.
Disclosure: I am part of Trade Nation's Influencer program and receive a monthly fee for using their TradingView charts in my analysis.
Like and subscribe and comment my ideas if you enjoy them!
Lingrid | GOLD Pre-NFP Price Action AnalysisThe price perfectly fulfilled my last idea . OANDA:XAUUSD rebounded strongly from the 3244 support area, breaking above the downward trendline and pushing into the mid-resistance band. The price is currently testing 3353 and could pull back slightly before retesting the 3388 key resistance level. A sustained breakout above that red trendline would open the door for a run toward 3450.
📈 Key Levels
Buy zone: 3312–3330 (post-breakout retest area)
Sell trigger: break below 3312 and close under trendline
Target: 3388 with potential extension to 3450
Buy trigger: confirmed bullish bounce from 3312 and momentum above 3353
💡 Risks
Resistance at 3388 may cause rejection if volume fades
Downward trendline remains a structural cap unless fully broken
False breakout could return price back to 3244 zone quickly
If this idea resonates with you or you have your own opinion, traders, hit the comments. I’m excited to read your thoughts!

Lingrid | GBPUSD Potential Bounce at Key Psychological LevelThe price perfectly fulfilled my previous idea . FX:GBPUSD is consolidating above the upward trendline after forming a local double top near the 1.3787 resistance zone. The price is currently retesting the 1.3611–1.3660 support cluster, aligned with the trendline and previous impulse breakout area. A successful bounce from this zone could initiate another rally toward the upper boundary of the resistance range.
📈 Key Levels
Buy zone: 1.3600–1.3660 (trendline + support overlap)
Sell trigger: breakdown below 1.3600
Target: 1.3787 – resistance ceiling with prior rejection
Buy trigger: bullish reaction from 1.3611 area with strong candle close
💡 Risks
Breakdown below 1.3600 may expose deeper retracement to 1.3367
Repeated rejection at 1.3787 could form a longer-term double top
Macro data surprises could shift short-term direction suddenly
If this idea resonates with you or you have your own opinion, traders, hit the comments. I’m excited to read your thoughts!

Lingrid | SUIUSDT Pullback Setup: Expansion Trade OpportunityBINANCE:SUIUSDT is forming a bullish continuation structure within an upward channel, with the price pulling back after reaching a recent peak. Current support is found around 2.885, aligned with the upward trendline and prior breakout zone. If the price rebounds from this cluster, it may target the upper resistance near 3.20.
📈 Key Levels
Buy zone: 2.85–2.89 (support + trendline confluence)
Sell trigger: break and close below 2.85
Target: 3.20 within the upper boundary of the resistance zone
Buy trigger: bullish bounce from trendline and higher low confirmation
💡 Risks
Failure to hold above 2.88 support may invalidate the upward bias
Price volatility near trendline could trap early buyers
Rejection from 3.20 might trigger sharp retracement back to 2.70
If this idea resonates with you or you have your own opinion, traders, hit the comments. I’m excited to read your thoughts!

EUR-JPY Will Keep Growing! Buy!
Hello,Traders!
EUR-JPY is trading in an
Uptrend and the pair broke
The key horizontal level
Of 169.814 and the breakout
Is confirmed so after a potential
Retest of the support cluster
Of the rising and horizontal
Support lines below we will
Be expecting a bullish continuation
Buy!
Comment and subscribe to help us grow!
Check out other forecasts below too!
Disclosure: I am part of Trade Nation's Influencer program and receive a monthly fee for using their TradingView charts in my analysis.

KWEB: China’s Internet Sector - AI Catch-Up and Cheap ValuationsChina’s internet and tech stocks have been hammered for years — regulatory crackdowns, slowing growth fears, and geopolitical tension have crushed sentiment. But as investors know, the best opportunities often hide in what everyone hates.
Enter KWEB, the KraneShares CSI China Internet ETF.
It’s a diversified, liquid way to play a bounce in major names like Alibaba, Tencent, JD .com, Baidu, Meituan and PDD.
Here’s why I think the risk/reward looks compelling now — especially if you believe in AI closing the gap.
Key Bullish Points:
1) Valuations at Rock-Bottom
Many big China internet stocks are still trading at single-digit P/E ratios, even as their cash flows recover. Compared to U.S. big tech trading at 30–50x, this is a huge valuation gap.
Regulatory fears seem largely priced in — Beijing wants growth, not stagnation, and some policies are easing.
2) China’s AI Push — Just “Months Behind”
Jansen Whang recently argued that China’s generative AI development is only “months behind” the U.S. Players like Baidu, Alibaba Cloud, Tencent, and SenseTime are all racing to launch new LLMs and integrated AI tools.
If you believe the gap closes, Chinese platforms could see a major earnings rebound as they roll out AI upgrades across search, cloud, e-commerce and social media.
3) Sentiment So Bad, It’s Good
When the headlines scream “China is uninvestable,” that’s often when big mean reversion trades set up. Even a small policy pivot, stimulus plan, or positive AI news cycle can spark a sharp rally.
KWEB is one of the cleanest ways to express this view because it holds a diversified basket — you don’t have to pick a single winner.

Why IonQ (IONQ) Could Be the NVDA of Quantum ComputingIf you haven`t bought IONQ before the rally:
Now you need to know that IonQ isn’t just another speculative quantum stock — The company is building a robust ecosystem around its best‑in‑class trapped‑ion architecture and targeting fault‑tolerant, networked quantum systems. With record bookings, major acquisitions, and a strong balance sheet, IonQ could emerge as the NVIDIA equivalent for quantum infrastructure.
Key Bullish Arguments
1) Superior Quantum Tech – Trapped‑Ion Advantage
IonQ’s trapped-ion processors boast 99.9% two-qubit fidelity, demonstrating higher accuracy and scalability than superconducting alternatives
These systems also operate at room temperature, meaning simpler deployment and lower costs
2) Ecosystem Strategy & Acquisitions
The $1.08B acquisition of Oxford Ionics (expected close in 2025) expands IonQ’s qubit control tech, pushing toward planned 80,000 logical‑qubit systems by decade’s end
Combined with ID Quantique and Lightsynq, IonQ is building a full-stack quantum and networking offering
3) Strong Revenue Growth & Cash Runway
Revenue soared from $22M in 2023 to $43.1M in 2024, with bookings of $95.6M
. Q1 2025 saw $7.6M revenue and EPS –$0.14, beating expectations; cash reserves near $697M provide years of runway
4) Real Commercial Deployments
IonQ sold its Forte Enterprise quantum system to EPB ($22M deal) for hybrid compute and networking, marking real-world commercial applications
5) AI & Quantum Synergy
Involvement in NVIDIA’s Quantum Day and hybrid quantum‑classical AI demos (e.g., blood pump simulation with Ansys, ~12 % faster) indicates strategic synergy and positions IonQ as a critical piece in the future AI stack
Recent Catalysts:
Texas Quantum Initiative passes – positions IonQ at forefront of U.S. state-backed innovation
Oxford Ionics acquisition pending – major expansion in qubit scale & tech
Barron’s analyst buys – industry analysts see long-term potential; IonQ among top quantum picks
Broader quantum optimism – McKinsey & Morgan Stanley forecasts highlight synergy between quantum and AI, benefiting IonQ

AUD_JPY RISKY SHORT|
✅AUD_JPY is set to retest a
Strong resistance level above at 95.600
After trading in a local uptrend for some time
Which makes a bearish pullback a likely scenario
With the target being a local support below at 95.081
SHORT🔥
✅Like and subscribe to never miss a new idea!✅
Disclosure: I am part of Trade Nation's Influencer program and receive a monthly fee for using their TradingView charts in my analysis.

SILVER Short From Resistance! Sell!
Hello,Traders!
SILVER is trading in an
Uptrend but the price will
Soon hit a horizontal resistance
Area around 37,32$ from
Where we will be expecting
A local bearish correction
Sell!
Comment and subscribe to help us grow!
Check out other forecasts below too!
Disclosure: I am part of Trade Nation's Influencer program and receive a monthly fee for using their TradingView charts in my analysis.

GBP_CAD BEARISH BREAKOUT|SHORT|
✅GBP_CAD broke the key structure level of 1.8580
While trading in an local downtrend
Which makes me bearish
And as the retest of the level is complete
Bearish continuation will follow
SHORT🔥
✅Like and subscribe to never miss a new idea!✅
Disclosure: I am part of Trade Nation's Influencer program and receive a monthly fee for using their TradingView charts in my analysis.

EUR-AUD Bearish Breakout! Sell!
Hello,Traders!
EUR-AUD was trading along
The rising support line but
Now we are seeing a bearish
Breakout so we are bearish
Biased and we will be expecting
A further bearish move down
Sell!
Comment and subscribe to help us grow!
Check out other forecasts below too!
Disclosure: I am part of Trade Nation's Influencer program and receive a monthly fee for using their TradingView charts in my analysis.

SUI Historic Pitchfork targets $10 at least!Sui (SUIUSD) has been staging a bounce attempt on its 1W MA50 (blue trend-line) since last week and if the current 1W candle closes in green, it will be the first 2-week green streak of Sui since March 24.
There are high probabilities of a sustainable rebound here, that may very well turn into a strong parabolic rally, similar to those of August - December 2024 and October 2023 - March 2024.
The reason is that the price hit and is staging this rebound attempt on the 0.786 level of the Pitchfork, which is where it started the April 07 2025 rally.
If we repeat the 'shortest' of those parabolic rallies (+492.14%), then we should hit $10.00 at least, which will also test the 0.236 level of the Pitchfork.
-------------------------------------------------------------------------------
** Please LIKE 👍, FOLLOW ✅, SHARE 🙌 and COMMENT ✍ if you enjoy this idea! Also share your ideas and charts in the comments section below! This is best way to keep it relevant, support us, keep the content here free and allow the idea to reach as many people as possible. **
-------------------------------------------------------------------------------
💸💸💸💸💸💸
👇 👇 👇 👇 👇 👇

ADAUSD Is this 1W Golden Cross what the market needs??Cardano (ADAUSD) just formed a 1W Golden Cross this week, the first in its history, amidst a continuous bearish sequence since the December 02 2024 High. With its 1W RSI just below neutrality, this simply highlights the undervalued condition of this token relative not only to the rest of the high cap market, but also to its previous Bull Cycle.
As you can see, based both on 1W RSI and price action terms, we may be in a consolidation phase similar to September - November 2020, at the end of a Megaphone pattern. That pattern was the Accumulation vessel of the Cycle that led to the massive 2021 parabolic rally and the eventual Cycle Top / Higher High of the historic Channel Up.
According to that, we should be expecting a 1.236 Fibonacci extension test, targeting $5.000.
-------------------------------------------------------------------------------
** Please LIKE 👍, FOLLOW ✅, SHARE 🙌 and COMMENT ✍ if you enjoy this idea! Also share your ideas and charts in the comments section below! This is best way to keep it relevant, support us, keep the content here free and allow the idea to reach as many people as possible. **
-------------------------------------------------------------------------------
💸💸💸💸💸💸
👇 👇 👇 👇 👇 👇
