EURUSD: The Market Is Looking Down! Short!
My dear friends,
Today we will analyse EURUSD together☺️
The recent price action suggests a shift in mid-term momentum. A break below the current local range around 1.17808 will confirm the new direction downwards with the target being the next key level of 1.17671.and a reconvened placement of a stop-loss beyond the range.
❤️Sending you lots of Love and Hugs❤️
Signals

GOLD: Strong Bearish Sentiment! Short!
My dear friends,
Today we will analyse GOLD together☺️
The in-trend continuation seems likely as the current long-term trend appears to be strong, and price is holding below a key level of 3,341.44 So a bearish continuation seems plausible, targeting the next low. We should enter on confirmation, and place a stop-loss beyond the recent swing level.
❤️Sending you lots of Love and Hugs❤️

Trading balanceTrading balance The price of the asset has rebounded from the balance zone. With the prospect of growth into the resistance zone.
DOW JONES This is how it hits 50000 by the end of the year.Dow Jones (DJI) has been trading within a Channel Up pattern since the October 03 2022 market bottom and since the April 07 2025 Low, it's been unfolding the pattern's new Bullish Leg.
Ahead of an emerging 1D Golden Cross, the first since December 13 2022, the price action looks more bullish than ever strongly supported by the 1D MA50 (blue trend-line).
In fact, it is not that different from the fractal of that last 1D Golden Cross, which traded inside a neckline before the Bullish Leg broke upwards and completed eventually a +39.96% rise.
We expect a 50000 test towards the end of the year at the top of the Channel Up, which is still marginally below the tolerance levels of a +39.36% rise.
-------------------------------------------------------------------------------
** Please LIKE 👍, FOLLOW ✅, SHARE 🙌 and COMMENT ✍ if you enjoy this idea! Also share your ideas and charts in the comments section below! This is best way to keep it relevant, support us, keep the content here free and allow the idea to reach as many people as possible. **
-------------------------------------------------------------------------------
Disclosure: I am part of Trade Nation's Influencer program and receive a monthly fee for using their TradingView charts in my analysis.
💸💸💸💸💸💸
👇 👇 👇 👇 👇 👇

BITCOIN Bull Cycle's next two probable stops..Bitcoin (BTCUSD) has been trading within a 2.5-year Channel Up throughout the entirety of its 2023 - 2025 Bull Cycle, showcasing incredible consistency. This is perhaps BTC's most stable Bull Cycle and that can help us estimate to some degree its next two key levels, before its tops.
As you can see, every major Higher High of this pattern has been either on or marginally above a +0.5 Fibonacci interval:
Fib 0.5 was the February 2023 High and Accumulation Phase.
Fib 1.0 the April - September 2023 Accumulation.
Fib 1.5 December 2023 - January 2024.
Fib 2.0 March - September 2024.
Fib 2.5 December 2024 - February 2025.
Right now the market seems to be attempting a break-out above a Bull Flag, following the massive April 07 2025 rebound on the 1W MA50 (blue trend-line), a level that has been the most optimal buy entry in the past 2 years.
The next stop based on this model is the 3.0 Fibonacci extension level at 133000, where there are high probabilities for the market to consolidate (accumulation phase) in preparation for perhaps the final stop and Cycle peak on the 3.5 Fib ext around 191000. As we've discussed on previous analyses, a final Target between those two around $150000 may be more fitting, carrying less risk into the final months of the Bull Cycle.
So what do you think? Do you believe that's the blueprint to follow until the end of the year/ Cycle? Feel free to let us know in the comments section below!
-------------------------------------------------------------------------------
** Please LIKE 👍, FOLLOW ✅, SHARE 🙌 and COMMENT ✍ if you enjoy this idea! Also share your ideas and charts in the comments section below! This is best way to keep it relevant, support us, keep the content here free and allow the idea to reach as many people as possible. **
-------------------------------------------------------------------------------
💸💸💸💸💸💸
👇 👇 👇 👇 👇 👇

Wait for your EDGE...
Discipline is what separates professionals from amateurs.
Stay patient. Wait for your edge. Let the probabilities work in your favor.
👉 “Agree with this? Hit Boost to spread the message.”
#TradingPsychology #Discipline #BTC #Bitcoin #Forex
#TradingMindset #AlBrooks #TradingDiscipline #PriceAction #ForexTrading #CryptoTrading #StockMarket #MJTrading #TradingQuotes #TraderLife #MindOverMarkets

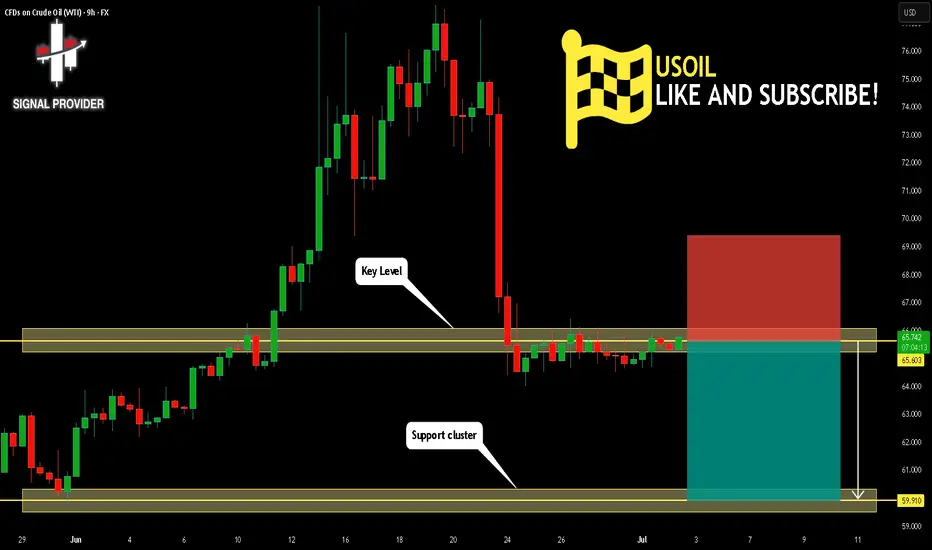
USOIL Will Fall! Sell!
Take a look at our analysis for USOIL.
Time Frame: 9h
Current Trend: Bearish
Sentiment: Overbought (based on 7-period RSI)
Forecast: Bearish
The market is testing a major horizontal structure 65.603.
Taking into consideration the structure & trend analysis, I believe that the market will reach 59.910 level soon.
P.S
The term oversold refers to a condition where an asset has traded lower in price and has the potential for a price bounce.
Overbought refers to market scenarios where the instrument is traded considerably higher than its fair value. Overvaluation is caused by market sentiments when there is positive news.
Disclosure: I am part of Trade Nation's Influencer program and receive a monthly fee for using their TradingView charts in my analysis.
Like and subscribe and comment my ideas if you enjoy them!
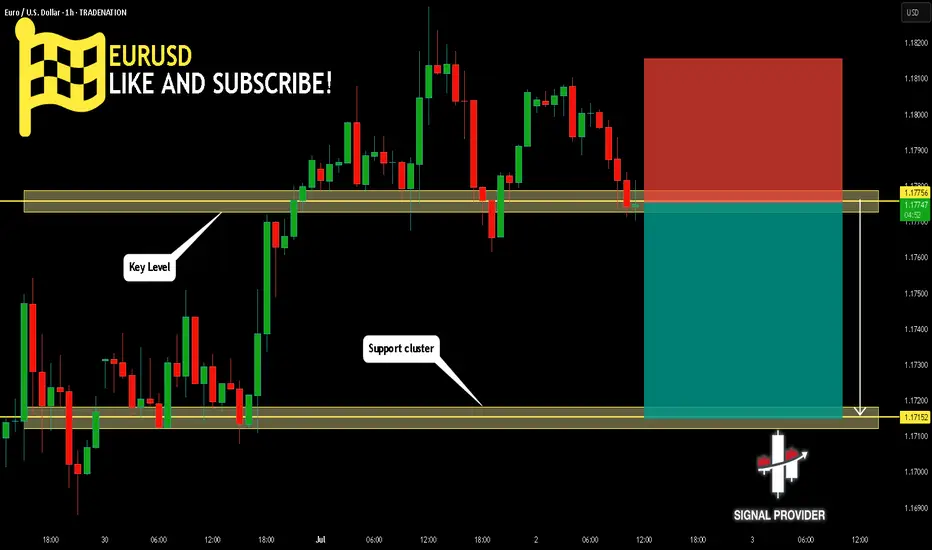
EURUSD Will Go Down From Resistance! Short!
Please, check our technical outlook for EURUSD.
Time Frame: 1h
Current Trend: Bearish
Sentiment: Overbought (based on 7-period RSI)
Forecast: Bearish
The market is approaching a key horizontal level 1.177.
Considering the today's price action, probabilities will be high to see a movement to 1.171.
P.S
We determine oversold/overbought condition with RSI indicator.
When it drops below 30 - the market is considered to be oversold.
When it bounces above 70 - the market is considered to be overbought.
Disclosure: I am part of Trade Nation's Influencer program and receive a monthly fee for using their TradingView charts in my analysis.
Like and subscribe and comment my ideas if you enjoy them!
USDCHF Will Go Lower! Sell!
Here is our detailed technical review for USDCHF.
Time Frame: 2h
Current Trend: Bearish
Sentiment: Overbought (based on 7-period RSI)
Forecast: Bearish
The market is approaching a significant resistance area 0.792.
Due to the fact that we see a positive bearish reaction from the underlined area, I strongly believe that sellers will manage to push the price all the way down to 0.785 level.
P.S
Overbought describes a period of time where there has been a significant and consistent upward move in price over a period of time without much pullback.
Disclosure: I am part of Trade Nation's Influencer program and receive a monthly fee for using their TradingView charts in my analysis.
Like and subscribe and comment my ideas if you enjoy them!

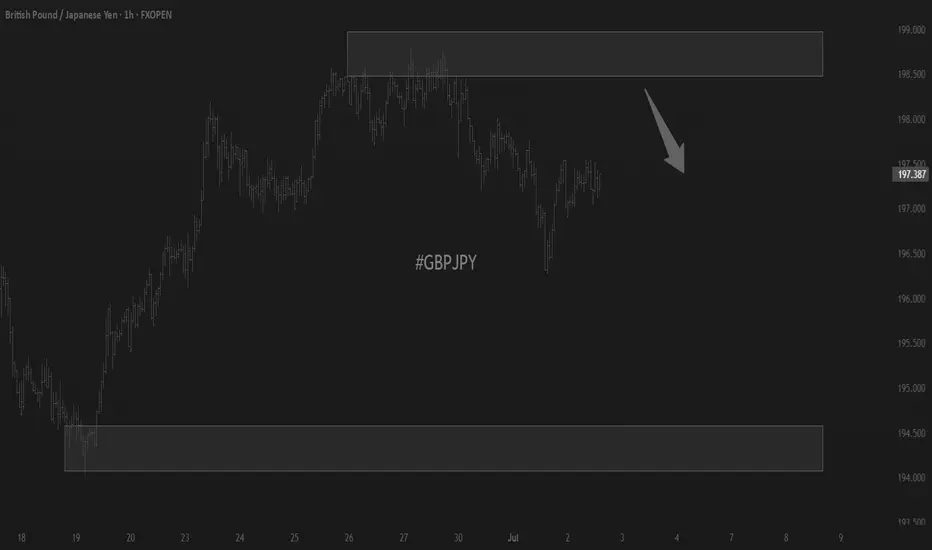
GBPUSD Will Go Up! Buy!
Take a look at our analysis for GBPUSD.
Time Frame: 8h
Current Trend: Bullish
Sentiment: Oversold (based on 7-period RSI)
Forecast: Bullish
The market is on a crucial zone of demand 1.370.
The oversold market condition in a combination with key structure gives us a relatively strong bullish signal with goal 1.378 level.
P.S
Please, note that an oversold/overbought condition can last for a long time, and therefore being oversold/overbought doesn't mean a price rally will come soon, or at all.
Disclosure: I am part of Trade Nation's Influencer program and receive a monthly fee for using their TradingView charts in my analysis.
Like and subscribe and comment my ideas if you enjoy them!

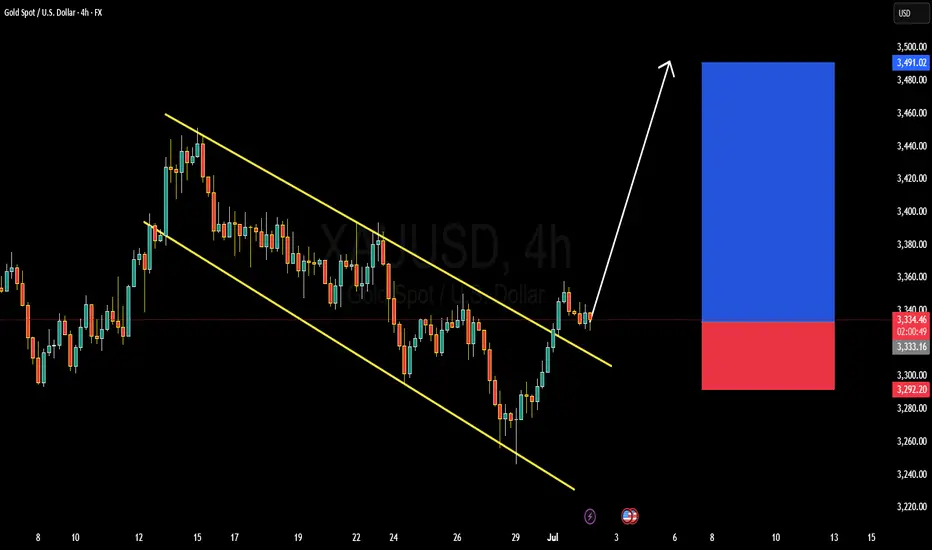
XAUUSD BULLISH OR BEARISH DETAILED ANALYSISXAUUSD has officially broken out of a well-structured descending channel on the 4H timeframe, suggesting a potential shift in market sentiment from bearish to bullish. After multiple rejections from the lower boundary and consistent pressure on the upper trendline, the breakout above the channel confirms a strong upside bias. Price is currently holding near 3330, and I’m now eyeing 3450 as the next key resistance level. This setup aligns perfectly with a textbook channel breakout, offering a solid risk-to-reward scenario for bullish continuation.
The breakout comes at a time when macro fundamentals are supportive of gold strength. With rising uncertainty surrounding global inflation trends and mixed economic signals from the US, investors are leaning back into gold as a defensive hedge. The US dollar has shown signs of softening amid increasing speculation that the Fed could pivot to a more neutral stance in the coming months. This gives gold more breathing room to the upside, especially as real yields begin to flatten out.
Geopolitical tensions, especially renewed volatility around global trade and Middle East developments, are further fueling demand for safe-haven assets like XAUUSD. The recent breakout is backed by rising volume and momentum indicators turning bullish, making this move more sustainable than a short-term spike. Gold typically thrives during periods of uncertainty and shifting rate expectations, and that’s exactly the phase we are entering now.
From a technical and macroeconomic perspective, gold is showing strength just as the broader markets begin to wobble. This breakout isn’t just about structure—it’s supported by real macro catalysts and seasonal demand strength. I'm bullish toward the 3450 zone, and any retest of the broken channel resistance now turned support would offer an attractive entry. Staying focused on gold as a top performer in Q3 could offer strong upside with controlled risk.
Lingrid | PEPEUSDT Inverse Head and Shoulder. Bullish Reversal ?BINANCE:PEPEUSDT is forming a potential reversal setup after rebounding from the 0.00000876 support within a well-defined downward channel. Price action shows signs of accumulation with a right shoulder (RS) formation and a potential breakout brewing above the descending blue trendline. A clean push toward the 0.00001125 resistance would confirm the pattern and may trigger further upside toward the red trendline.
📈 Key Levels
Buy zone: 0.00000876–0.00000900
Sell trigger: failure below 0.00000876
Target: 0.00001125
Buy trigger: breakout and retest of 0.00000960–0.00000980
💡 Risks
Strong resistance from downward channel could limit upside
Breakout failure may trap buyers near 0.00000980
Low liquidity increases volatility risk near major levels
If this idea resonates with you or you have your own opinion, traders, hit the comments. I’m excited to read your thoughts!

GBP_CAD WILL KEEP GROWING|LONG|
✅GBP_CAD is trading in an
Uptrend and the pair made a
Retest and a rebound from the
Horizontal support of 1.8675
So we are bullish biased and
We will be expecting a
Further bullish move up
LONG🚀
✅Like and subscribe to never miss a new idea!✅
Disclosure: I am part of Trade Nation's Influencer program and receive a monthly fee for using their TradingView charts in my analysis.

NZD-CAD Swing Short! Sell!
Hello,Traders!
NZD-CAD keeps growing
In an uptrend but the pair
Will soon retest a wide
Horizontal resistance level
Around 0.8350 so after the
Retest we will be expecting
A bearish pullback
Sell!
Comment and subscribe to help us grow!
Check out other forecasts below too!
Disclosure: I am part of Trade Nation's Influencer program and receive a monthly fee for using their TradingView charts in my analysis.

ETHEREUM Perhaps the easiest long out there.Ethereum (ETHUSD) is consolidating just above the Buy Zone of the Mayer Multiple Bands (MMBs) where it rebounded on its April bottom.
Throughout its historic price action, every time it hit this Zone and rebounded, it reached at least the bottom of its Mean MM zone (red Zone).
As a result, $4000 towards the end of the year may be the easiest Target in the market right now.
-------------------------------------------------------------------------------
** Please LIKE 👍, FOLLOW ✅, SHARE 🙌 and COMMENT ✍ if you enjoy this idea! Also share your ideas and charts in the comments section below! This is best way to keep it relevant, support us, keep the content here free and allow the idea to reach as many people as possible. **
-------------------------------------------------------------------------------
💸💸💸💸💸💸
👇 👇 👇 👇 👇 👇

WTI OIL This is the only Support right now.WTI Crude Oil (USOIL) is so far holding its 1D MA50 (blue trend-line), the natural medium-term Support, following a quick price deflation after the Israel - Iran de-escalation.
In our opinion, the trend-line that currently matters most though, is the Higher Lows coming straight from the May 05 Low. If broken, we expect a quick test of the 0.786 Fibonacci retracement level, as it resembles the December 2023 - May 2024 Higher Lows trend-line.
Even the 1W RSI is similar among the two fractals, and it has to be said that both are part of the 2-year Channel Down pattern.
So if the Higher Lows trend-line breaks, we can target $61.00.
-------------------------------------------------------------------------------
** Please LIKE 👍, FOLLOW ✅, SHARE 🙌 and COMMENT ✍ if you enjoy this idea! Also share your ideas and charts in the comments section below! This is best way to keep it relevant, support us, keep the content here free and allow the idea to reach as many people as possible. **
-------------------------------------------------------------------------------
Disclosure: I am part of Trade Nation's Influencer program and receive a monthly fee for using their TradingView charts in my analysis.
💸💸💸💸💸💸
👇 👇 👇 👇 👇 👇

EUR-CHF Long From Support! Buy!
Hello,Traders!
EUR-CHF is trading in a
Parallel range and we see
A rejection from the horizontal
Support area below around 0.9293
And we are already seeing a bullish
Reaction so a further move up
Is to be expected
Sell!
Comment and subscribe to help us grow!
Check out other forecasts below too!
Disclosure: I am part of Trade Nation's Influencer program and receive a monthly fee for using their TradingView charts in my analysis.

S&P500 Bullish Leg not over yet.The S&P500 index (SPX) has been trading within a Channel Up since the May 07 Low and is currently unfolding the latest Bullish Leg.
As you can see, it is far from having topped, not just by a plain trend-line (Higher Highs) perspective but also based on the Fibonacci and % rise terms relative to the previous Bullish Leg.
That peaked after a +7.10% rise, a little above the 3.0 Fibonacci extension. As a result, a 6330 Target on the short-term is more than fitting.
-------------------------------------------------------------------------------
** Please LIKE 👍, FOLLOW ✅, SHARE 🙌 and COMMENT ✍ if you enjoy this idea! Also share your ideas and charts in the comments section below! This is best way to keep it relevant, support us, keep the content here free and allow the idea to reach as many people as possible. **
-------------------------------------------------------------------------------
Disclosure: I am part of Trade Nation's Influencer program and receive a monthly fee for using their TradingView charts in my analysis.
💸💸💸💸💸💸
👇 👇 👇 👇 👇 👇

Lingrid | GOLD Weekly Analysis: Risk-Off Trade Unwinds OANDA:XAUUSD endured another challenging week as the Iran-Israel ceasefire continued to diminish safe-haven demand, while robust equity market performance drew capital away from precious metals. The risk-on environment has fundamentally shifted investor priorities, with growth assets overshadowing traditional defensive plays like gold.
The chart reveals gold testing the crucial $3,270 support zone, representing a significant confluence level where the upward trendline intersects with horizontal support. This area has historically provided strong buying interest and serves as a critical inflection point for gold's medium-term direction.
From a broader perspective, the 4H chart shows gold approaching the lower boundary of its established upward channel around $3,250. The pullback from the HH near $3,450 has accelerated through multiple support levels, with the downward trendline acting as dynamic support to any recovery attempts.
A decisive break below the $3,235 - $3,250 support confluence could trigger further selling toward the $3,200 major support zone. However, the long-term upward trendline dating back several months provides substantial technical backing. A successful defense of current levels would likely attract value buyers and could spark a relief rally toward the $3,330-$3,350 resistance area, particularly if geopolitical tensions resurface or equity markets show signs of fatigue.
If this idea resonates with you or you have your own opinion, traders, hit the comments. I’m excited to read your thoughts!

US30: Bears Are Winning! Short!
My dear friends,
Today we will analyse US30 together☺️
The market is at an inflection zone and price has now reached an area around 44,041.6 where previous reversals or breakouts have occurred.And a price reaction that we are seeing on multiple timeframes here could signal the next move down so we can enter on confirmation, and target the next key level of 44,013.0..Stop-loss is recommended beyond the inflection zone.
❤️Sending you lots of Love and Hugs❤️

GOLD: Next Move Is Up! Long!
My dear friends,
Today we will analyse GOLD together☺️
The price is near a wide key level
and the pair is approaching a significant decision level of 3,346.90 Therefore, a strong bullish reaction here could determine the next move up.We will watch for a confirmation candle, and then target the next key level of 3,365.74.Recommend Stop-loss is beyond the current level.
❤️Sending you lots of Love and Hugs❤️

EURUSD: Target Is Up! Long!
My dear friends,
Today we will analyse EURUSD together☺️
The recent price action suggests a shift in mid-term momentum. A break above the current local range around 1.18033 will confirm the new direction upwards with the target being the next key level of 1.18161 and a reconvened placement of a stop-loss beyond the range.
❤️Sending you lots of Love and Hugs❤️

SILVER: Move Down Expected! Short!
My dear friends,
Today we will analyse SILVER together☺️
The in-trend continuation seems likely as the current long-term trend appears to be strong, and price is holding below a key level of 36.310 So a bearish continuation seems plausible, targeting the next low. We should enter on confirmation, and place a stop-loss beyond the recent swing level.
❤️Sending you lots of Love and Hugs❤️
