USDCAD Will Go Down From Resistance! Short!
Please, check our technical outlook for USDCAD.
Time Frame: 1D
Current Trend: Bearish
Sentiment: Overbought (based on 7-period RSI)
Forecast: Bearish
The market is trading around a solid horizontal structure 1.375.
The above observations make me that the market will inevitably achieve 1.362 level.
P.S
We determine oversold/overbought condition with RSI indicator.
When it drops below 30 - the market is considered to be oversold.
When it bounces above 70 - the market is considered to be overbought.
Disclosure: I am part of Trade Nation's Influencer program and receive a monthly fee for using their TradingView charts in my analysis.
Like and subscribe and comment my ideas if you enjoy them!
Signals

NZDUSD Will Go Higher! Long!
Here is our detailed technical review for NZDUSD.
Time Frame: 1D
Current Trend: Bullish
Sentiment: Oversold (based on 7-period RSI)
Forecast: Bullish
The market is testing a major horizontal structure 0.592.
Taking into consideration the structure & trend analysis, I believe that the market will reach 0.602 level soon.
P.S
Overbought describes a period of time where there has been a significant and consistent upward move in price over a period of time without much pullback.
Disclosure: I am part of Trade Nation's Influencer program and receive a monthly fee for using their TradingView charts in my analysis.
Like and subscribe and comment my ideas if you enjoy them!

Gold Trading Strategy XAUUSD August 6, 2025Gold Trading Strategy XAUUSD August 6, 2025:
Spot gold edged lower in Asian trading yesterday (August 5), currently trading around $3,380/ounce. On Tuesday, the US ISM Services PMI came in at 50.1, below the forecast of 1.4 and below the previous month's reading of 0.7; the news sent gold prices soaring in the US session.
Fundamentals: Gold prices surged after weak jobs data increased the likelihood of a rate cut by the Federal Reserve. Data released last Friday showed that the number of new jobs in the US non-farm sector was much lower than expected, indicating a sharp deterioration in the labor market. The probability of the Fed cutting interest rates in September increased to 87%, up from 63% last week.
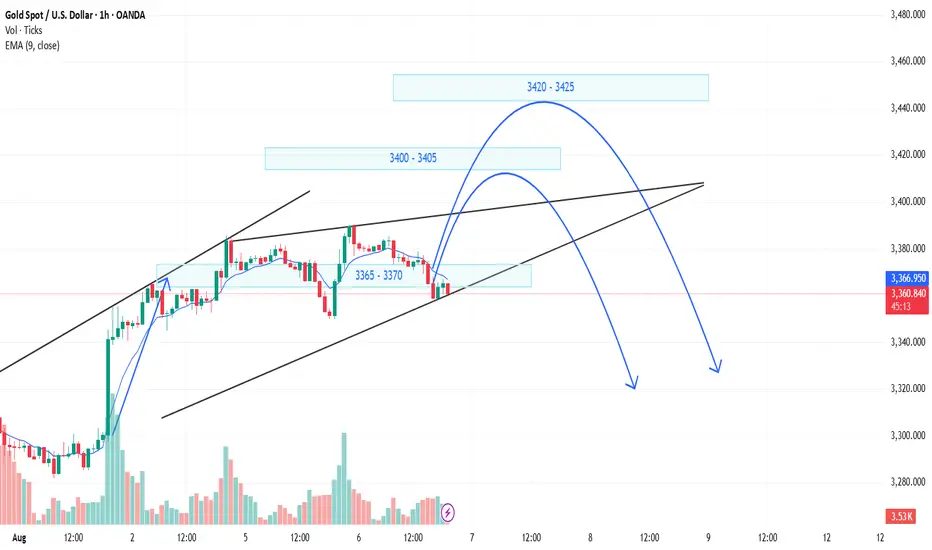
Technical analysis: Gold price is still in the uptrend channel in the H1 frame, the 3365 - 3370 area is supporting the gold price to continue following the price channel. If the gold price continues to fluctuate according to the price channel, the next prospective area could be 3400 - 3405 or even 3420 - 3425. However, the RSI and MA lines have shown signs that the buyers are weakening, so the gold price is very likely to have a strong correction from today until the end of the week.
Important price zones today: 3365 - 3370, 3400 - 3405 and 3420 - 3425.
Today's trading trend: SELL.
Recommended order:
Plan 1: SELL XAUUSD zone 3403 - 3405
SL 3408
TP 3400 - 3390 - 3380 - 3350 - OPEN.
Plan 2: SELL XAUUSD zone 3423 - 3425
SL 3428
TP 3420 - 3420 - 3400 - 3380 - OPEN.
Plan 3: BUY XAUUSD zone 3365 - 3367
SL 3362
TP 3370 - 3380 - 3390 - 3400.
Wish you a safe, successful and profitable trading day.🥰🥰🥰🥰🥰

Gold Trading Strategy XAUUSD August 6, 2025Gold Trading Strategy XAUUSD August 6, 2025:
Spot gold edged lower in Asian trading yesterday (August 5), currently trading around $3,380/ounce. On Tuesday, the US ISM Services PMI came in at 50.1, below the forecast of 1.4 and below the previous month's reading of 0.7; the news sent gold prices soaring in the US session.
Fundamentals: Gold prices surged after weak jobs data increased the likelihood of a rate cut by the Federal Reserve. Data released last Friday showed that the number of new jobs in the US non-farm sector was much lower than expected, indicating a sharp deterioration in the labor market. The probability of the Fed cutting interest rates in September increased to 87%, up from 63% last week.
Technical analysis: Gold price is still in the uptrend channel in the H1 frame, the 3365 - 3370 area is supporting the gold price to continue following the price channel. If the gold price continues to fluctuate according to the price channel, the next prospective area could be 3400 - 3405 or even 3420 - 3425. However, the RSI and MA lines have shown signs that the buyers are weakening, so the gold price is very likely to have a strong correction from today until the end of the week.
Important price zones today: 3365 - 3370, 3400 - 3405 and 3420 - 3425.
Today's trading trend: SELL.
Recommended order:
Plan 1: SELL XAUUSD zone 3403 - 3405
SL 3408
TP 3400 - 3390 - 3380 - 3350 - OPEN.
Plan 2: SELL XAUUSD zone 3423 - 3425
SL 3428
TP 3420 - 3420 - 3400 - 3380 - OPEN.
Plan 3: BUY XAUUSD zone 3365 - 3367
SL 3362
TP 3370 - 3380 - 3390 - 3400.
Wish you a safe, successful and profitable trading day.🥰🥰🥰🥰🥰

BTC recovery within the downtrend – watch for sell signalsHello friends,
Today, BTCUSD is showing a slight bearish bias, currently hovering around $115,000.
On the macro front, global financial markets are still digesting expectations that the Fed could cut interest rates in September, with current odds close to 90%, according to the CME FedWatch Tool. The main driver? Last week’s disappointing Non-Farm Payroll (NFP) report, which slightly weakened the US dollar and gave Bitcoin some short-term relief.
However, BTC is still not out of the woods. Institutional investors remain cautious, awaiting clearer signals from the Fed. If the US stock market pulls back, Bitcoin could follow suit as part of a short-term profit-taking wave.
From a technical point of view, BTCUSD is still respecting a well-defined descending channel on the H4 timeframe. Price is approaching a strong confluence resistance zone around $115,800 (Entry Sell 1), aligned with both EMA and trendline. The next key level to watch is $118,000 (Entry Sell 2) – a zone that may trigger a false breakout before sellers step back in.
Looking ahead, the plan is to sell if the price shows rejection signs near 115,800 or 118,000. Place your SL just above resistance, and TP targets at 112,000, with an extended target near the $110,000 channel bottom.
So, what’s your take – will BTC break the downtrend channel or drop further?
Drop your thoughts in the comments below!

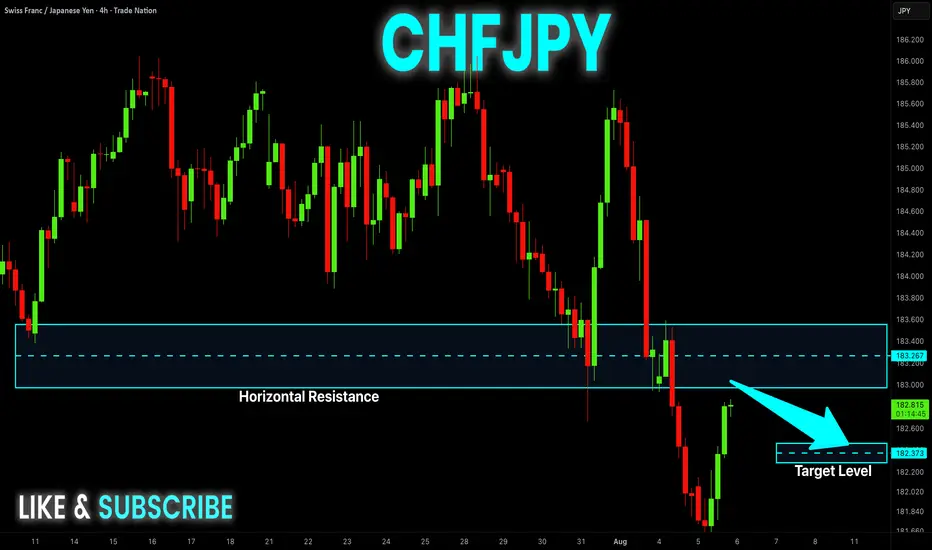
CHFJPY: Pullback From Resistance Confirmed?! 🇨🇭🇯🇵
CHFJPY may retrace from a key daily horizontal resistance.
A breakout of a support line of a consolidation range
on that on an hourly time frame provides a strong intraday confirmation.
Goal - 182.42
❤️Please, support my work with like, thank you!❤️
I am part of Trade Nation's Influencer program and receive a monthly fee for using their TradingView charts in my analysis.

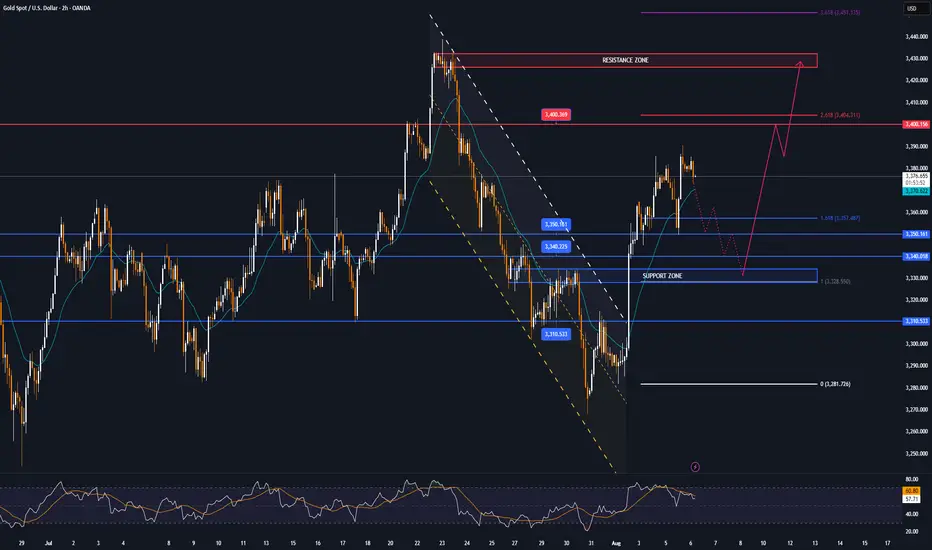
Lingrid | GOLD Potential Bullish Extension Following Pullback OANDA:XAUUSD is rebounding strongly from the support zone after a deep correction from the previous top near 3,437. The price has broken back above the range and formed a new impulse leg, now hovering just above the upward trendline. As long as the structure holds above 3,330, further continuation toward the 3,410–3,437 resistance zone remains likely. The projected wave path shows a bullish scenario targeting a retest of the top trendline.
📉 Key Levels
Buy trigger: Above 3,360
Buy zone: 3,330–3,340
Target: 3,410
Invalidation: Below 3,320
💡 Risks
Rejection from 3,360 trendline may lead to retracement
Failure to hold above 3,330 support could shift bias bearish
Upcoming macroeconomic data might increase volatility
If this idea resonates with you or you have your own opinion, traders, hit the comments. I’m excited to read your thoughts!

Lingrid | GBPAUD Consolidation - Continuation ScenarioFX:GBPAUD is breaking down from the upward trendline and testing key horizontal support near 2.0500 after rejecting from a lower high in the downward channel. This structure confirms a bearish continuation bias within the broader descending pattern. A clean break below 2.0500 opens the path toward the next support level around 2.0358. The failure to reclaim the lower high signals growing bearish pressure on the pair.
📉 Key Levels
Sell trigger: Break and hold below 2.0500
Sell zone: 2.0500–2.0480
Target: 2.0358
Invalidation: Return above 2.0506
💡 Risks
Bullish defense of 2.0500 could trigger a rebound
Re-entry into the broken trendline may trap sellers
Broader AUD weakness may delay downside move
If this idea resonates with you or you have your own opinion, traders, hit the comments. I’m excited to read your thoughts!

Lingrid | XRPUSDT Potential Upside Move From Support ZoneThe price perfectly fulfilled my previous idea . BINANCE:XRPUSDT is rebounding after a breakout from the consolidation zone and testing support around 2.897. The price is forming a bullish structure within a downward channel, aiming to reclaim the mid-level resistance. As long as it remains above 2.897, the bullish wave has room to target the descending channel’s upper boundary near 3.230. Momentum is gradually shifting toward upside continuation following the recent breakout and rebound.
📉 Key Levels
Buy trigger: Break and hold above 2.960
Buy zone: 2.850–2.960
Target: 3.230
Invalidation: Drop below 2.740
💡 Risks
Failure to hold 2.870 could invalidate the rebound
Overall channel remains bearish, posing structural resistance
Broader market sentiment may weigh on breakout momentum
If this idea resonates with you or you have your own opinion, traders, hit the comments. I’m excited to read your thoughts!

USD may weaken in the futureExperts say the USD is still under pressure after the US economy announced a "shocking" non-farm payrolls report for July and revised the May and June figures down sharply compared to forecasts and previous figures.
Experts say the rapidly weakening job market is fueling speculation that the US Federal Reserve (Fed) will soon cut interest rates in September.
However, in the last session, the USD basically stopped falling sharply, when data on the US service and aggregate purchasing managers' indexes increased quite well in July. This has helped the USD not to fall too much.
The USD is expected to remain volatile when the US announces weekly employment on Thursday. Next week is the July consumer price index (CPI). This is an important indicator for the Fed to make a decision on interest rate policy at its meeting in September. This index will strongly affect the trend of the USD.

USD increased slightly and JPY decreased deeplyThe world USD price increased slightly. The USD-Index reached 98.79 points, 0.08 points higher than yesterday. According to CNBC, the USD increased in value compared to most currencies as the market focused on President Donald Trump's personnel nomination for the US Federal Reserve (Fed). Yesterday, President Donald Trump said he would soon announce decisions on replacing Governor Adriana Kugler, who resigned last Friday, including choosing the next Fed chair. Fed Chair Jerome Powell's term will end in May 2026.
Yesterday's report from the Institute for Supply Management said that the US non-manufacturing purchasing managers' index (PMI) in July fell to 50.1 from 50.8 in June. Economists polled by Reuters had forecast the services PMI would increase to 51.5. A PMI reading above 50 indicates growth in the services sector, which accounts for more than two-thirds of the economy. Investors are pricing in a high probability that the Fed will cut interest rates at its September meeting. Investment bank Goldman Sachs expects the Fed to deliver three consecutive 0.25% rate cuts starting in September...
GOLD trades in narrow range, leading market pulseThe current market pulse is still mainly revolving around the Trump-initiated tariff story, with spot OANDA:XAUUSD trading in a fairly narrow range and currently reported at $3,376/oz, down 0.13% on the day. Gold is also awaiting further impact from the Fed's interest rate cut, with a weaker Dollar providing support for non-yielding gold.
Tariff News Update
US President Donald Trump said on Tuesday (August 5) that US tariffs on imported semiconductors and pharmaceuticals will be announced “in about a week”. The progressive tariffs on imported pharmaceuticals could be as high as 250%.
US news agency Bloomberg News said the Trump administration is now preparing to target key economic sectors and pledge to reshape global trade.
“We’re going to start with a lower tariff on drugs, but within a year, not more than a year and a half, it’s going to be 150%, then 250% because we want drugs made in our country,” Trump said in an interview with CNBC on Tuesday. He did not specify what the initial tariff would be.
“We’re going to be announcing measures on semiconductors and chips, which is a different category,” Trump added. However, Trump did not provide further details.
The U.S. Commerce Department has been investigating the semiconductor market since April as it prepares for possible tariffs on an industry with estimated global sales of nearly $700 billion. The U.S. has imposed tariffs on imported cars, auto parts, as well as steel and aluminum under the Trump administration.
Tariffs on imported chips could significantly raise costs for major data center operators, including Microsoft Corp., OpenAI, Meta Platforms Inc. and Amazon.com Inc., which plan to spend billions of dollars on the advanced semiconductors needed to power their artificial intelligence businesses.
On the Fed’s interest-rate path
US job growth in July missed expectations, while nonfarm payrolls data for May and June were revised down significantly, with a combined loss of 258,000 jobs, suggesting a worsening labor market.
Furthermore, San Francisco Fed President Mary Daly said on Monday: "We may need more than two rate cuts, and more is likely." She also noted: "The labor market is not too weak, but it is weakening, and further weakening would be detrimental."
Surprising US labor market data and Daly’s dovish comments have all but confirmed the likelihood of a Fed rate cut in September. According to CME’s FedWatch tool, the market is now pricing in a 90% chance of a Fed rate cut in September.
OANDA:XAUUSD is often seen as a safe haven asset during times of political and economic uncertainty, and performs better in low-interest-rate environments.
Technical Outlook Analysis OANDA:XAUUSD
Gold is still trading in a fairly narrow range yesterday, but the price action is still mainly held above the EMA21 and it still has all the conditions for a possible increase. However, although the range is quite large, the overall situation is still showing a sideways accumulation trend.
Currently, gold is supported by the EMA21, followed by the short-term $3,310 level and the raw price point of $3,300. As long as it remains above the psychological $3,300 level, it is still eligible for a short-term bullish outlook.
Meanwhile, a break above $3,400 would open the door for a new short-term bullish cycle with the next target around $3,430 – $3,450.
On the momentum front, the RSI maintains its price action above 50 and is still far from the overbought zone (80 – 100) suggesting that there is still plenty of room for upside ahead.
During the day, in terms of technical position, gold has unchanged conditions that are inclined to increase in price, and the notable positions will be listed as follows.
Support: 3,350 – 3,340 – 3,310 USD
Resistance: 3,400 – 3,430 – 3,450 USD
SELL XAUUSD PRICE 3431 - 3429⚡️
↠↠ Stop Loss 3435
→Take Profit 1 3323
↨
→Take Profit 2 3317
BUY XAUUSD PRICE 3329 - 3331⚡️
↠↠ Stop Loss 3325
→Take Profit 1 3337
↨
→Take Profit 2 3343
gold trading strategy for todayThe price is 3,400 USD/ounce. The main reason is believed to be due to the weaker-than-expected US labor market, increasing the possibility of the US Federal Reserve (FED) cutting interest rates, thereby promoting the increase of this precious metal as investors seek gold as a safe haven.
Some analysts note that, since reaching a historical peak of 3,500 USD on April 22, 2025, the gold price has fluctuated in a narrow range from 3,180 to 3,400 USD/ounce. Based on macro assumptions, analysts predict that the gold price may reach 3,850 USD/ounce in the second quarter of 2026 and the current period is like "compressing the spring" - preparing for a strong increase in gold prices in the near future.
Meanwhile, Citigroup (a US multinational financial group) has just raised its forecast for world gold prices to $3,500/ounce in the next 3 months, $3,300/ounce for 6-2025, $3,300 - $3,600/ounce. The main reasons include concerns about US economic growth, high inflation due to US President Donald Trump's tariff policy and a weakening USD.
GBP/USD: Sell setup shaping upHey everyone, what’s your take on GBP/USD right now?
After breaking below the trendline, GBP/USD tried to retest the area but failed to hold. Price is now hovering around 1.329, and the selling pressure is still clearly present.
This current setup is aiming toward the Fibonacci 1.618 extension zone around 1.287. In the short term, a pullback could play out based on Dow Theory, and the highlighted zone might offer a prime shorting opportunity.
My bias: SELL on the retest — with tight risk management, clear TP and SL in place.
Now it’s your turn — what’s your outlook? Drop your thoughts in the comments below.
Good luck and trade smart! 💼📉

CAD_JPY STRONG UPTREND|LONG|
✅CAD_JPY is trading in an uptrend
Along the rising support line
Which makes me bullish biased
And the pair is already making
A bullish rebound from the support
So a further move up is expected
With the target of retesting the
Level above at 107.705
LONG🚀
✅Like and subscribe to never miss a new idea!✅

BITCOIN Swing Long! Buy!
Hello,Traders!
BITCOIN went down from
The highs but a strong support
Level is below around 112k$
So after the retest we will be
Expecting a local bullish rebound
Buy!
Comment and subscribe to help us grow!
Check out other forecasts below too!
Disclosure: I am part of Trade Nation's Influencer program and receive a monthly fee for using their TradingView charts in my analysis.

CRUDE OIL Bullish Bias! Buy!
Hello,Traders!
CRUDE OIL keeps falling down
And the price will soon hit
A horizontal support of 64.00$
From where we will be
Expecting a local bullish rebound
Buy!
Comment and subscribe to help us grow!
Check out other forecasts below too!
Disclosure: I am part of Trade Nation's Influencer program and receive a monthly fee for using their TradingView charts in my analysis.

USOIL FREE LONG SIGNAL|
✅CRUDE OIL retested the strong support level of 65.14$
After trading in a local downtrend from some time
Which makes a bullish rebound a likely scenario
With the Take Profit of 65.93 and SL of 64.69$
LONG🚀
✅Like and subscribe to never miss a new idea!✅

CHF-JPY Potential Short! Sell!
Hello,Traders!
CHF-JPY is making a rebound
But we are bearish biased
And after the pair hits the
Horizontal resistance of 183.400
We will be expecting a
Local bearish correction
Sell!
Comment and subscribe to help us grow!
Check out other forecasts below too!
Disclosure: I am part of Trade Nation's Influencer program and receive a monthly fee for using their TradingView charts in my analysis.
NZD_JPY LOCAL SHORT|
✅NZD_JPY went up sharply
But a strong resistance level was hit at 87.100
Thus I am expecting a pullback
And a move down towards the target of 86.937
SHORT🔥
✅Like and subscribe to never miss a new idea!✅

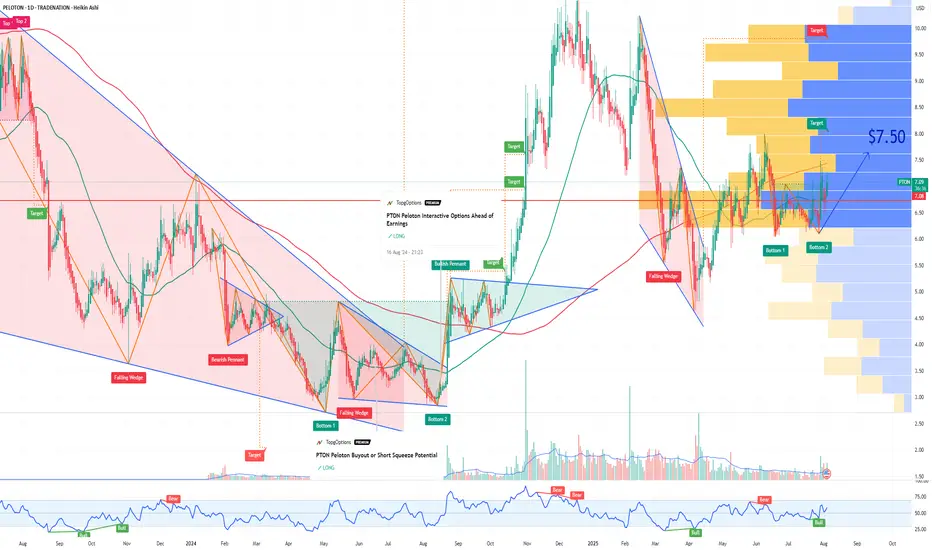
PTON Peloton Interactive Options Ahead of EarningsIf you haven`t bought the dip on PTON:
Now analyzing the options chain and the chart patterns of PTON Peloton Interactive prior to the earnings report this week,
I would consider purchasing the 7.50usd strike price Calls with
an expiration date of 2025-8-8,
for a premium of approximately $0.46.
If these options prove to be profitable prior to the earnings release, I would sell at least half of them.
Disclosure: I am part of Trade Nation's Influencer program and receive a monthly fee for using their TradingView charts in my analysis.
EUR-NZD Short From Resistance! Sell!
Hello,Traders!
EUR-NZD keeps growing
But the pair is locally overbought
So after the pair hits a horizontal
Resistance of 1.9680 we will
Be expecting a local correction
Sell!
Comment and subscribe to help us grow!
Check out other forecasts below too!
Disclosure: I am part of Trade Nation's Influencer program and receive a monthly fee for using their TradingView charts in my analysis.
