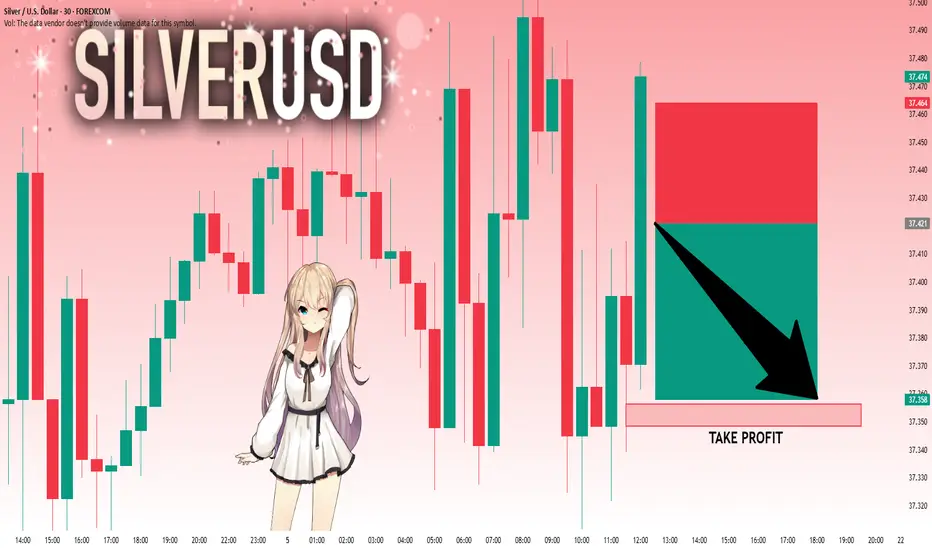
SILVER: The Market Is Looking Down! Short!
My dear friends,
Today we will analyse SILVER together☺️
The recent price action suggests a shift in mid-term momentum. A break below the current local range around 37.421 will confirm the new direction downwards with the target being the next key level of 37.356.and a reconvened placement of a stop-loss beyond the range.
❤️Sending you lots of Love and Hugs❤️
Signals
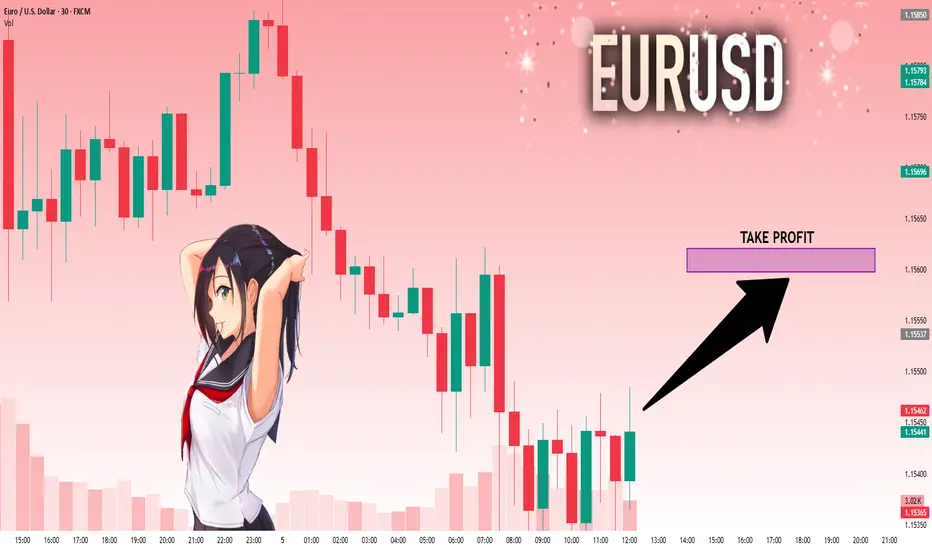
EURUSD: Strong Bullish Sentiment! Long!
My dear friends,
Today we will analyse EURUSD together☺️
The in-trend continuation seems likely as the current long-term trend appears to be strong, and price is holding above a key level of 1.15455 So a bullish continuation seems plausible, targeting the next high. We should enter on confirmation, and place a stop-loss beyond the recent swing level.
❤️Sending you lots of Love and Hugs❤️
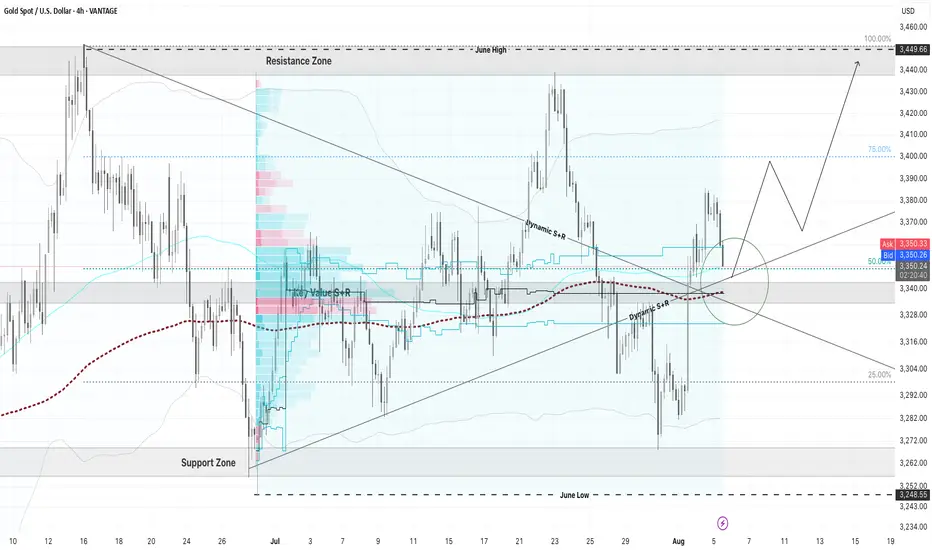
Gold Traders Pay Attention! Major Moves Incoming ? XAU/USD is setting up for a monster move — and all the signs are lining up! 👇
This is a perfect storm of technical confluence you don’t want to miss:
📊 After weeks of consolidation, gold has just broken out of a downtrend, retested the zone, and is now sitting on a major decision point. This zone is packed with:
✅ A dynamic trendline flip (was resistance, now acting as support)
✅ 200 EMA cushioning the retest
✅ 50% Fibonacci retracement aligning perfectly
✅ High-volume node from the volume profile = big player interest
✅ Mid-Bollinger Band offering bounce potential
✅ Strong bullish market structure forming
All eyes are on this green circle zone— a critical battle between bulls and bears. If bulls win here, we could see a powerful move straight into the upper resistance zone, possibly breaking previous June highs! 🦍💥
This is what smart money setups look like — multiple confirmations, clean structure, and asymmetric reward potential. 🔑📈
Tag a gold trader who needs to see this, and drop a ⚡️ if you're locked in on this breakout setup!
VANTAGE:XAUUSD FOREXCOM:XAUUSD EIGHTCAP:XAUUSD
XAUUSD – Is This a Short-Term Top?1. What happened yesterday
After dipping to 3340 in early trading—just shy of the key 3335 support where I was looking to buy—Gold resumed its bullish momentum that began on Friday. During the New York session, price spiked to a new intraday high near 3385. However, the final hour brought a pullback, and since then, Gold has entered a tight consolidation range.
2. Key question: Is Gold forming a short-term top?
The 1H chart shows a new failed breakout attempt above 3380 during the Asian session. This left behind a minor double top, with the neckline sitting around 3370. That level is especially important—it aligns with a short-term rising trendline.
3. Why a correction might follow
• Price rejected above 3380 twice
• Small double top visible on LTF
• 3370 is a make-or-break level (neckline + trendline)
• A break below could trigger a correction of the +1000 pips rally from Friday’s lows
4. Trade plan
While there is some evidence of a potential top, this remains a high-risk and aggressive short.
Any attempt to trade against the trend should be done with tight stops and small size .
5. Final thoughts
A short-term top could indeed be in place, but Gold must break below 3370 to unlock deeper downside. Until then, the bulls are still in control—just taking a breather. ⚖️
Disclosure: I am part of TradeNation's Influencer program and receive a monthly fee for using their TradingView charts in my analyses and educational articles.

Technical Scenario for TodayTechnical Scenario for Today
According to the current technical analysis:
If above 1.3384, resistance targets around 1.3408 or even 1.3438 could be targeted
Akhbar Forex
.
If 1.3351 is broken, the market could test lower support around 1.3321 or deeper if the pressure continues
📉 Expected intraday range
According to StockInvest's Daily Volatility model (based on 14-day ATR ~0.0064), GBP/USD could move within a range of ±0.48% from the opening price. If it opens around 1.330, the range could be 1.3246 – 1.3354
CoinCodex and MidForex also forecast an average price around 1.344, however this is more in line with the weekly and monthly forecasts, less related to intraday developments
coincodex.com
.
Trading balanceTrading balance The price of the asset has rebounded from the balance zone. With the prospect of growth into the resistance zone.
XAUUSD Gold Trading Strategy August 5, 2025
Yesterday's trading session, gold prices continued to increase sharply due to previous influences. However, the possibility of a short-term correction in gold prices at the end of the week will be very high.
Basic news: According to CME FEDWatch, the probability of the Fed cutting interest rates at its September meeting has now increased to about 84%, reflecting increasing concerns about economic weakness. The market is currently pricing in at least two 25 basis point cuts between now and the end of the year, showing a clear shift in investor sentiment after disappointing employment data.
Technical analysis: Gold's bullish momentum is currently showing signs of weakening. The peak area of 3383 - 3385 may create a double peak pattern on H1, but the possibility of gold prices correcting today is very low. Currently, gold prices are filling liquidity at support areas. The correction of gold prices may take place at the end of the week when buyers take profits.
Important price zones today: 3350 - 3355 and 3330 - 3335.
Today's trading trend: BUY.
Recommended orders:
Plan 1: BUY XAUUSD zone 3350 - 3352
SL 3347
TP 3355 - 3365 - 3375 - 3400.
Plan 2: BUY XAUUSD zone 3330 - 3332
SL 3327
TP 3335 - 3345 - 3365 - 3400.
Plan 3: SELL XAUUSD zone 3420 - 3422
SL 3425
TP 3417 - 3407 - 3387 - 3357 - OPEN (small volume).
Wish you a safe, successful and profitable trading day.🌟🌟🌟🌟🌟

Lingrid | EURNZD Major Resistance. Possible ShortFX:EURNZD is approaching the resistance zone after an impulse leg formed from a price rebound off the support level. The triangle pattern near the top suggests market indecision, with the current price testing key resistance near 1.96300. If the pair fails to break and hold above this resistance, a sharp reversal is likely toward the 1.9500 level. Structure favors a bearish reaction unless a confirmed breakout occurs.
📉 Key Levels
Sell trigger: Below 1.9570
Sell zone: 1.96300-1.96450
Target: 1.94985
Invalidation: Above 1.96500
💡 Risks
Bullish breakout above 1.96500 invalidates the short setup
Triangle breakout to the upside may reverse bias
External fundamentals (NZD data/news) could disrupt pattern completion
If this idea resonates with you or you have your own opinion, traders, hit the comments. I’m excited to read your thoughts!

GOLD Will Go Up! Buy!
Take a look at our analysis for GOLD.
Time Frame: 2h
Current Trend: Bullish
Sentiment: Oversold (based on 7-period RSI)
Forecast: Bullish
The market is approaching a key horizontal level 3,372.49.
Considering the today's price action, probabilities will be high to see a movement to 3,395.61.
P.S
Please, note that an oversold/overbought condition can last for a long time, and therefore being oversold/overbought doesn't mean a price rally will come soon, or at all.
Disclosure: I am part of Trade Nation's Influencer program and receive a monthly fee for using their TradingView charts in my analysis.
Like and subscribe and comment my ideas if you enjoy them!

EURUSD Will Move Lower! Sell!
Please, check our technical outlook for EURUSD.
Time Frame: 9h
Current Trend: Bearish
Sentiment: Overbought (based on 7-period RSI)
Forecast: Bearish
The market is approaching a significant resistance area 1.156.
Due to the fact that we see a positive bearish reaction from the underlined area, I strongly believe that sellers will manage to push the price all the way down to 1.140 level.
P.S
The term oversold refers to a condition where an asset has traded lower in price and has the potential for a price bounce.
Overbought refers to market scenarios where the instrument is traded considerably higher than its fair value. Overvaluation is caused by market sentiments when there is positive news.
Disclosure: I am part of Trade Nation's Influencer program and receive a monthly fee for using their TradingView charts in my analysis.
Like and subscribe and comment my ideas if you enjoy them!

AUDUSD Is Bullish! Long!
Here is our detailed technical review for AUDUSD.
Time Frame: 1h
Current Trend: Bullish
Sentiment: Oversold (based on 7-period RSI)
Forecast: Bullish
The market is on a crucial zone of demand 0.646.
The oversold market condition in a combination with key structure gives us a relatively strong bullish signal with goal 0.647 level.
P.S
We determine oversold/overbought condition with RSI indicator.
When it drops below 30 - the market is considered to be oversold.
When it bounces above 70 - the market is considered to be overbought.
Disclosure: I am part of Trade Nation's Influencer program and receive a monthly fee for using their TradingView charts in my analysis.
Like and subscribe and comment my ideas if you enjoy them!

USDCHF Is Very Bearish! Short!
Take a look at our analysis for USDCHF.
Time Frame: 1h
Current Trend: Bearish
Sentiment: Overbought (based on 7-period RSI)
Forecast: Bearish
The price is testing a key resistance 0.808.
Taking into consideration the current market trend & overbought RSI, chances will be high to see a bearish movement to the downside at least to 0.804 level.
P.S
Overbought describes a period of time where there has been a significant and consistent upward move in price over a period of time without much pullback.
Disclosure: I am part of Trade Nation's Influencer program and receive a monthly fee for using their TradingView charts in my analysis.
Like and subscribe and comment my ideas if you enjoy them!

gold price forecast today short term increase forecastmarket overview
Gold prices had a correction around 2325 yesterday, after recovering from a low of 2,290 USD. In the context of investors expecting the Fed to cut interest rates soon, gold is being strongly supported by the prospect of loose monetary policy and the weak USD.
Factors supporting gold prices
Weaker-than-expected US labor data
The non-farm payrolls report released on Friday showed the number of new jobs reaching only 142,000 - much lower than the expected level of 180,000. This increased expectations that the Fed will cut interest rates as early as September, strongly supporting gold prices

Lingrid | SOLUSDT Corrective Move Completed ? Long OpportunityBINANCE:SOLUSDT is forming a bullish higher low just above the 158.47 support after a corrective pullback from the recent higher high. Price structure remains within the upward channel, and the rebound from key horizontal support signals a continuation setup. As long as the 158.47–160.00 zone holds, price is likely to target the 192.00 resistance near the channel's top. The ascending structure supports a bullish continuation toward the upper resistance band.
📉 Key Levels
Buy trigger: Break above 172.00
Buy zone: 158.47 – 160.00
Target: 192.00
Invalidation: Drop below 150.00
💡 Risks
Breakdown of the ascending structure below 150.00
Rejection near 172.00 without momentum confirmation
Broader market weakness could suppress breakout potential
If this idea resonates with you or you have your own opinion, traders, hit the comments. I’m excited to read your thoughts!

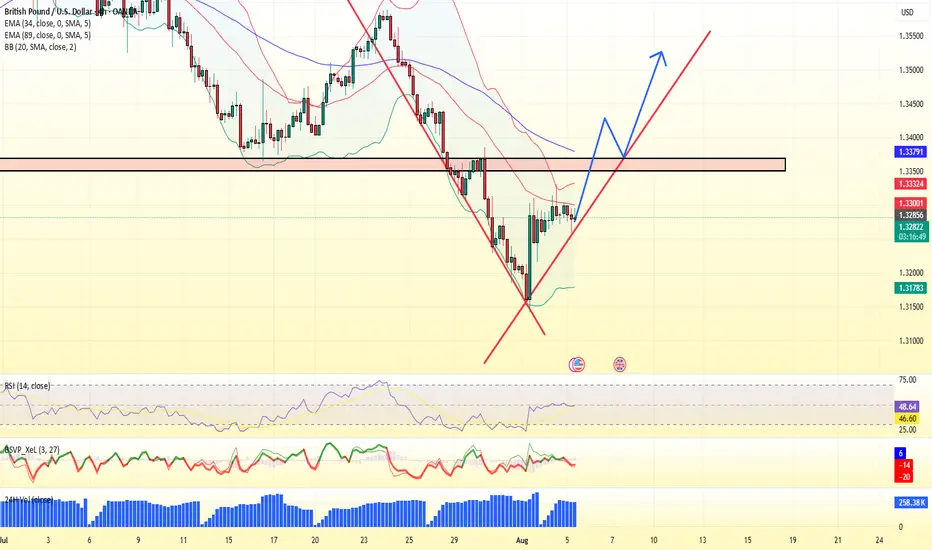
Gold’s heating up – Riding the wave or waiting for the dip?Hey everyone! So, what’s your take on XAUUSD right now?
Gold’s been on a tear lately – yesterday it kept pushing higher and is now chilling around $3,376.
The move’s mostly driven by hopes that the Fed might ease up soon, especially with recent U.S. data showing signs of slowing down.
From a chart perspective, it’s looking like we might be at the beginning of a fresh bullish wave. There’s a nice bullish confluence happening at the EMA 34 and 89, plus we’ve broken above previous resistance – both giving that upward momentum some real backing.
If price pulls back before another push, I’m keeping my eyes on the Fibo 0.5–0.618 zone. That area also lines up with the EMAs and old resistance, so it could be a sweet spot for a buy setup if things line up right.
Personally, I’m leaning bullish today.

GBP_NZD BULLISH BREAKOUT|LONG|
✅GBP_NZD broke the key structure level of 2.2500
While trading in an local downtrend
Which makes me bearish
And I think that after the retest of the broken level is complete
A rebound and bearish continuation will follow
SHORT🔥
✅Like and subscribe to never miss a new idea!✅

GOLD down slightly, watch today's data, technical conditionsOANDA:XAUUSD edged lower in Asian trading on Tuesday (August 5), currently trading around $3,380/ounce. On Tuesday, the US ISM services PMI will be released, which is the most important economic data of the week and is expected to impact the gold market.
OANDA:XAUUSD prices surged after weak jobs data increased the possibility of the Federal Reserve cutting interest rates.
Data released last Friday showed that the number of new jobs in the US non-farm sector in July was much lower than expected, and the total number of non-farm jobs in the first two months was revised down by 258,000, indicating a sharp deterioration in the labor market.
Traders now see an 87% chance of a rate cut in September, up from 63% last week, according to CME Group's FedWatch tool. Expectations of a rate cut have boosted gold prices, as the dollar provides support for the precious metal.
The US ISM non-manufacturing purchasing managers index (PMI) for July will be released today (Tuesday) and is expected to be 51.5, up from 50.8 previously.
The July ISM services PMI could impact the US dollar and gold, depending on whether it is biased towards supporting a rate cut or pausing rate cuts for an extended period.
Gold itself does not generate interest, but generally performs well in low-interest-rate environments and is seen as an inflation hedge.
On the trade front
Today (August 5), US President Donald Trump threatened to raise tariffs on Indian goods in protest at India's purchase of Russian oil. New Delhi called Trump's attack "absurd" and pledged to protect its economic interests, deepening the trade rift between the two countries.
Trump posted on the social media platform Truth Social: "India not only buys massive amounts of Russian oil, but also sells much of it on the open market at a huge profit. They don't care how many people are being killed in Ukraine by the Russian war machine."
Trump added: "Accordingly, I will be substantially increasing the tariffs that India pays to the United States."
However, Trump did not specify the specific tariff amount.
Responding to Trump's remarks, an Indian foreign ministry spokesperson said on Monday that India would "take all necessary measures to protect its national interests and economic security." The spokesperson added: "These actions against India are unjustified and unjustifiable."
Over the weekend, Reuters reported that India would continue to buy oil from Russia despite Trump’s threats.
In July, Trump announced that he would impose a 25% tariff on imports from India, and US officials have also pointed to a range of geopolitical issues as holding up the signing of a US-India trade deal.
Trump has also described the BRICS group as generally hostile to the US. Those countries have rejected Trump’s accusations, saying the group protects the interests of its members and the developing world as a whole.
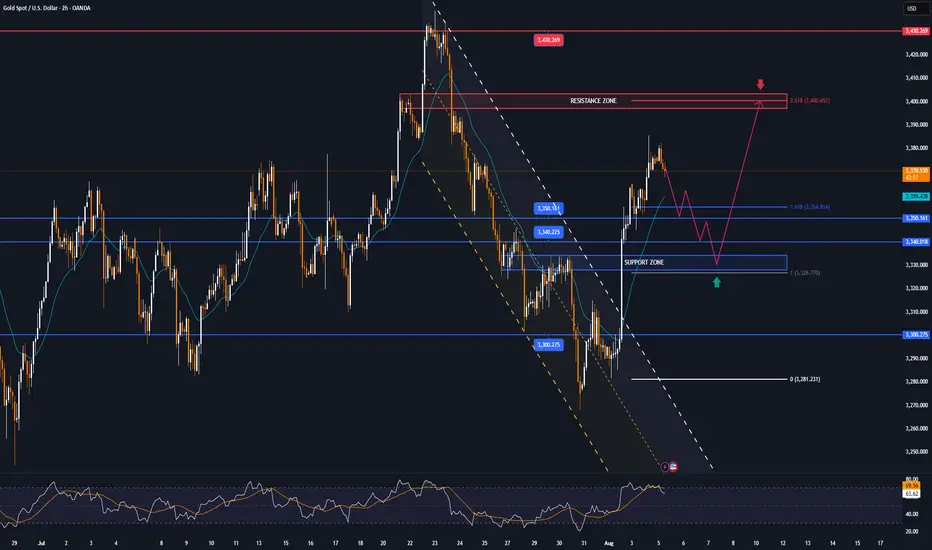
Technical Outlook Analysis OANDA:XAUUSD
On the daily chart, although gold has been very volatile in recent times, it is still moving sideways, with price action clinging to the EMA21. And after a strong recovery in the past three trading sessions, gold is temporarily limited by the 0.236% Fibonacci retracement level, which was the bullish target that readers paid attention to earlier. The return above the EMA21 provides gold with initial conditions for bullish expectations, but a new trend has not yet formed.
If gold takes its price action above the 0.236% Fibonacci retracement level and stabilizes above it, it will have room to continue rising with the next target being the raw price point of $3,400 rather than the $3,430-$3,450 target. But at its current position, it still has no clear trend either up or down.
Meanwhile, once gold sells below the 0.382% Fibonacci retracement level, it could continue to decline with a target of $3,246 in the short term, which also means that the $3,300 – $3,292 area is the current key support area.
Momentum-wise, the Relative Strength Index (RSI) is also hovering around 50 with little fluctuation, indicating a hesitant sentiment in the market without leaning to either side.
For the day, the technical outlook for gold is a sideways consolidation but the technical conditions are slightly more bullish, and the notable positions are listed as follows.
Support: $3,350 – $3,340 – $3,300
Resistance: $3,400 – $3,430
SELL XAUUSD PRICE 3402 - 3400⚡️
↠↠ Stop Loss 3406
→Take Profit 1 3394
↨
→Take Profit 2 3388
BUY XAUUSD PRICE 3329 - 3331⚡️
↠↠ Stop Loss 3325
→Take Profit 1 3337
↨
→Take Profit 2 3343
GBP-JPY Bearish Bias! Sell!
Hello,Traders!
GBP-JPY is going down
And the pair made a breakout
Of the key horizontal level
Of 195.500 so we are
Bearish biased and we
Will be expecting a
Further bearish move down
Sell!
Comment and subscribe to help us grow!
Check out other forecasts below too!
Disclosure: I am part of Trade Nation's Influencer program and receive a monthly fee for using their TradingView charts in my analysis.

SOLUSDT📊 #SOLUSDT
⏱ TIME: 1D
⭕️risk: mid
📍The initial buying market: 168-169
📌TP1: 192$
📌TP2: 224$
⛔️SL: 144$
❌These analyzes are just to give a better perspective for you dear ones
Do not base on buying and selling❌

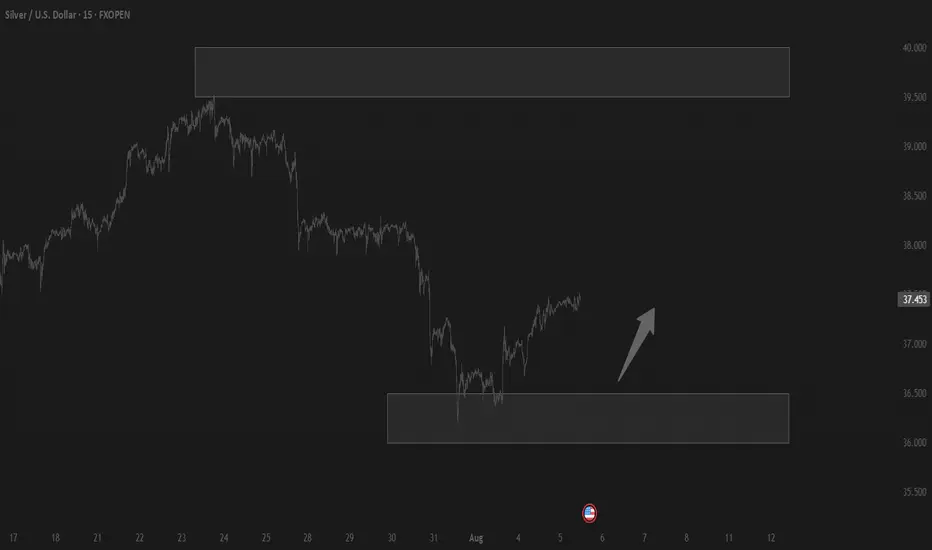
XAGUSD: Correction May Be Over – Watch $37.60 BreakoutAfter reaching a local top around the $39.50 zone on July 24, Silver entered a normal corrective phase, with price dropping over 3,000 pips from top to bottom — roughly an 8% retracement.
📉 Despite the strength of the drop, the structure was clearly corrective, not impulsive. Even more, the move formed a descending broadening wedge, a pattern that often hints at a potential reversal.
📈 Yesterday, we saw a clean breakout above the wedge’s upper boundary — which may signal the end of the correction.
At the time of writing, price is trading at $37.45, right under a key horizontal resistance zone between $37.50 and $37.60.
A breakout above this level would confirm the low and likely initiate a new move toward the $38.70 resistance.
________________________________________
🎯 Summary & Plan:
• A break above $37.60 = bullish confirmation
• Target: $38.70 (first resistance)
• Invalidation: If price drops below $37, bulls lose control
As long as price holds above the $37 zone, the technical outlook remains constructive, and traders could consider setups aligned with the upside scenario. 🚀
Disclosure: I am part of TradeNation's Influencer program and receive a monthly fee for using their TradingView charts in my analyses and educational articles.

Altcoins Recovering: TOTAL3 Bounces from Key Support ZoneIn my previous analysis on TOTAL3, I mentioned that I'm working with two possible bullish scenarios for altcoins. It now seems we're firmly in Scenario #2.
📉 The price dropped exactly into the highlighted support zone, then yesterday we saw a clean recovery and reversal starting right from that area — a textbook technical reaction.
📈 At the time of writing, TOTAL3 sits at $986B, and a break above the $995B–$1T resistance could trigger a new leg up for altcoins.
🎯 Short- and mid-term targets remain:
• $1.08T (recent top)
• $1.15T
• Potential for new all-time highs if momentum builds
✅ As long as price holds above the $920–$930B support zone, bulls remain in control. This keeps the door open for selective altcoin entries — ideally, projects with real structure, strong tokenomics, and clear momentum.

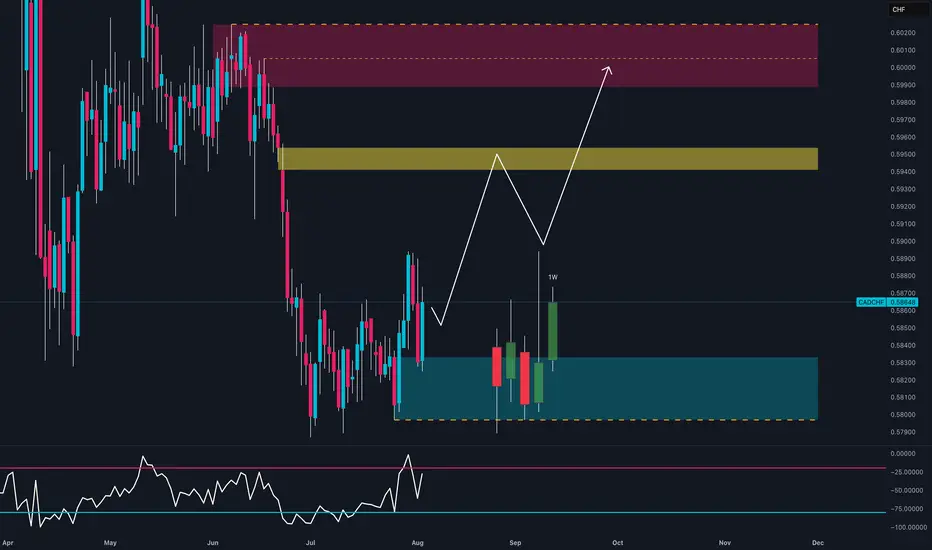
Everyone’s Short on CAD… But This Is Why I’m Going Long📊 CAD/CHF – August 4th, 2025 | Tactical Long Bias
🔹 Technical Outlook
The daily chart shows:
Strong bullish reaction within a weekly demand zone (0.5800–0.5830), confirmed by multiple lower wicks → growing buying pressure.
Weekly RSI bouncing out of oversold → potential mid-term reversal signal.
Structure may be shifting with a first target at 0.5950 (intermediate zone) and second target at 0.6000–0.6030 (major supply).
Recent bullish engulfing broke out of inside candle sequence → active technical trigger.
🧠 Commitment of Traders (COT) – July 29
Non-Commercials:
CAD: Aggressive increase in shorts (+3,888) and reduction in longs (-2,222) → heavily bearish speculative positioning.
CHF: Increase in longs (+936) and decrease in shorts (-1,095) → net bullish sentiment on CHF.
📌 However, CAD’s overstretched short positioning may lead to technical short-covering, especially if CHF starts to lose momentum.
📈 Seasonality – August
CHF: Range-bound or weak in August across all timeframes (20y, 15y, 10y).
CAD: Mild seasonal strength in August, especially on the 2y and 5y outlook.
➡️ Seasonal bias supports a tactical long on CAD/CHF during the first half of August.
✅ Trading Outlook
📌 Tactical Bias: LONG
🎯 First Target: 0.5950 → mid-level reaction zone.
🛑 Invalidation: below 0.5800 (demand breakdown).
🧠 Confluences: demand zone + RSI reversal + extreme COT positioning + seasonal support.
Lingrid | ETHUSDT Short-Term Move: Buying Opportunity at SupportThe price perfectly fulfilled my last idea . BINANCE:ETHUSDT is attempting a bounce after dipping into the lower boundary of its channel near the $3,400 support level. Price action has followed a descending structure with lower highs inside a broad downward channel. As long as the $3,400 zone holds, a rebound toward the mid-range resistance at $3,630 remains viable. Current positioning inside the "BUYING area" suggests momentum may flip bullish if a reversal structure forms.
📉 Key Levels
Buy trigger: Break above $3,630
Buy zone: $3,250 – $3,400
Target: $3,630 – $3,720
Invalidation: Break below $3,250
💡 Risks
Momentum still favors sellers from the recent sell-off
Failure to reclaim mid-range resistance could cap upside
Broader trend remains within a bearish channel structure
If this idea resonates with you or you have your own opinion, traders, hit the comments. I’m excited to read your thoughts!
