Lingrid | GBPNZD Primed For BULLISH Move. LongFX:GBPNZD bounced off the upward trendline and cleared the $2.24561 resistance, reclaiming bullish momentum after a pullback and fake breakout. With a breakout retest underway, bulls are eyeing a move toward the $2.27480 resistance zone. Higher lows confirm the channel remains intact.
📌 Key Levels
Support: 2.24561
Resistance: 2.27480
Structure: Rising trendline with breakout and retest dynamics
⚠️ Risks
Failure to hold $2.24561 may trigger deeper correction
Rejection near resistance without volume may signal a bull trap
Any sharp breakdown of the upward trendline would shift the outlook to neutral or bearish
Traders, if you liked this idea or if you have your own opinion about it, write in the comments. I will be glad 👩💻
Signalservice

Lingrid | SUIUSDT potenatil PULBACK Trade from SUPPORTThe price perfectly fulfills my last idea . BINANCE:SUIUSDT retested the $4.00 top after an extended range and has now slipped toward the lower edge of its ascending channel. Price is eyeing the $3.50 support zone for a possible bounce to resume bullish structure. The reaction near the blue trendline will be key to unlocking upside toward $4.50.
📌 Key Levels
Support level: 3.5000
Resistance: 4.0000 and 4.5000
Trend structure: Higher lows inside an ascending channel
⚠️ Risks
Failure to hold $3.50 could trigger a deeper pullback
Rejection at the $4.00 mark again would signal waning momentum
Breakdown below the upward trendline would invalidate the current bullish bias
Traders, if you liked this idea or if you have your own opinion about it, write in the comments. I will be glad 👩💻

Gold Update – Bearish Structure Intact, 3165 in SightIn my Monday analysis, I mentioned the possibility of Gold retesting the 3200 zone, and that scenario played out as expected.
After breaking back below the 3270 support, price accelerated to the downside, reaching a low around 3208.
A rebound followed, with XAUUSD retesting the 3270 zone, which now acts as resistance after the breakdown.
Looking ahead, I expect a break below the 3200 level, with the next bearish target set around the 3165 support zone.
The plan remains unchanged:
As long as Gold stays below 3270, I’m looking to sell rallies into that resistance area. 🚀
Disclosure: I am part of Trade Nation's Influencer program and receive a monthly fee for using their TradingView charts in my analyses and educational articles.

Solana Potential UpsidesHey Traders, in today's trading session we are monitoring SOL/USDT for a buying opportunity around 157 zone, Solana is trading in an uptrend and currently is in a correction phase in which it is approaching the trend at 157 support and resistance area.
Trade safe, Joe.

Lingrid | GOLD Sideways PRICE ACTION after DeclineOANDA:XAUUSD printed a clear breakout below the key upward trendline, invalidating its previous bullish range structure. This opens the door for a potential correction toward the $3,165 support zone as bearish pressure builds. Reclaiming $3,285 would be required to reintroduce bullish momentum.
📌 Key Levels
Support level: 3,165
Invalidation level: Above 3,285
Target area: 3,165 and possibly 2,967.73
⚠️ Risks
A recovery above 3,285 may trigger a fakeout reversal
Watch for bounce signals at the lower boundary of the channel
Traders, if you liked this idea or if you have your own opinion about it, write in the comments. I will be glad 👩💻

Lingrid | GBPJPY potential Short-Term RetracementFX:GBPJPY broke above the March high but immediately reversed, forming a fake breakout paired with bearish divergence. This signals potential exhaustion as the pair sits near the upper boundary of the resistance zone. A pullback toward 194.200 or deeper into the 192 area appears increasingly likely.
📌 Key Levels
Support level: 192.338
Invalidation level: Above 196.500
Target area: 194.200 and possibly 192.338
⚠️ Risks
Continued bullish pressure could invalidate the bearish reversal setup
A sustained hold above 196 would point to trend continuation toward 198+
Traders, if you liked this idea or if you have your own opinion about it, write in the comments. I will be glad 👩💻

Lingrid | BNBUSDT Bullish Pause Before Potentail RallyThe price perfectly fulfilled my previous idea . BINANCE:BNBUSDT recently broke out of a prolonged downward channel and surged into the resistance zone, briefly tapping the 700 level before retracing. The price action now consolidates above the swap zone, suggesting a potential retest before continuation. This A-B-C corrective move could provide a launchpad for bulls.
📌 Key Levels
Support zone: 637
Invalidation level: Below 637
Target area: 700
⚠️ Risks
A failure to hold the swap zone may lead to a drop toward the 600–580 range
Bearish divergence or sharp rejection from 700 may limit upside continuation
Traders, if you liked this idea or if you have your own opinion about it, write in the comments. I will be glad 👩💻

INJUSDT Potential UpsidesINJUSDT is currently trading within a broader uptrend and is in a corrective phase. The price is approaching the 13.20 level, a significant support and resistance area that aligns with the prevailing trend structure. This zone may offer useful context for observing market behavior and assessing the strength of the ongoing trend.
Trade safe, Joe.

Lingrid | GOLD Accelerating BEARISH Momentum in the MARKETOANDA:XAUUSD recently faced rejection at a lower high within the resistance zone and is now trading beneath a firm downward trendline. After a failed attempt to hold above $3,264, price has dropped sharply, signaling continuation of the bearish momentum that began after the breakout failed to sustain. The downtrend remains intact with sellers eyeing deeper support unless bulls reclaim $3,264 with momentum.
📌 Key Levels
Support zone: $3,150
Breakout target: $3,150
Invalidation level: $3,264 (local resistance / trendline retest)
⚠️ Risks
Short-term rebounds may test the trendline before continuation
False breakdown risk exists near $3,150 without volume support
Unexpected bullish reversal above $3,264 would invalidate bearish bias
Traders, if you liked this idea or if you have your own opinion about it, write in the comments. I will be glad 👩💻

Lingrid | GBPAUD Pre-Extension Coiling FormationThe price perfectly fulfilled my previous idea . FX:GBPAUD remains confined within a range below the descending trendline, where lower highs have formed consistent resistance. Price is currently rejecting the upper boundary and moving toward the trend support, aligning with a potential bearish continuation setup. If momentum persists, price could revisit the support zone and possibly extend toward the target area. Sellers may remain in control as long as price respects the descending structure and holds below key resistance.
📌 Key Levels
Resistance zone: 2.0634
Target level: 2.0350
Invalidation level: Above 2.0881
⚠️ Risks
Failed breakdown attempts from the range may cause price to retest resistance
Fakeouts above 2.0634 could trap sellers
Bullish reversal from trend support could invalidate the bearish setup
Traders, if you liked this idea or if you have your own opinion about it, write in the comments. I will be glad 👩💻

Lingrid | AVAXUSDT Bullish Momentum ContinuationThe price perfectly fulfilled my previous idea . BINANCE:AVAXUSDT has bounced from its higher low near trend support and is now pulling back after reaching a local high. The structure remains bullish overall, with price still trading inside the upward channel and holding above the $22.84 swap zone. As long as this support holds, a continuation toward the $28 resistance area remains likely. As long as the structure maintains higher lows and stays within the upward channel, bulls remain in control targeting higher levels.
📌 Key Levels
Support zone: $22.84
Breakout target: $28.00
Invalidation level: Below $22.00 (channel break and support failure)
⚠️ Risks
Deeper pullbacks may revisit the support and test demand
Failure to hold $22.84 opens potential drop toward $19.25
Resistance at $28 may trigger sharp rejections on first touch
Traders, if you liked this idea or if you have your own opinion about it, write in the comments. I will be glad 👩💻

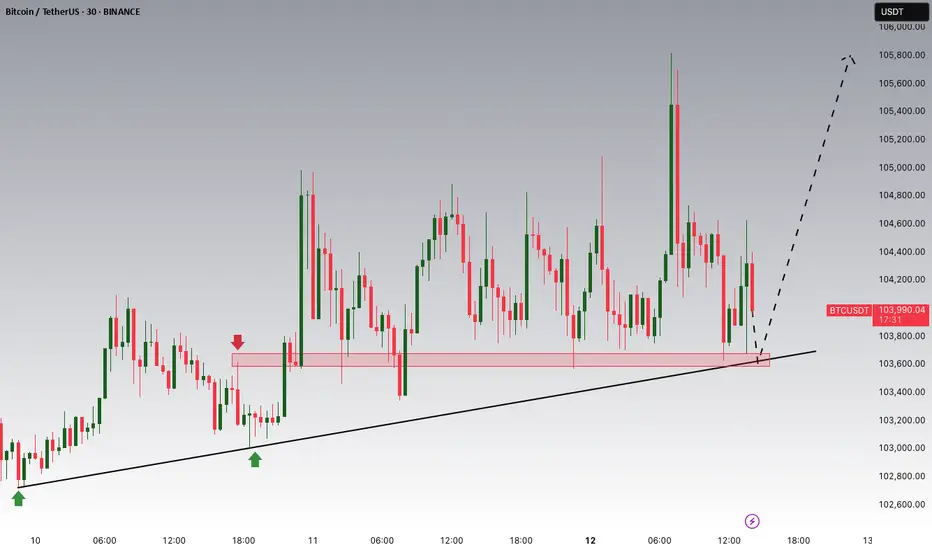
Bitcoin Potential UpsidesHey Traders, in today's trading session we are monitoring BTCUSDT for a buying opportunity around 103,000 zone, Bitcoin is trading in an uptrend and currently is in a correction phase in which it is approaching the trend at 103,000 support and resistance area.
Trade safe, Joe.
S/USDT Potential UpsidesHey Traders, in today's trading session we are monitoring S/USDT for a buying opportunity around 0.5850 zone, S/USDT is trading in an uptrend and currently is in a correction phase in which it is approaching the trend at 0.5850 support and resistance area.
Trade safe, Joe.

Lingrid | BTCUSDT potential PATHWAY to New All-Time HIGHBINANCE:BTCUSDT is testing the upper boundary of its breakout structure after reclaiming the $100,000 level and pushing above the blue upward trendline. The broader uptrend remains intact as price forms a higher low within the ascending channel and sets sights on fresh highs. Price action remains bullish with room for upside continuation if BTC holds above the breakout zone.
📌 Key Levels
Support zone: $98,000 - $100,000 (prior breakout and trendline retest)
Breakout target: $118,760 (resistance area top)
Invalidation level: Below $98,000 (break of structure + channel midline)
⚠️ Risks
Strong resistance lies just above ATH; could lead to rejection
Consolidation under resistance may delay breakout
Weekly close below $100,000 could shift momentum short-term
Traders, if you liked this idea or if you have your own opinion about it, write in the comments. I will be glad 👩💻

DXY Ready to Pop – Watch That 100 Break!After breaking below the key psychological level at 100 and making a low just under 98, the Dollar Index ( TVC:DXY ) has entered a consolidation phase.
Over the past three weeks, price has developed an inverted head and shoulders pattern, with the neckline perfectly aligning with the horizontal resistance at 100 — a strong zone of confluence from both a technical and psychological standpoint.
Despite the current hesitation under resistance, the structure suggests bullish potential. I believe we are approaching a breakout above 100, and once that happens, an acceleration to the upside is likely to follow.
🎯 Target: 102
🔒 Invalidation: A break below 98 would cancel the bullish bias.
As long as the price stays above the 98 area, I remain bullish and expect the dollar to strengthen.
🚀 The breakout hasn’t happened yet — but the pressure is building.

DXY Update – Bullish Correction in PlayAt the beginning of the month, I mentioned that the USD Index (DXY) could start a corrective move to the upside, with the 100 level being the critical line in the sand.
Indeed, the index managed to break and hold above this psychological and technical level, currently trading around 100.70, well above the former resistance now turned support.
My bullish outlook remains intact, and I expect the upside continuation to target the 102 zone in the coming sessions.
Conclusion: For pairs like EURUSD and GBPUSD, rallies should be sold as long as this bullish momentum holds. 🚀

Gold Bears Back in Control – Targeting 3270 AgainIn my analysis yesterday, I noted that after the false break above 3370 resistance, there was a high likelihood of a reversal, potentially driving Gold back down to the 3270 support zone.
Market Reaction:
• As expected, Gold turned lower after retesting the broken 3370 support, now acting as resistance.
• The price dropped nearly 1000 pips, which has become the new norm for daily Gold fluctuations lately.
W hat’s Next?
• With the current rebound, the 3370 zone should once again act as a barrier.
• The strategy remains to sell rallies, targeting a fresh test of the 3270 support zone.
Until this support is broken, expect very volatile moves, but the broader trend remains bearish
Disclosure: I am part of Trade Nation's Influencer program and receive a monthly fee for using their TradingView charts in my analyses and educational articles.

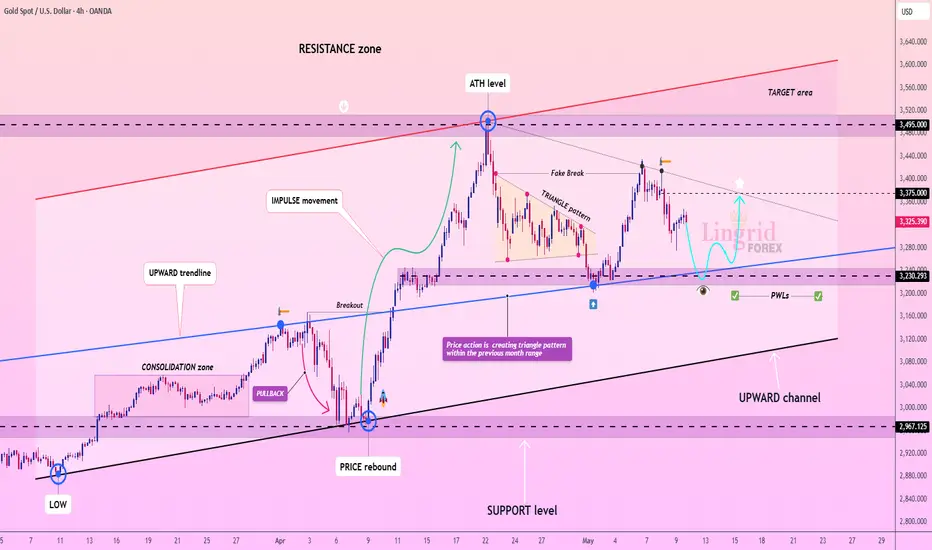
Lingrid | GOLD Weekly MARKET Analysis: CONSOLIDATION PhaseOANDA:XAUUSD has made a positive move but faced resistance at $3,430, with strong support established at $3,250. The market is likely to trade sideways or experience a deeper correction in the near term. A major resistance barrier appears to be forming overhead, making further upside difficult without significant catalysts.
These temporary pullbacks may prove beneficial within what appears to be a longer-term uptrend. It is natural for markets to move sideways and form consolidation patterns after the bullish momentum we've witnessed since the beginning of this year. Therefore, sideways consolidation currently represents the healthiest market reaction.
Last year, we observed similar price action where the market made a bullish move from February through April before consolidating for two months. Current price action suggests we may see consolidation in the form of a triangle pattern before a major catalyst fuels the next market move. Overall, I expect the market to continue moving sideways within the April trading range, with the possibility of a deeper correction.
Traders, if you liked this idea or if you have your own opinion about it, write in the comments. I will be glad 👩💻
Bitcoin Potential Continuation To The UpsidesHey Traders, in today's trading session we are monitoring BTCUSDT for a buying opportunity around 100,000 zone, Bitcoin is trading in an uptrend and currently is in a correction phase in which it is approaching the trend at 100,000 support and resistance area.
Trade safe, Joe.

Lingrid | HBARUSDT continuation From the SUPPORT zoneBINANCE:HBARUSDT continues to climb within its upward channel, recently bouncing from the confluence of an upward trendline and prior breakout zone. The structure suggests a bullish continuation pattern is forming, targeting the channel's upper boundary. As long as the price holds above 0.199, bulls retain control with sights on the 0.23 resistance zone.
📌 Key Levels
Support zone: 0.19922 (trendline + previous structure)
Breakout target: 0.23000 (upper channel resistance)
Invalidation level: Below 0.19900 (would break bullish trendline structure)
⚠️ Risks
Breakdown below the blue trendline would weaken momentum
Price may consolidate if buying volume fades
Lower timeframe pullbacks can delay breakout
Traders, if you liked this idea or if you have your own opinion about it, write in the comments. I will be glad 👩💻

Alikze »» AIXBT | Formation of the valley pattern - 4H🔍 Technical analysis: Formation of the valley pattern - 4H
📣 BINANCE:AIXBTUSDT currency is moving in an ascending channel on the 4-hour time frame, which is currently in the supply zone and the middle of the ascending channel.
🟢From a classical perspective, a valley has formed that can break the current supply zone in the green box area by removing liquidity under the previous leg and grow to the next supply zone.
💎 Second scenario: The current supply zone break, depending on the number and frequency of hits to the supply level, can break it and continue its growth to the next supply zone, which is also the ceiling of the ascending channel, and then encounter a correction that, after a pullback to the previous supply zone, continues its path to the next target.
»»»«««»»»«««»»»«««
Please support this idea 💡 with a LIKE 👍 and COMMENT 💬 if you find it useful and Click "Follow" on our profile if you'd like these trade ideas delivered straight to your email 📧 in the future.
Thanks for your continued support.🙏
Best Regards,❤️
Alikze.
»»»«««»»»«««»»»«««

Injective | INJ & AvalonThe price of Injective 8 dollar today with a 24hour trading volume of 69 million dollar. This represents a 13% price increase in the last 24 hours and a 29% price increase in the past 7 days. With a circulating supply of 80 Million INJ, Injective is valued at a market cap of 640 million dollar.
Injective is a blockchain built for finance. It is an open, interoperable layer1 blockchain powering next gen DeFi applications, including decentralized spot and derivatives exchanges, prediction markets, lending protocols..
Injective is upgrading its Avalon mainnet with overwhelming community support. The upgrade aims to enhance L1 scalability, achieve sub-second block generation time, and implement PoS delegation transformation.the upgrade will optimize transaction processing speed, network efficiency, and security within the Injective ecosystem
Inj price is up 400% since we posted the first analysis on January and it tries to recover as fast as possible. most indicators sending a buy signal and the volume looks strong too

Stromm | BITCOIN Are You BULLISH Enough? When you zoom out to the 12-hour chart , Bitcoin actually looks really clean right now. Since my entry at $75,800, we’ve seen a solid 25% rally that’s clearly shifted the momentum back to bullish. -
But even with that move, I’m not fully convinced yet that we’re on our way straight to a new all-time high.
There’s still a lot of work to be done before that happens.
Right now, I’m watching the zone between $96,400 and $102,300 as a potential reaction area — basically a spot where we could see Wave B complete.
We’re hovering around the Yearly Open, which historically acts as both strong support and resistance, and we’re also right at the Previous Monthly High.
If BTC can hold this zone, we absolutely could push higher toward $102K.
However, I don’t think it’s realistic yet to expect a clean shot to $110K without a deeper pullback first.
Most likely, we’ll need another flush lower to reset before any major breakout.
That said, I’m still long and staying patient.
If we do somehow rip toward $120K, I’m already well-positioned.
And if we get another sell-off?
I’ll be adding even more — no hesitation there.
Of course, a lot of this depends on how the political and macro situation evolves.
There’s definitely a world where the perfect narrative gets laid down, and we rocket to $120K.
But there’s also a world where that doesn't happen — and it’s important to stay mentally flexible between "must happen," "could happen," and "might not happen at all."
