Lingrid | XRPUSDT sideways CONSOLIDATION After SUPPORT BounceBINANCE:XRPUSDT market continues to move sideways following its bounce off the support level. Price took liquidity below the psychological level at 2.00 before entering a consolidation phase after the impulse leg. On the weekly timeframe, a bullish long-tailed bar has formed, indicating significant buying pressure at lower levels. Additionally, it formed a false breakout below both February and March lows, further strengthening the bullish case. Consequently, I think the market will continue its upward trajectory. Looking ahead, I expect price to retest the bottom of the consolidation zone, where multiple factors converge: the key 2.00 psychological level, the previous week's low, and the downward trendline. This confluence zone could provide a strong foundation for a rebound if buy signals materialize around these levels. My goal is resistance zone around 2.20
Traders, if you liked this idea or if you have your own opinion about it, write in the comments. I will be glad 👩💻
Signalservice

Lingrid | GOLD Weekly OUTLOOK: strong UPTREND with RetracementsOANDA:XAUUSD continues its bullish momentum, closing another week up approximately 3.5%, primarily driven by Wednesday's breakout candle that pushed above the previous week's high. Following this strong upward movement, we've observed a period of retracement that manifested as a pinbar formation on the 4H timeframe. While this candlestick pattern typically signals continuation, the market's hesitation to move higher suggests a deeper pullback may be ahead. At current price levels, we're likely to see the formation of a continuation pattern, potentially a triangle that could provide an excellent entry opportunity.
Looking lower timeframes reveals the potential development of an ABC pullback, which would strongly indicate another bullish move upon completion. On the daily timeframe, this retracement will likely take the form of an inside bar candlestick pattern—a formation traditionally associated with trend continuation when traded in the direction of the prevailing trend. Despite these short-term fluctuations, the bullish trend remains firmly intact, supported by ongoing geopolitical tensions, uncertainty surrounding central bank policies, and sustained physical demand from Asian markets.
Traders, if you liked this idea or if you have your own opinion about it, write in the comments. I will be glad 👩💻

Gold Hits New ATH Again: Is the Bull Run Unstoppable?After printing a new All-Time High on April 17, Gold entered a brief correction that ended on April 18 at 3285. However, the daily candle closed strong at 3327, right before the long Easter weekend.
Fast forward to Monday's ASIA session open, Gold showed no hesitation and pushed into yet another ATH at 3384.
The bullish momentum is so aggressive that it feels like nothing can stop this trend. While I do expect heavy volatility going forward, the core strategy remains clear:
👉 Buy the dips.
Key Level to Watch:
📍 First support zone = 3350
At this level, I will actively look for long entries, targeting a potential new ATH later this week.
Disclosure: I am part of Trade Nation's Influencer program and receive a monthly fee for using their TradingView charts in my analyses and educational articles.

Long-term bullish breakout on EUR/USD!Hey traders,
Let’s dive into some weekly price action on EUR/USD and uncover what the charts are really telling us. 📈
🔍 Key observations (weekly Chart):
Major breakout:
Two weeks ago, EUR/USD printed a strong bullish candle that broke and closed above a critical resistance zone, the July 2023 high and September 2024 high.
➡️ This marks a bullish structural shift on the higher timeframe.
Bullish inside bar:
Last week's candle was also bullish but formed an inside bar, closing within the previous candle’s range and failing to break the high.
➡️ This suggests consolidation, not rejection.
🧠 What it means:
✅ The break above multi-month highs signals strength and long-term bullish momentum.
✅ The inside bar can be viewed as a pause or healthy retest rather than weakness.
✅ Likely, price is accumulating orders before a new push higher.
📅 Weekly bias: bullish continuation
Here’s why:
The break and close above key structure is a big deal.
Consolidation after such a breakout is normal and often precedes continuation.
As long as price stays above the broken highs, the bias is firmly bullish.
🔔 What to watch next:
✅ A break and close above last week's high = strong bullish continuation signal.
🔁 A dip into the broken resistance (now support) + bullish rejection = a solid buy opportunity.
⚖️ There’s a price imbalance just below last week’s low, price could dip into it before taking off again.
💬 Final thoughts:
The long-term trend is shifting. This is not the time to fade strength, but rather to look for high-probability entries on pullbacks.
📢 If this breakdown helped you, don’t forget to boost the idea and follow for more weekly updates!

Lingrid | GOLD potential Trend Continuation FormationsOANDA:XAUUSD market pulled back as expected and retested 50% of the previous daily range. The market is forming bullish flag pattern or triangle pattern which are both trend continuation formations. If the price breaks above, it may trigger more upward pressure pushing price toward the channel border. Furthermore, on the 4H timeframe a pinbar candlestick pattern was formed suggesting the price may establish new all time highs. Considering that we don't have high impact news today, the price may move sideways closing Friday candle near previous day high. My goal is resistance zone around 3380
Traders, if you liked this idea or if you have your own opinion about it, write in the comments. I will be glad 👩💻

Lingrid | GBPJPY short-term BULLISH move from the SUPPORTThe price perfectly fulfilled my last idea . FX:GBPJPY price is making higher low and higher highs showing bullish trend on the 1H timeframe. The market seems to be moving sideways below the psychological level at 190.000, which means that the market may retest the zone above it because the prices tend to consolidate at key levels before the breakout. Furthermore, the price moved above the previous month's low after massive sell off in the market. I think the price may spike upward to retest the trendline and previous week high. My goal is resistance zone around 190.000
Traders, if you liked this idea or if you have your own opinion about it, write in the comments. I will be glad 👩💻

Lingrid | TONUSDT Signs of REVERSAL at KEY Demand Zone OKX:TONUSDT market continues to consolidate after the sell off in the market. However, the market currently sits at the demand zone and it's giving signs of potential reversal. The price is in the accumulation phase around the 3.00 level. The price has decelerated at this zone followed by bullish divergence meaning more buyers are stepping in. The market has twice respected the 2.70 - 2.80 support zone with the last 2 monthly candles testing and closing above it. I expect the market to move to higher levels if the price does not drop due to sudden negative news. This accumulation pattern at key technical support suggests patient buyers may soon be rewarded. My goal is resistance zone around 3.450
Traders, if you liked this idea or if you have your own opinion about it, write in the comments. I will be glad 👩💻

Lingrid | GOLD new All-Time HIGHS with Potential PULLBACK TradeThe price has perfectly fulfilled my previous forecast . OANDA:XAUUSD market has established another new all-time high and continues pushing toward higher levels. The price has now reached a resistance zone at 3300, potentially marking an area where we might see a rollback—creating an opportunity to go long. The price has formed a range zone around the 3225 level, and this support might serve as an optimal area to look for buy signals. Furthermore, an upward trendline sits below this range, having previously acted as both support and resistance. Given today's scheduled high-impact news, we should anticipate increased market volatility. My goal is resistance zone around 3390
Traders, if you liked this idea or if you have your own opinion about it, write in the comments. I will be glad 👩💻

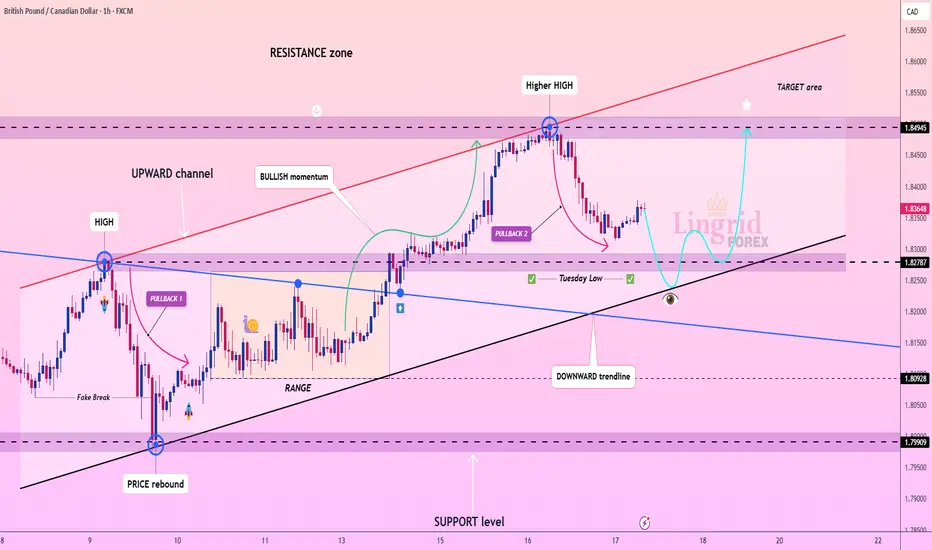
Lingrid | GBPCAD pullback Creating BULLISH Opportunity FX:GBPCAD market is pulling back after making higher highs. On the current timeframe the market is bullish as well as on the daily timeframe. The price is heading toward the psychological level at 1.83000 and possibly lower border of the upward channel. If the price retests the support level and Tuesday's low, this would be the best zone to consider to go long. I think the market will continue pushing to higher levels since the price cleared the area above the previous week's high.
Traders, if you liked this idea or if you have your own opinion about it, write in the comments. I will be glad 👩💻
Lingrid | TRXUSDT bullish STRUCTURE with Potential ENTRY Zone The price perfectly fulfilled my last idea . It hit the target level. BINANCE:TRXUSDT is showing a strong bullish momentum making higher lows and higher highs. On the daily timeframe, the market is rolling back after forming higher highs. There's a possibility that the price might pull back toward the support level, dipping below the psychological round number at 0.240. I think if the price rejects the upward trendline, weekly high and support level there is great chance of trend continuation. This correction might provide an opportunity for buyers to enter, with the potential for the price to retest the recent higher high level afterwards. 📈 Keep an eye on these key levels for optimal entry points. My goal is resistance zone around 0.2530
Traders, if you liked this idea or if you have your own opinion about it, write in the comments. I will be glad 👩💻

Lingrid | EURNZD market at CONFLUENCE zone. Potential LongFX:EURNZD has completed an ABC pullback toward the support level and channel border. The market recently bounced off the psychological level at 1.91000, demonstrating potential strength at this key zone. On higher timeframes, the price continues to make higher highs and higher closes, indicating clear bullish dominance in the longer-term perspective. However, the recent pullback suggests we may enter a consolidation phase rather than an immediate continuation of the uptrend. Despite this, I expect the price to retest at least 50% of the pullback range and possibly reach even higher levels. If the price maintains position above the channel border and support zone between 1.9000-1.9100, there's a high probability of upward movement resuming. My goal is resistance zone around 1.96700
Traders, if you liked this idea or if you have your own opinion about it, write in the comments. I will be glad 👩💻

Lingrid | BNBUSDT buying OPPORTUNITY from SUPPORT ZoneBINANCE:BNBUSDT bounced off the support level at 560. This represents a significant swap zone where price has respected historical levels multiple times. Currently, the market is pulling back from the downward trendline toward this established support zone. On the weekly timeframe, the price has formed a bullish candle, while on the daily timeframe, the market has established higher lows, suggesting increasing buying pressure. If the price reaches the support zone around 550-560, there is a strong probability of a bounce off that level, potentially initiating a bullish move. Given the technical indicators across multiple timeframes and the historical significance of this support zone, this presents a optimal area of interest for market participants. My goal is resistance zone around 613.
Traders, if you liked this idea or if you have your own opinion about it, write in the comments. I will be glad 👩💻

ETHUSDT: No Bottom yet, Bears still in control?Hey Realistic Traders, is ETHUSDT just a dead cat bounce, or are we looking at an actual reversal? Let’s dive in...
Since March 26, 2025, ETHUSDT has struggled to break above the EMA100 line, signaling a bearish trend. Additionally, a symmetrical triangle pattern has broken to the downside, further confirming bearish momentum.
The Stochastic indicator has crossed and is moving downward within the neutral zone, confirming that selling pressure may continue.
These signals indicate that Ethereum could drop toward our first target at $1,403. After hitting this level, a short pullback is likely as traders take profits, before the price potentially continues its descent toward a new low around $1,239.
These targets were identified using a combination of Fibonacci ratios and classic support/resistance levels, as shown in the chart.
This outlook remains valid as long as the price moves below the stop-loss level at 1,754.
Support the channel by engaging with the content, using the rocket button, and sharing your opinions in the comments below.
Disclaimer: "Please note that this analysis is solely for educational purposes and should not be considered a recommendation to take a long or short position on Ethereum.

Lingrid | EURUSD bullish MOMENTUM Testing KEY Resistance LevelThe price perfectly fulfilled my previous idea . It reached the target zone. FX:EURUSD formed a massive bullish weekly candle, representing an impulse leg on lower timeframes. The market broke and closed above the 2023 high and is now testing the 2022 high. On the 1H timeframe, the market is likely to create an ABC pullback toward the support level and upward trendline. I think the price may continue moving sideways since consolidation phases typically follow impulse legs. If the price rejects the support level below, we can expect the market to move higher. This consolidation would be a natural breathing period after the strong upward movement before potentially continuing the bullish trend. My goal is resistance zone around 1.15000
Traders, if you liked this idea or if you have your own opinion about it, write in the comments. I will be glad 👩💻

Lingrid | GOLD sideways CONSOLIDATION with BULLISH PotentialAs expected, OANDA:XAUUSD price continues to move sideways after the bullish momentum in the market. The price is still trading within the Friday and Monday range zone. The market may consolidate for a couple of days, however, if the market pulls back below the last 2 days' low and upward trendline, I think there is a great chance of price rebound and further upward move. Another scenario is triangle formation or rising wedge pattern near the current resistance zone. Despite this, I expect the price to rebound from the support level around 3170-3180 then continuation. Watch these key levels closely for confirmation of the next directional move. My goal is resistance zone around 3285
Traders, if you liked this idea or if you have your own opinion about it, write in the comments. I will be glad 👩💻

Lingrid | AUDJPY pullback After the BEARISH MomentumThe price perfectly fulfilled my last idea . It reached the target zone. FX:AUDJPY market is approaching a test of the previous month's low. Prior to this movement, price formed a triangle pattern, then broke below it and an upward trendline, creating a bearish impulse leg. This current pullback may present a shorting opportunity if we receive a sell signal, especially considering that on the daily timeframe the market remains bearish. This potential setup would be further confirmed if the price forms a fake break of the previous week's high. Overall, I expect the price to move lower, ultimately breaking below the support level at 90.000. My goal is supprot zone around 88.510
Traders, if you liked this idea or if you have your own opinion about it, write in the comments. I will be glad 👩💻

Lingrid | LINKUSDT potential BULLISH Reversal at the SUPPORTBINANCE:LINKUSDT market made a fake break of the March low then bounced off strongly. The market took liquidity below the psychological level at 10.00 before recovering. Furthermore, the market broke and closed above the downward trendline that represented correction. The market also tested the demand zone where price skyrocketed from in November 2024. I think if the price pulls back toward the support level and trendline, I expect the price to move higher because previously we saw price rebound from this level before. This false breakdown pattern, combined with the trendline break and test of a historic demand zone, sets up a potentially significant bullish reversal opportunity if support continues to hold. My goal is rsistance zone around 14.80
Traders, if you liked this idea or if you have your own opinion about it, write in the comments. I will be glad 👩💻

Lingrid | GOLD Weekly ANALYSIS: UNPRECEDENTED Rally ContinuesOANDA:XAUUSD market continues pushing to higher and higher levels. The market went up approximately 7% in a single week. This was a big upward move, if not the biggest upward move in one week this year. As the market approaches the 3250 level, we can see some price deceleration. This may lead to a corrective move. After such an impulse move, the market usually consolidates. Therefore Monday and Tuesday might be sideways move days.
On the daily timeframe, the price is creating an ABC move which potentially completes around the 3300 level. If Monday's candle opens with a gap up, this suggests the price may surge again. However, if we get a pullback, then we can look for buying opportunities below the 3200 support level or the previous day's low.
Traders, if you liked this idea or if you have your own opinion about it, write in the comments. I will be glad 👩💻

Lingrid | BTCUSD Consolidation PHASE Following Double Bottom BINANCE:BTCUSDT market formed a double bottom below March levels before bouncing to close above the psychological 80,000 mark. Price action is currently narrowing, suggesting the market is coiling up before its next extension—as if awaiting another news catalyst to drive movement. Given that the price closed above the swap zone, any pullback to this level presents a high probability of a price rebound. Additionally, on the daily timeframe, the market has broken and closed above the downward trendline that represented the correction phase.
Overall, I expect a potential triangle pattern formation around current levels before a surge higher toward liquidity above the previous week's high. My goal is resistance zone around 89,300
Traders, if you liked this idea or if you have your own opinion about it, write in the comments. I will be glad 👩💻

Lingrid | SUIUSDT trend CONTINUATION Pattern In The MARKETThe price perfectly fulfills my last idea . BINANCE:SUIUSDT market bounced off the key support level at 2.00 and then broke and closed above the triangle pattern as well as the trendline. Additionally, the market made a fake breakout of the previous month's low before heading toward the next resistance zone by making higher highs and higher lows. Recently, the market broke the downward trendline, and I believe the price may rise further if it remains above the support zone at 2.20. I expect the price to continue moving higher, as we are seeing a contraction-expansion price action pattern. My goal is resistance zone around 2.4685
Traders, if you liked this idea or if you have your own opinion about it, write in the comments. I will be glad 👩💻

GBPUSD BIG DROP ?Market Structure Overview
Previous Trend: Strong bullish move after a long bearish trend.
Current Behavior: Price has entered a higher-timeframe supply zone (highlighted in green) and is showing signs of rejection.
Supply Zones:
Major Supply: 1.31750 – 1.32000
Minor Supply: 1.31000 – 1.31300
Demand Zones:
First Demand Zone: ~1.30380
Second Demand Zone: ~1.29919
📉 Trade Setup & Plan
🅰️ Primary Bias: Bearish Rejection from Supply
🔹 Scenario 1: Ideal Short Setup
Entry: Around current price (~1.30824) or after a retest of the 1.31000–1.31300 zone.
TP1: 1.30380 (first demand zone)
TP2: 1.29919 (second demand zone)
TP3 (extension): Below 1.29000 if momentum continues
SL: Above 1.31300 (to avoid fakeouts in supply)
🧩 Reasoning:
Price failed to break above supply with strong rejection wicks.
Break of structure + liquidity taken above local highs = possible start of bearish leg.
🔹 Scenario 2: Pullback Before Continuation Lower
Wait for Break of 1.30380, then look for pullback entries (break & retest).
Entry: On bearish confirmation after price retests 1.30380 zone from below.
TP: 1.29919, and if broken, continue to trail toward 1.2900s
✅ Extra Notes
Watch for rejection patterns (e.g., pin bars, engulfing candles) on the 15M or 30M to confirm entries.
Avoid entries during high-impact news, especially UK or US CPI, interest rate decisions, or NFP.
Manage risk wisely: Max 1-2% per trade.

Lingrid | GOLD bullish MOMENTUM Continues. Pullback OpportunityThe price has perfectly fulfilled my previous forecast . OANDA:XAUUSD market surged straight up and reached the resistance level at 3200 without any pullback. Additionally, the price broke and closed above last week's high, confirming bullish continuation. As the market tests this key level, we may see increased volatility in this area considering that we have high-impact news in the NY session. The price seems to be decelerating at the channel border, which suggests there might be a corrective move in the market. If the price makes a pullback toward the support level, there is a strong opportunity to go long, with the potential for the price to continue moving upwards. My goal is resistance zone around 3275
Traders, if you liked this idea or if you have your own opinion about it, write in the comments. I will be glad 👩💻

Lingrid | EURUSD potential Short-Term PULLBACK from 2022 HighThe price perfectly fulfilled my previous idea . It hit the take profit. FX:EURUSD market is making higher highs, showing bullish momentum. Also the price broke and closed above the consolidation zone. However, on the daily timeframe, the price is forming an ABC move where point C completes at the psychological level of 1.15000. After the completion of this move, a pullback typically follows. Furthermore, this resistance zone represents the high of 2022, and I believe there may be liquidity above which could lead to a rollover. If we see rejection at this level, we can expect a short-term pullback. My goal is support zone around 1.12700
Traders, if you liked this idea or if you have your own opinion about it, write in the comments. I will be glad 👩💻
