COOKIEUSDT(COOKIEDAO) Updated till 04-02-25COOKIEUSDT(COOKIEDAO) Daily timeframe range. fairly new PA here. so we got several opportunity for nice setups. buyers needs to defend 0.1478 or it will go back to price discovery. its a empty void below there. recent resistance at 0.2740.
Signalservice

Lingrid | GOLD Weekly PRICE Action ANALYSISOANDA:XAUUSD reached an all-time high this week, testing the zone above 2800 and maintaining an upward trajectory, as I noted in my last weekly post. January candle closed strongly above the 2024 high, indicating a strong bullish momentum in the market. Any pullback at this stage could present a prime opportunity to go long, if this doesn't turn out to be a false breakout of last year's high.
However, on the daily timeframe, the formation of a long-tailed bar suggests a potential rejection at this resistance level, indicating the possibility of a pullback. Additionally, on the weekly timeframe, we can observe a closing below the psychological level of 2800 and weekly candle tail, which hints at potential selling pressure above. Overall, I anticipate the market to continue bullish movement, potentially reaching resistance zone of 2830-2850, which seems achievable unless the price action indicates otherwise.
Traders, if you liked this idea or if you have your own opinion about it, write in the comments. I will be glad 👩💻

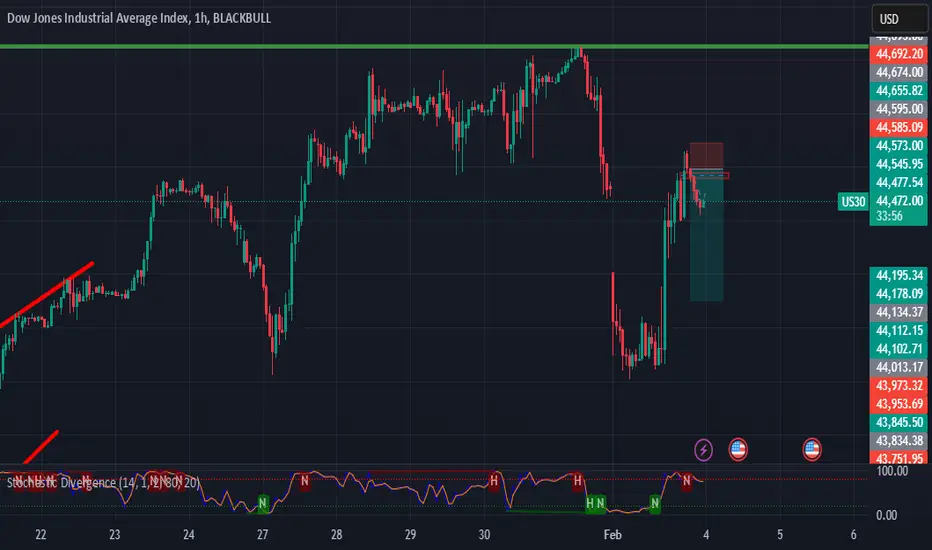
Market Analysis for US30 (Sell)US30 has broken through the fair value gap, confirming a strong bearish momentum and aligning perfectly with our trading strategy. This setup indicates a market imbalance correction, creating an optimal sell opportunity. With price action showing rejection from key resistance levels, we anticipate further downside movement. Stops are placed above the FVG for risk control, and targets are set at the next support zone. This is a textbook example of our strategic approach to capitalizing on market inefficiencies.
Market Analysis for nas100 (Sell)nas100 has broken through the fair value gap, confirming a strong bearish momentum and aligning perfectly with our trading strategy. This setup indicates a market imbalance correction, creating an optimal sell opportunity. With price action showing rejection from key resistance levels, we anticipate further downside movement. Stops are placed above the FVG for risk control, and targets are set at the next support zone. This is a textbook example of our strategic approach to capitalizing on market inefficiencies.

XAUUSD Gold: After correction, a new ATH?The XAUUSD rose to a high of 2786 on Friday, only 30 pip down than the previous all-time high (ATH).
Bulls may be able to enter the market at more advantageous times because the price is currently in a correction phase.
The area around 2740 is a key confluence support and may be a desirable entry point. The end of the correction and the possibility of a new ATH would be signaled by a reversal from this region and a break back above 2760.
However, the positive view would be halted and caution would be advised going forward if the daily close fell below 2740.

Gold remains bullish, but watch closely 2770 zoneLast week, gold reached a new all-time high of 2,815. However, profit-taking on Friday led to a weekly close below the key 2,800 level.
A few hours ago, as the new week opened, the correction continued, but the price is now starting to recover.
Despite this pullback, the overall trend remains bullish. The key support zone for buyers is between 2,765 and 2,770.
As long as this zone holds, the strategy remains to buy on dips.

Lingrid | EURUSD Gaps Down. Short Opportunity The price perfectly fulfilled my last idea. It hit the target level. The February candle opened with a significant gap. Typically, when a gap occurs, the price tends to fill that gap, and this time may be no exception. If FX:EURUSD does fill the gap, it could present an opportunity to short the market. Given that the market opened near the previous month's low, I believe it may consolidate above that level before moving lower or filling the gap and then continuing its downward movement. It seems likely that the price will form a range zone during this time. I expect the market to at least retest the previous monthly low and the area below it. My goal is support zone around 1.01300
Traders, if you liked this idea or if you have your own opinion about it, write in the comments. I will be glad 👩💻

Lingrid | BTCUSDT decline Continues amid BEAR pressureThe price perfectly fulfilled my last idea. It hit the target level. BINANCE:BTCUSDT is currently making a downward move, breaking and closing below the key level of 100,000 and cosolidation zone. The price also broke and close below the upward channel, which indicates a shift in momentum. If we zoom out we can see that it continues to test the area above the 90,000 level, and it may soon move below this zone. Overall, aftert bullish move in November the sideways movement persists, and I expect that the market could dip below the January low. My goal is support zone around 89,000
Traders, if you liked this idea or if you have your own opinion about it, write in the comments. I will be glad 👩💻

Lingrid | GOLD Possible Short-Term PULLBACK from KEY ResistanceThe price perfectly fulfills my last idea. It reached the target level. OANDA:XAUUSD market moved above the previous year's high and reached the psychological level at 2800, confirming the expectation from yesterday. Currently, the price is moving sideways at this resistance zone, and it's possible that we may see a short-term pullback in this area, despite the daily timeframe showing a close above the previous ATH. With upcoming high-impact news, it's essential to remain vigilant. I expect the price to continue consolidating at this level, likely trading between 2770 and 2800, especially as we approach the monthly close. This consolidation may lead to further volatility once the market reacts to the news. My goal is support zone 2775
Traders, if you liked this idea or if you have your own opinion about it, write in the comments. I will be glad 👩💻

Lingrid | NZDJPY price CORRECTION. Short TRADE OpportunityFX:NZDJPY market has pulled back after retesting the support level, but overall the price is making lower lows and lower closes, indicating bearish dominance. The recent pullback against the major trend presents an opportunity to short the market. The price is currently testing the consolidation zone, which often acts as both support and resistance, and I expect the price to drop from this resistance zone and also from the upward trendline. My goal is support zone around 86.800
Traders, if you liked this idea or if you have your own opinion about it, write in the comments. I will be glad 👩💻

Lingrid | TONUSDT bearish PRESSURE. Possible ShortRecently the crypto market experienced a short-term selloff, but was able to recover and gain bullish momentum. However, OKX:TONUSDT has deviated from this trend, as it continues to form lower highs without creating significant bullish momentum. Furthermore, it has broken and closed below the psychologically important level of 5.00, which suggests bearish pressure. On the weekly timeframe, TON has formed a bearish pinbar, indicating selling pressure, and may retest lower levels as a result. I expect the price to move support zone at 4.00. My goal is support zone around 4.430
Traders, if you liked this idea or if you have your own opinion about it, write in the comments. I will be glad 👩💻

Lingrid | EURUSD resistance ZONE Rejection. Potential SHORTFX:EURUSD market pulled back towards the support level, only to surge above the previous week's high before reversing course. This sudden move effectively rejected the psychological level of 1.0500. Furthermore, the market broke and closed below the upward trendline, a that support the price for 2 weeks. Given the high-impact news scheduled for today, we can anticipate some increased volatility and potential spikes. In light of this, I believe the market will retest the resistance zone, paving the way for a bearish move. My goal is support zone around 1.03425
Traders, if you liked this idea or if you have your own opinion about it, write in the comments. I will be glad 👩💻

Bitcoin- Something is Rotten in Denmark- Cause of Concern?In my previous BTC analysis, I mentioned that "it's about time for the price to do something" and highlighted that a breakout above 107k could trigger accelerated upward momentum, potentially leading to a significant new all-time high with a measured target in the 130K zone.
However, following days of low volatility, Bitcoin has started to decline instead of breaking through the resistance.
Overall, the situation is starting to look unfavorable. Despite the positive news surrounding crypto marklet, Bitcoin's inability to break resistance and reach a new ATH is anything but bullish.
From a technical perspective, as of now, the price is hovering just above a local support level.
If this level breaks, it could once again expose the 90K confluence support. Given the current conditions, this seems like the most likely scenario.
In my opinion, if you’re a speculator, the best approach right now is to stay on the sidelines and observe how the market develops.

Dogecoin: Trading What You See, Not What You Hope ForThe crypto world is buzzing about the acronym D.O.G.E., with many hoping this hype will ignite a massive price explosion for Dogecoin.
However, the market has repeatedly failed to deliver. In fact, every rally this year has been met with heavy selling.
As I often say, " trade what you see, not what you dream of ." And from a purely technical perspective, what I see for Dogecoin right now doesn’t look promising.
A Look Back: The Trump Pump and the Aftermath
Dogecoin experienced a massive pump last year, fueled by Trump’s presidential election win. But after the initial euphoria, the market cooled down, and Dogecoin entered a correction phase.
Leading up to Christmas, the price even temporarily dipped below the horizontal support level at $0.35. While the start of 2025 brought a recovery above this support, bulls have struggled to maintain their gains.
The Current State of Dogecoin
Even the brief spike two days ago, which initially looked promising, was quickly reversed. As of now, Dogecoin has returned to this critical $0.35 support line, showing continued weakness.
What’s Next?
Given the current price action, my expectation is that this support will eventually give way. If that happens, we could see Dogecoin drop to around $0.26, a level that might offer stronger support.
The Bottom Line
Dogecoin’s technicals suggest caution, not optimism. While the D.O.G.E. hype might tempt some into dreaming of another rally, the charts tell a different story. If you’re trading Dogecoin, stay focused on the reality of the price action and be prepared for potential downside.
As always, trade wisely and stick to the facts, not the fantasies.

Lingrid | TRXUSDT continues to MOVE Sideways in the RANGEBINANCE:TRXUSDT market is currently making higher highs and higher lows. However, it continues to oscililate around the key level at 0.2500. On the weekly timeframe, the price action is within a consolidating zone, meaning it is trading within the previous weekly range. As the price has now reached the top of this consolidation zone, there is a potential for a reversal. Given this context, I expect the market to move lower from this level, as it hits resistance at the top of the consolidation zone and channel border. My goal is support level at 0.2450
Traders, if you liked this idea or if you have your own opinion about it, write in the comments. I will be glad 👩💻

ARPAUSDT(ARPAChain) Updated till 02-02-25ARPAUSDT(ARPAChain) Daily timeframe range. alltho many things are dumping its still holding on to its level. and tried to get through 0.05405. but sadly volume is still not there. to further move it needs volume. recent support at 0.03973.

Lingrid | GOLD Weekly Market Technical AnalysisOANDA:XAUUSD market closed above the November high. On the weekly timeframe, we see four bullish candles, with last week showing acceleration as the price approached the resistance zone. When testing this zone, the price did not react sharply, indicating that sellers may not be ready to act in this area.
On the weekly chart, we have a strong close with a bullish candle with small wicks. However, the daily timeframe presents a slightly different picture: the price tested the resistance zone and then pulled back, forming a tail on the daily candle which suggests a potential shor term roll back. Nevertheless, it failed to close below the November low, demonstrating bullish strength.
With the Federal Funds Rate decision scheduled for next week, the market may move sideways at this level until Wednesday. It appears that the price has reached this level in preparation for a potential move either up or down, depending on the economic data that is released. Overall, I expect the market to trend higher following this pullback.
Traders, if you liked this idea or if you have your own opinion about it, write in the comments. I will be glad 👩💻

QTUMUSDT(Quantum) Updated till 01-02-25QTUMUSDT(Quantum) Daily timeframe range. we can see a nice push here. tried to break through 4.564. but bag holders took out profit at 4.564 so buyers needs to hold above 3.529 to continue the push. PA holding on its midrange decently for a while now.

Gold- New ATH after correction?On Friday, FOREXCOM:XAUUSD climbed to a high of 2786, just 30 pips below the previous all-time high (ATH).
Currently, the price is in a corrective phase, which could present an opportunity for bulls to enter the market at more favorable levels.
Key confluence support lies around the 2740 zone, which could serve as an attractive entry point. A reversal from this area, followed by a break back above 2760, would indicate the end of the correction and signal the potential for a new ATH.
However, a daily close below 2740 would halt the bullish outlook and suggest caution moving forward.

Lingrid | GOLD anticipating VOLATILITY on FEDs Rate dayThe price perfectly fulfilled my previous idea. It almost reached the target. OANDA:XAUUSD bounced off the swap zone and is moving toward the resistance zone. With the FED rate decision today, we can expect increased volatility in the markets. On the daily timeframe, the price has formed an inside bar pattern. A breakout above the Monday high or below the Monday low is likely to determine the next move. I anticipate that today could see significant swings, and I expect the price to move higher, potentially testing the all-time high level. If the price closes above 2790, we could see a continuation of the current trend. Conversely, if the price forms a false breakout of the resistance zone, we may experience some sell-offs in the market. Overall, I expect the price to move toward the liquidity above the ATH level. My goal is resistance zone around 2800
Traders, if you liked this idea or if you have your own opinion about it, write in the comments. I will be glad 👩💻

Hellena | GOLD (4H): LONG to 161.8% Fibo lvl (2797.968).This month it is extremely difficult to predict the movement of gold, because there are too strong processes in the world, which no one expects.
But I will always try and will not give up drawing waves, because it brings profit and valuable experience.
In this case, I see a continuation of the upward movement to the area of 161.8% Fibonacci extension level. This is the area of 2797.968.
Of course, I would like the price to first descend on the correction in wave “2” and reach the support area 2724, after which limit pending orders will be activated.
Manage your capital correctly and competently! Only enter trades based on reliable patterns!

Hellena | SPX500 (4H): SHORT to the low of wave “a” 5920.Colleagues, the price reached the 5920 level too quickly, so I tend to believe that wave “2” is not completed. It should consist of 3 waves “abc” so I expect the low of wave “a” 5920 to be updated.
Manage your capital correctly and competently! Only enter trades based on reliable patterns!

Lingrid | SUIUSDT potential Trend REVERSAL. Long from SUPPORTBYBIT:SUIUSDT market retraced to the support level before rebounding, having taken liquidity from below the psychological level of 4.00. This move was also accompanied by a fake breakout of the previous week's low, indicating a potential reversal in sentiment. On the daily timeframe, a clear long-tailed bar formed at the support level, signaling rejection and a bullish sign. Looking left, we can see that the price has bounced off this support level twice before highlighting it as an area of interest. I anticipate that the price will continue to rise from this area. My goal is resistance zone around 4.60
Traders, if you liked this idea or if you have your own opinion about it, write in the comments. I will be glad 👩💻
