Gold Next Move Possible Hello Traders, Today I’m back with another idea.
As you know gold has changed the trend from bullish to the bearish.
The gold has fallen from the area 3438 to 3351. Now the current price is 3358.
I’m looking for the sell zone, In my view gold will drop till 3310.
I’m monitoring the sell zone 3364-3371, when the market touches the zone, I will add sell and my target will be 3310. Keep in bear my first target is 3351, second target is 3337 and the last target is 3310.
In the case if price breaks the 3377 area then we will have to wait until confirmation for another setup.
Stay Tune for every update.
Kindly share your ideas and leave positive comments. Thanks Everybody.
Signalsprovider

Lingrid | GOLD shorting Opportunity at Confluence ZoneThe price perfectly fulfilled my previous idea . OANDA:XAUUSD broke down sharply after forming a local top at the 3433 resistance zone, with clear bearish momentum dominating recent candles. Price is now consolidating below the broken trendline and previous structure at 3349, setting up for a possible retest and rejection. If price confirms rejection under this resistance, continuation toward the 3288 support area becomes highly likely. A lower high formation below the blue upward trendline would validate the bearish thesis.
📉 Key Levels
Sell trigger: Rejection near 3349–3350
Sell zone: 3345–3355
Target: 3288
Invalidation: Break above 3355 and trendline recovery
💡 Risks
Sudden bullish breakout could reclaim upward trendline
Support near 3288 may create a rebound
Thin liquidity could exaggerate short-term wicks
If this idea resonates with you or you have your own opinion, traders, hit the comments. I’m excited to read your thoughts!

Lingrid | SUIUSDT Approaching Key Level for Potential LongBINANCE:SUIUSDT has pulled back from the 4.44 resistance but remains within a well-defined upward channel, holding above the 3.60 support zone. The structure shows higher lows with price hovering around the blue upward trendline, indicating ongoing bullish momentum. As long as 3.60 holds, buyers may regain control and push price back toward the 4.44 resistance and beyond. Momentum favors continuation as the consolidation phase near support suggests accumulation.
📉 Key Levels
Buy trigger: Break and close above 3.85
Buy zone: 3.60–3.70
Target: 4.44
Invalidation: Drop below 3.26
💡 Risks
Failure to hold above 3.26 could trigger deeper pullback.
Resistance near 4.44 may cause rejection.
Low market volume could delay breakout attempts.
If this idea resonates with you or you have your own opinion, traders, hit the comments. I’m excited to read your thoughts!
Lingrid | HYPEUSDT Potential Continuation After PullbackKUCOIN:HYPEUSDT is bouncing from a higher low near the 42.070 zone after breaking a descending flag pattern. Price action remains above the ascending support trendline while pressing into a key structure retest. As long as GETTEX:HYPE stays above 42, a bullish leg toward the 49.700 resistance remains likely. Structure suggests a resumption of the impulse phase within the broader uptrend.
📉 Key Levels
Buy trigger: Clean breakout above 45.00
Buy zone: 41.5 – 43.0 (support + flag bottom)
Target: 49.700
Invalidation: Close below 40.00
💡 Risks
Breakdown below the ascending support would weaken the bullish setup
Failure to reclaim mid-flag resistance may lead to deeper consolidation
Broader market weakness in altcoins could delay breakout momentum
If this idea resonates with you or you have your own opinion, traders, hit the comments. I’m excited to read your thoughts!

Lingrid | USDJPY Potential Channel Breakout. LongFX:USDJPY is retesting the breakout zone after reclaiming support from a prior swap area near 146.9. Price action has broken above a downward trendline and is forming a bullish retest structure. As long as USDJPY holds above 146.920 zone, the setup favors a continuation toward the resistance barrier. A breakout above the red descending trendline could accelerate upside momentum.
📉 Key Levels
Buy trigger: Break and hold above 147.500
Buy zone: 146.900 – 147.000
Target: 148.250
Invalidation: Break below 146.000
💡 Risks
Failure to break the descending red trendline may trigger renewed selling
Consolidation below resistance could signal buyer exhaustion
Break below 146.000 would invalidate bullish retest setup
If this idea resonates with you or you have your own opinion, traders, hit the comments. I’m excited to read your thoughts!

Lingrid | BTCUSDT Range-Bound Market: Short-Term Bearish MoveBINANCE:BTCUSDT has failed to break through the descending resistance near 120,000 and is now forming a lower high within the broader resistance zone. The price action follows an impulsive leg up and is currently tracing a potential reversal pattern under key structural resistance. As long as the market remains capped below 120,000, continuation toward 117,500 is likely. The downward bias is supported by weakening momentum after the bull trap and resistance rejection.
📉 Key Levels
Sell trigger: Breakdown below 119,000
Sell zone: 119,400 – 120,000
Target: 117,500
Invalidation: Break and close above 120,500
💡 Risks
Sudden bounce from the 119,000 handle could trap late sellers
Breakout above 120,000 would shift structure to bullish
Support near 117,500 may slow or reverse bearish pressure
If this idea resonates with you or you have your own opinion, traders, hit the comments. I’m excited to read your thoughts!

Lingrid | AVAXUSDT Corrective Move In The MarketThe price perfectly fulfilled my previous idea . BINANCE:AVAXUSDT retraced sharply from the 27.34 resistance zone after making a higher high but found support above the descending trendline. The recent corrective move has paused at a key structure level near 24.96, hinting at potential bullish continuation. A breakout above this local resistance could trigger a rally toward the 26.50–27.34 target zone. Momentum builds as long as price remains above the trendline and higher low structure.
📈 Key Levels
Buy zone: 24.80 – 25.30
Buy trigger: Break and hold above 25.30
Target: 26.50
Invalidation: Close below 24.00
💡 Risks
Downward trendline still active and could act as resistance
Potential for bearish fakeout before breakout
Failure to reclaim 25.30 quickly weakens bullish scenario
If this idea resonates with you or you have your own opinion, traders, hit the comments. I’m excited to read your thoughts!

Lingrid | GOLD Weekly Market Outlook: Resistance Zone RejectionOANDA:XAUUSD markets have encountered significant resistance at the $3,450 level, resulting in a notable rejection and subsequent pullback toward support zones. The precious metal is now testing critical technical levels that will determine whether the broader bullish momentum can be sustained or if deeper correction is imminent.
The 4H chart reveals a clear level rejection at the resistance zone, followed by an impulse leg lower that has broken the upward trendline. This development suggests a potential shift in short-term momentum, with gold now trading within the consolidation zone between $3,365 and $3,285. The break of the ascending trendline is particularly significant, indicating that bulls may be losing control of the immediate price action.
The second chart provides valuable context with the weekly and 16-hour timeframe analysis. The pinbar rejection candle on the weekly chart confirms strong selling pressure at these elevated levels. The 16-hour chart shows multiple tests of the upward trendline, with the recent break potentially signaling a bearish impulse leg. However, the overall structure remains within the broader ascending channel, suggesting this could be a healthy correction within the long-term uptrend.
Critical levels to monitor include the $3,285 support zone and the broken trendline at $3,365. A decisive break below $3,285 could trigger a deeper correction toward $3,200, while reclaiming the upward trendline would restore bullish momentum toward new highs.
If this idea resonates with you or you have your own opinion, traders, hit the comments. I’m excited to read your thoughts!

Lingrid | EURUSD Drops from 1.18000 RESISTANCE. Possible ShortFX:EURUSD is showing strong rejection at the resistance zone near 1.1790 after multiple fake breaks and failed attempts to sustain above the key level. Price has now broken below the mid-range and is forming a bearish rejection pattern right at the edge of the breakout area. With bearish momentum accelerating and a move toward 1.1620 support appears likely. Breakdown from the consolidation channel favors trend continuation to the downside.
📉 Key Levels
Sell trigger: Breakdown below 1.1660
Sell zone: 1.1700 – 1.1730
Target: 1.1620
Invalidation: Break above 1.1750
💡 Risks
Sudden bullish engulfing near 1.1670 could negate the breakdown
Support at 1.1620 may trigger a bounce
US macro data could shift trend dynamics mid-move
If this idea resonates with you or you have your own opinion, traders, hit the comments. I’m excited to read your thoughts!

Lingrid | GOLD Corrective Move: Potential Long Trade OpportunityThe price perfectly fulfilled my last idea . OANDA:XAUUSD is pulling back sharply after facing rejection from the key resistance level at 3431, following a two-leg impulse wave. The structure shows a correction within an active uptrend, nearing confluence support from the upward trendline and horizontal level. As long as price holds above 3342, a bounce and continuation toward 3400 remain the favored scenario. Broader bullish structure and momentum buildup point to a possible resumption after the current retracement.
📉 Key Levels
Buy trigger: Break above 3350
Buy zone: 3345 – 3340
Target: 3400
Invalidation: Break below 3320
💡 Risks
Failure to hold the upward trendline could shift momentum
Weak bounce may trap buyers before real breakout
Resistance at 3400 could remain firm without stronger volume support
If this idea resonates with you or you have your own opinion, traders, hit the comments. I’m excited to read your thoughts!

Lingrid | TONUSDT Potential Rebound from Support ZoneThe price perfectly fulfilled my last idea . OKX:TONUSDT is testing support after pulling back from the consolidation zone and forming a higher low above key structure. The chart shows a breakout from the downward trendline followed by a corrective retracement back toward confluence support. As long as price stays above 2.903, a bounce and renewed move toward 3.595 remains the base case. Structure favors bullish continuation after the retest of the breakout level.
📉 Key Levels
Buy trigger: Break and hold above 3.200
Buy zone: 2.903 – 3.050
Target: 3.595
Invalidation: Break below 2.903
💡 Risks
Failure to hold confluence of upward trendline and horizontal support
Weak follow-through above 3.2 could indicate distribution
Resistance at 3.595 may trigger renewed selling before breakout
If this idea resonates with you or you have your own opinion, traders, hit the comments. I’m excited to read your thoughts!

Lingrid | AUDCAD Short Following Resistance Fake Breakout The price perfectly fulfilled my last idea . FX:AUDCAD is rejecting from the top of the resistance zone after a strong bullish impulse and has started forming a rounded top pattern. Price remains inside an upward channel but is showing signs of exhaustion with the blue arrow projecting a pullback. As long as the price stays below 0.9008, we expect a descent toward the 0.8962 region. Momentum is cooling, and a bearish correction is likely before any bullish attempt resumes.
📉 Key Levels
Sell trigger: Break below 0.8990
Sell zone: 0.8995 – 0.9012
Target: 0.8962
Invalidation: Break and close above 0.9025
💡 Risks
Strong bullish momentum may resume if support holds
Failure to break 0.8990 could trap early sellers
Macro data from AUD/CAD region may disrupt the structure
If this idea resonates with you or you have your own opinion, traders, hit the comments. I’m excited to read your thoughts!

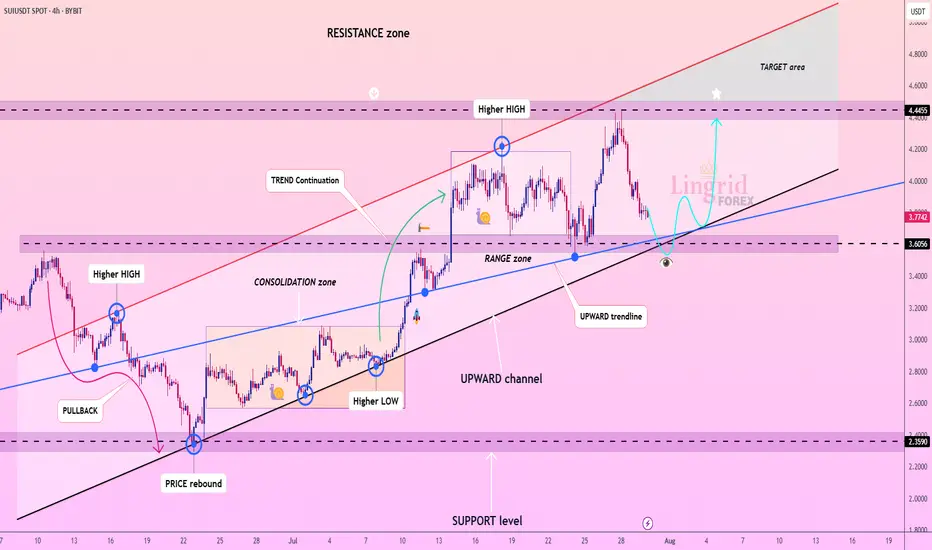
Lingrid | SUIUSDT Buying Opportunity from Support ZoneBYBIT:SUIUSDT is pulling back from the recent range top after testing the resistance zone and is approaching the key breakout area. The structure shows an upward channel with a prior consolidation breakout and an ongoing corrective retracement. As long as the price holds above the confluence zone near 3.35, the bullish structure remains intact. Broader momentum supports trend continuation toward the upper resistance boundary and the target area.
📉 Key Levels
Buy trigger: Break above 3.75 with volume
Buy zone: 3.25 – 3.35
Target: 4.24
Invalidation: Break below 3.22
💡 Risks
Breakdown below channel support would flip structure bearish
Fading volume on bounce may signal exhaustion
Broader market weakness could suppress upside momentum
If this idea resonates with you or you have your own opinion, traders, hit the comments. I’m excited to read your thoughts!

EURUSD LONG AND EDUCATIONAL BREAKDOWN ECB INTRESTRATE RELEASE The European Central Bank is expected to hold key rates for the first time in over a year on Thursday.
The Eurozone inflation rate has hit the ECB’s 2% target as the US-EU trade deal uncertainty lingers.
The EUR/USD pair could experience intense volatility following the ECB policy announcements.
The European Central Bank (ECB) is on track to leave its key interest rates unchanged after its July policy meeting, after having reduced rates at each of its last seven meetings. The decision will be announced on Thursday at 12:15 GMT.
The interest rate decision will be followed by ECB President Christine Lagarde’s press conference at 12:45 GMT.

Lingrid | EURUSD Potential Surge Following Channel BreakoutFX:EURUSD is consolidating after bouncing from a key confluence of support around 1.16000 and forming a higher low within the upward channel. The recent corrective pullback through a downward channel now appears complete, with bullish structure resuming. Price is likely to advance toward the 1.18300 resistance as long as the 1.15900 zone holds. Momentum favors a continuation of the A-B-C and trend continuation sequences already established.
📉 Key Levels
Buy trigger: Break above 1.16500
Buy zone: 1.16000–1.16250
Target: 1.18300
Invalidation: Close below 1.14500
💡 Risks
Failure to break the corrective channel resistance
Bearish divergence on lower timeframes
Broader USD strength reversal
If this idea resonates with you or you have your own opinion, traders, hit the comments. I’m excited to read your thoughts!

Lingrid | SOLUSDT Pullback Opportunity From the Support ZoneThe price perfectly fulfilled my previous idea . BINANCE:SOLUSDT is gaining upside traction after a clean breakout from the range zone and reclaim of the upward trendline near the 188.46 area. Bullish momentum from the higher low confirms buyers' control inside the rising channel, and price is now consolidating above key support. As long as the price holds above 188, the bias favors another move into the 220.00 resistance region. This ascending pattern reinforces the bullish structure with a likely continuation toward the upper boundary.
📉 Key Levels
Buy trigger: Break above 202.00
Buy zone: 188.00–194.00
Target: 220.00
Invalidation: Close below 188.46
💡 Risks
Failure to hold above 188.00 support
Loss of momentum after breakout
Macro-driven volatility reversal
If this idea resonates with you or you have your own opinion, traders, hit the comments. I’m excited to read your thoughts!

VKTX Viking Therapeutics Options Ahead of EarningsIf you haven`t bought VKTX before the breakout:
Now analyzing the options chain and the chart patterns of VKTX Viking Therapeutics prior to the earnings report this week,
I would consider purchasing the 40usd strike price Calls with
an expiration date of 2026-1-16,
for a premium of approximately $7.65.
If these options prove to be profitable prior to the earnings release, I would sell at least half of them.

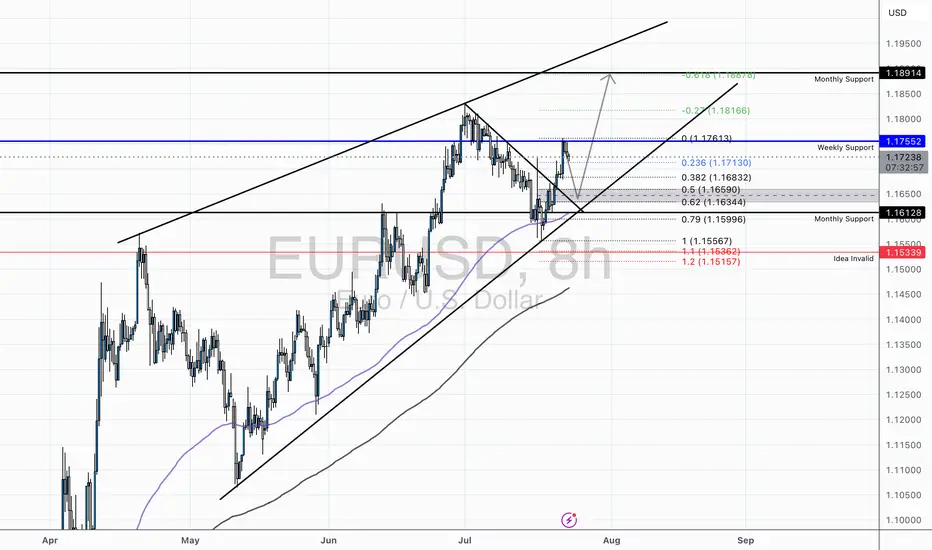
EUR/USD - Holding Bullish Structure Above Key Fibs and TrendlineTechnical Overview:
EUR/USD continues to respect its ascending channel structure, currently rebounding from the lower trendline support while trading above the 50 EMA and 200 EMA. After a healthy retracement to the monthly support (1.16128), the pair has shown strong buying interest, supported by bullish RSI divergence from oversold conditions on the 8H chart.
Key Levels:
Support Zone: 1.1613 – 1.1634 (Fib Cluster + Channel Support + Monthly Support)
Resistance Zone: 1.1755 (Weekly Resistance) followed by 1.1816 (0.27 Fib Extension) and 1.1887 (0.618 Extension)
Invalidation Level: Below 1.1533 (1.272 Fib + Structural Breakdown)
Confluences:
Price broke above a descending correctional trendline, indicating a potential bullish continuation.
Multiple Fibonacci levels (0.382, 0.5, 0.618) have stacked around the previous consolidation area, increasing probability of a sustained move.
RSI bounce from below 40 suggests short-term momentum reversal.
Trade Idea:
We may see a minor pullback into the 1.16344–1.1659 area before a potential continuation higher. Conservative bulls may wait for a retest of this zone with a bullish engulfing or pin bar confirmation before entering long.
Targets:
First target at 1.1755 (prior weekly resistance)
Second target at 1.1816 (Fib extension)
Final target near 1.1887 (major resistance / upper channel boundary)
Risk Management:
A break and close below 1.1533 would invalidate the bullish setup and signal potential bearish pressure returning to the pair.
GBP/JPY 4H - Rejection from Supply Zone and Key Fib AreaOverview:
GBP/JPY is trading near 197.91, and recent price action suggests a potential short opportunity. The pair has been rejected from a key Fibonacci resistance zone, and bearish momentum appears to be building beneath a fading ascending channel. Let’s break down why this chart leans more bearish.
Market Structure Breakdown:
* Price action failed to sustain new highs above 199.90 and is now forming lower highs, a potential early sign of trend exhaustion.
* The recent bounce from 197.40 was muted and rejected near the 0.5 and 0.618 retracement levels, indicating strong supply around the 198.68–198.98 zone.
Fibonacci Confluence:
* The rejection occurred right at the 0.618 retracement of the prior downswing — a key Fibonacci level often used by institutional traders to re-enter in the direction of the trend.
* Price is now hovering below the 0.382 (198.38) and 0.5 (198.68) levels, which may now act as resistance.
* If the current rejection holds, downside targets are:
* 0.0 (197.40) – recent low
* -0.27 extension (196.70) – potential bearish continuation target
* -0.618 extension (195.81) – extended downside objective
Trendline & Channel Considerations:
* The ascending channel is losing momentum.
Moving Averages:
* Price is now below the 50 EMA, and testing the 200 EMA, which is at risk of breaking.
* A clear close below both EMAs would confirm bearish momentum.
RSI & Momentum:
* The RSI shows bearish divergence on recent highs and is struggling to break above the midline (50).
* Momentum is tilting to the downside and failing to build higher on bounces.
Key Zones:
* Resistance Zone: 198.60–198.98
* Strong Fibonacci confluence + previous supply
* Support Zone: 197.40
* Prior swing low and 0.0 Fib level
* Bearish Continuation Zone: Below 197.30
* Breakout would confirm downside acceleration toward 196.70 and 195.80
Conclusion:
GBP/JPY is showing signs of bearish pressure beneath key resistance. With the rejection from the 0.618 Fib level and weakening channel structure, the path of least resistance may be to the downside — especially if price breaks and holds below 197.40.
A confirmed breakdown opens the door toward 196.70 and possibly 195.80, as bearish continuation unfolds. Overall we can even see price hitting past historical levels at 189.50

Lingrid | GOLD Key Resistance Zone. Possible Short-Term TradeThe price perfectly fulfilled my last idea . OANDA:XAUUSD has reached the upper boundary of the resistance zone around 3,445 after a strong impulse leg from the support trendline and the breakout of consolidation. Price action shows signs of exhaustion just below the June high, forming a potential reversal pattern near the channel top. If gold fails to hold above this resistance, a short-term pullback toward the 3,385 level becomes likely. The setup favors a short-term corrective decline unless bulls reclaim control with a breakout above the red trendline.
📉 Key Levels
Sell trigger: Rejection below 3,445
Sell zone: 3,430–3,445
Target: 3,385
Invalidation: Close above 3,480
💡 Risks
Breakout continuation toward 3,480
Sustained momentum from recent impulse leg
DXY weakness boosting gold's appeal
If this idea resonates with you or you have your own opinion, traders, hit the comments. I’m excited to read your thoughts!

Lingrid | NZDUSD Potential Market Correction From ResistanceFX:NZDUSD has approached a key resistance zone at 0.6040 after completing an A-B-C upward move and forming a potential lower high. Price is testing both horizontal and trendline resistance, suggesting exhaustion within the broader upward move. A failure to hold above the 0.6040 area may trigger a reversal toward the 0.5991 support zone. The structure favors a bearish pullback if the breakout is rejected.
📉 Key Levels
Sell trigger: Rejection from 0.6045
Sell zone: 0.6035–0.6045
Target: 0.5991
Invalidation: Close above 0.6055
💡 Risks
Clean breakout above resistance zone
Strengthening NZD from risk sentiment shift
Holding above upward trendline support
If this idea resonates with you or you have your own opinion, traders, hit the comments. I’m excited to read your thoughts!

Lingrid | TRXUSDT Pullback Following the Bullish Momentum BINANCE:TRXUSDT is consolidating after retreating from the 0.3350 resistance, following a higher high within the upward channel. Despite short-term bearish momentum, price has rebounded off the key 0.3128 support near the blue trendline. A break above recent highs may open a move back toward the resistance zone and upper channel. As long as the ascending structure holds, bullish continuation remains favored.
📉 Key Levels
Buy trigger: Break above 0.3190
Buy zone: 0.3128–0.3160
Target: 0.3350
Invalidation: Break below 0.3090
💡 Risks
Failure to reclaim breakout structure
Channel support breakdown
Broader market weakness in altcoins
If this idea resonates with you or you have your own opinion, traders, hit the comments. I’m excited to read your thoughts!

Lingrid | BTCUSDT Consolidation Expansion ScenarioBINANCE:BTCUSDT is coiling within a bullish continuation zone after rebounding strongly from the 115,930 support and holding above the blue ascending trendline. Price formed a higher high inside the rising channel, followed by sideways consolidation, suggesting preparation for another bullish leg. The triangle pattern breakout and price stability above the trendline favor upward continuation toward the resistance at 126,500. Momentum remains intact while the structure supports the next breakout push.
📉 Key Levels
Buy trigger: Break and hold above 120,000
Buy zone: 117,500–118,200
Target: 126,500
Invalidation: Close below 115,930
💡 Risks
Loss of support at the trendline
Strong rejection near red channel resistance
Weak market sentiment or macro news shocks
If this idea resonates with you or you have your own opinion, traders, hit the comments. I’m excited to read your thoughts!
