EUR/USD – Falling Wedge at Major Fibonacci Zone | Bullish ReversAfter a strong mid-June rally, EUR/USD has pulled back into a key fib cluster, showing early signs of reversal from a classic falling wedge pattern — often a precursor to bullish breakouts.
Technical Breakdown:
📉 Descending Trendline
🔍 Fibonacci Confluence:
Price is reacting from the 0.5-0.618 – 0.705 zone (1.16421-1.15969), aligning perfectly with historical demand and the golden zone of the fib retracement.
Just below sits the 0.79 fib (1.15339), which also marks our invalidity level for this idea — a deep but powerful retracement if tested.
💡 RSI:
While still below 50, it has created a hidden bullish divergence between July 12–17, hinting that momentum is flipping back to bulls.
🧠 Educational Insight:
This setup combines Trendlines, Fibonacci retracement theory, and EMA dynamics to build a multi-layered trade thesis — the type of confluence we look for at Wright Way Investments.
Price doesn’t just reverse because it hits a fib level. But when structure, EMAs, and RSI align — the odds increase significantly.
📈 Trade Setup (Idea-Based, Not Financial Advice):
Long Entry Zone: Current area (1.159–1.161), with confirmation above 1.1626
Invalidation: Clean break & close below 1.15339
Target Zones:
🎯 TP1 – 1.1642 (50 fib & retest zone)
🎯 TP2 – 1.1686 (38.2 fib)
🎯 TP3 – 1.1755 (Weekly Resistance)
📌 Summary:
EUR/USD is forming a textbook reversal setup, supported by fib precision and EMA alignment. Patience is key — but the ingredients are here for a strong bullish continuation.
Signalsprovider

Lingrid | USDCHF Corrective Move and Bearish ContinuationThe price perfectly fulfills my previous idea . FX:USDCHF is weakening after printing a lower high beneath the resistance zone and rejecting the confluence of the downward trendline and horizontal supply near 0.80079. The structure remains bearish despite short-term corrective moves, as each rally stalls below previous highs. Price is at risk of rolling over again, aiming for the 0.78300 support if the 0.80000 area holds as resistance. Sellers remain in control as long as the pair trades below the red trendline.
📉 Key Levels
Sell trigger: Rejection below 0.80000
Sell zone: 0.79800–0.80100
Target: 0.78300
Invalidation: Close above 0.80150
💡 Risks
Bullish breakout above the descending trendline
Momentum divergence on intraday timeframes
Broader USD strength recovery
If this idea resonates with you or you have your own opinion, traders, hit the comments. I’m excited to read your thoughts!

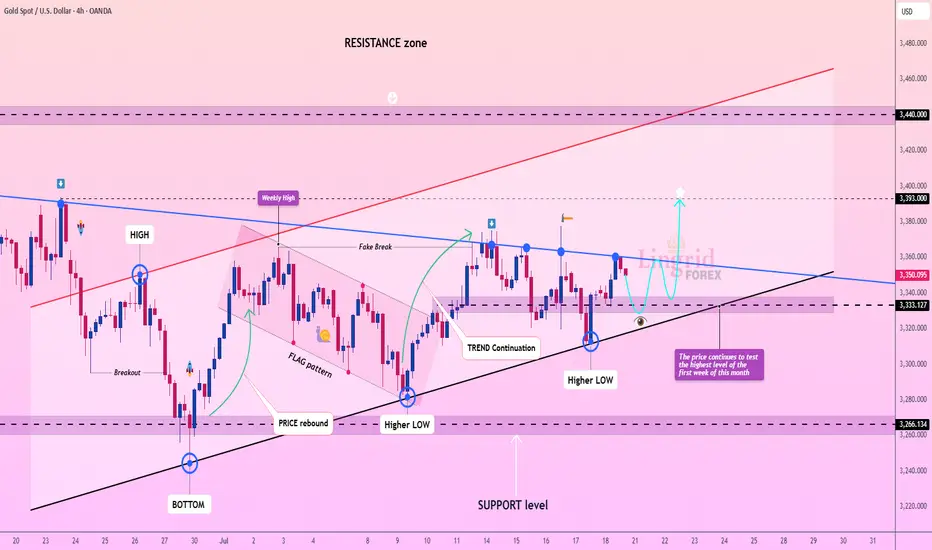
Lingrid | GOLD Weekly Analysis: Testing Resistance ZoneOANDA:XAUUSD markets are showing renewed strength as prices continue to test the highest levels reached in the first week of this month, demonstrating persistent bullish momentum despite ongoing consolidation. The precious metal is approaching a decisive technical juncture that could determine the next major directional move.
The chart reveals a compelling technical setup with gold forming higher lows while maintaining the upward trend continuation. After the previous fake breakout and flag pattern completion, the market has established a solid foundation above the $3,330 support level. The current structure shows a series of higher lows, confirming the underlying bullish bias.
The weekly high retest presents a crucial inflection point. A successful break above this level could trigger the next major leg higher toward the $3,400+ target zone, particularly given the ascending triangle formation and persistent institutional interest. The convergence of multiple technical indicators, including the trend continuation pattern and higher low formation, suggests accumulation at current levels.
Key levels to monitor include the immediate resistance at $3,393 and the critical $3,450 level. A decisive break above these levels would likely accelerate momentum toward $3,500-$3,600, while failure to maintain the higher low structure could see a pullback toward $3,285 support. The overall technical picture remains constructively bullish within the broader uptrend.
If this idea resonates with you or you have your own opinion, traders, hit the comments. I’m excited to read your thoughts!
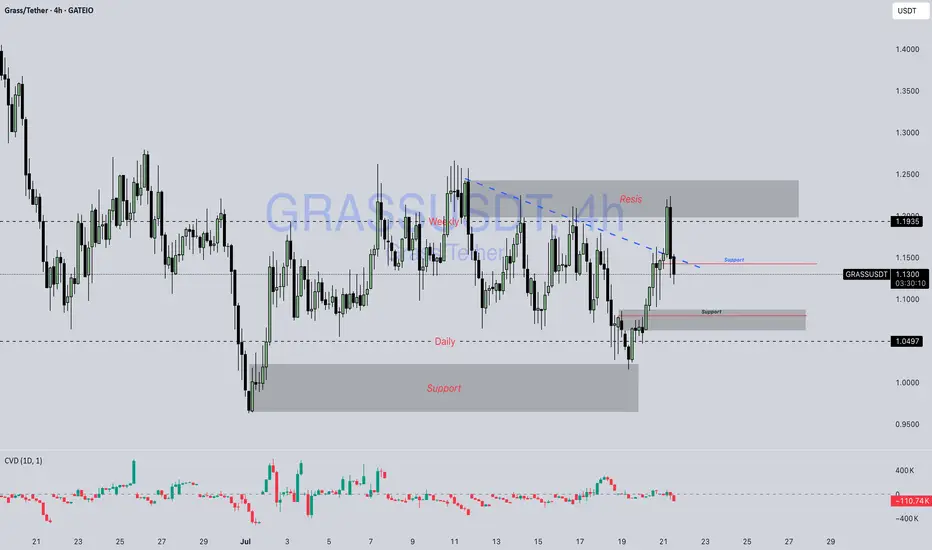
Grass / Usdt GATEIO:GRASSUSDT
📊 **Chart Overview – GRASSUSDT (4H):**
* 💰 **Current Price:** \$1.1362
* 🔻 **Previous Trend:** Downtrend has been challenged; price broke above the **descending trendline (blue dashed)**.
* 🟦 **Key Support Zones:**
* \$1.10 (recent demand area retest)
* \$1.05 (major support below, seen from earlier bounce zone)
* 🟥 **Key Resistance Zone:**
* \$1.19 – \$1.25 (major supply area where price got rejected again)
---
### 🔍 **Technical Breakdown:**
1. **Break and Retest Attempt:**
* Price **broke the descending trendline** and tapped into the \$1.19 resistance.
* Currently pulling back — possibly a **retest of the broken trendline** and the previous support near \$1.10–\$1.13.
2. **Supply Zone Rejection:**
* Strong rejection from **\$1.19–\$1.25**, which aligns with the upper supply zone.
* Sellers are actively defending this area.
3. **Bullish Case:**
* If GRASS holds above **\$1.10**, it may gear up for another push toward **\$1.19–\$1.25**.
* A clean break and hold above \$1.1935 could open room toward \$1.30+.
4. **Bearish Case:**
* Failure to hold \$1.10 or a breakdown below \$1.05 could invalidate bullish bias and revisit the lower demand zone near **\$0.95–\$1.00**.
---
📌 **Market Summary:**
GRASS is at a **critical zone**, attempting to flip trendline resistance into support. The reaction from \$1.10–\$1.13 will be key to deciding whether it can revisit higher supply levels or turn back toward major support.
---
⚠️ **Disclaimer:**
*This is **not financial advice**. All information provided is for **educational and informational purposes only**. Always perform your own analysis and manage your risk properly before trading.*
---
USDJPY Q3 | D21 | W30 | Y25 15' OB UPDATE 📊USDJPY Q3 | D21 | W30 | Y25 15' OB UPDATE
Daily Forecast 🔍📅
Here’s a short diagnosis of the current chart setup 🧠📈
Higher time frame order blocks have been identified — these are our patient points of interest 🎯🧭.
It’s crucial to wait for a confirmed break of structure 🧱✅ before forming a directional bias.
This keeps us disciplined and aligned with what price action is truly telling us.
📈 Risk Management Protocols
🔑 Core principles:
Max 1% risk per trade
Only execute at pre-identified levels
Use alerts, not emotion
Stick to your RR plan — minimum 1:2
🧠 You’re not paid for how many trades you take, you’re paid for how well you manage risk.
🧠 Weekly FRGNT Insight
"Trade what the market gives, not what your ego wants."
Stay mechanical. Stay focused. Let the probabilities work.
FRGNT 📊

EURUSD Q3 | D21 | W30 | Y25 📊EURUSD Q3 | D21 | W30 | Y25
Daily Forecast 🔍📅
Here’s a short diagnosis of the current chart setup 🧠📈
Higher time frame order blocks have been identified — these are our patient points of interest 🎯🧭.
It’s crucial to wait for a confirmed break of structure 🧱✅ before forming a directional bias.
This keeps us disciplined and aligned with what price action is truly telling us.
📈 Risk Management Protocols
🔑 Core principles:
Max 1% risk per trade
Only execute at pre-identified levels
Use alerts, not emotion
Stick to your RR plan — minimum 1:2
🧠 You’re not paid for how many trades you take, you’re paid for how well you manage risk.
🧠 Weekly FRGNT Insight
"Trade what the market gives, not what your ego wants."
Stay mechanical. Stay focused. Let the probabilities work.
FRGNT 📊

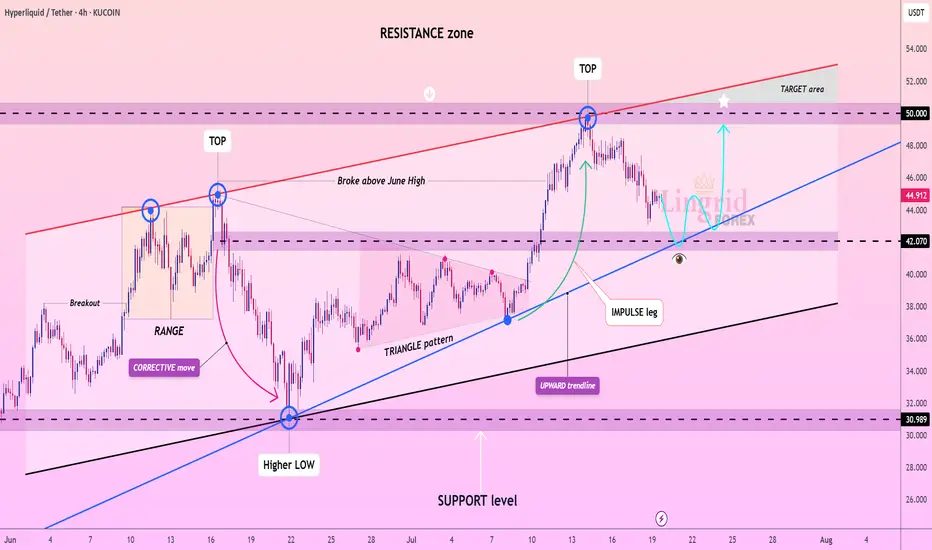
Lingrid | HYPEUSDT potential Rebound from the Support ZoneThe price perfectly fulfilled my last idea . KUCOIN:HYPEUSDT recently surged above the triangle pattern and tested the key resistance near 50, forming a local top. After a healthy retracement, price is now approaching the blue upward trendline and support zone near 42, setting the stage for another bullish bounce. The structure reveals a higher low and a strong impulse leg, suggesting continuation toward the upper resistance area. The chart favors bullish continuation after retest confirmation of the ascending support.
📉 Key Levels
Buy trigger: Bounce from 42.5–43.5 zone
Buy zone: 42.0–43.0
Target: 50.0 with potential to 52.0
Invalidation: Breakdown below 40.0
💡 Risks
Failure to hold trendline support
False breakout rejection below 42.0
Broader market sentiment turning risk-off
If this idea resonates with you or you have your own opinion, traders, hit the comments. I’m excited to read your thoughts!
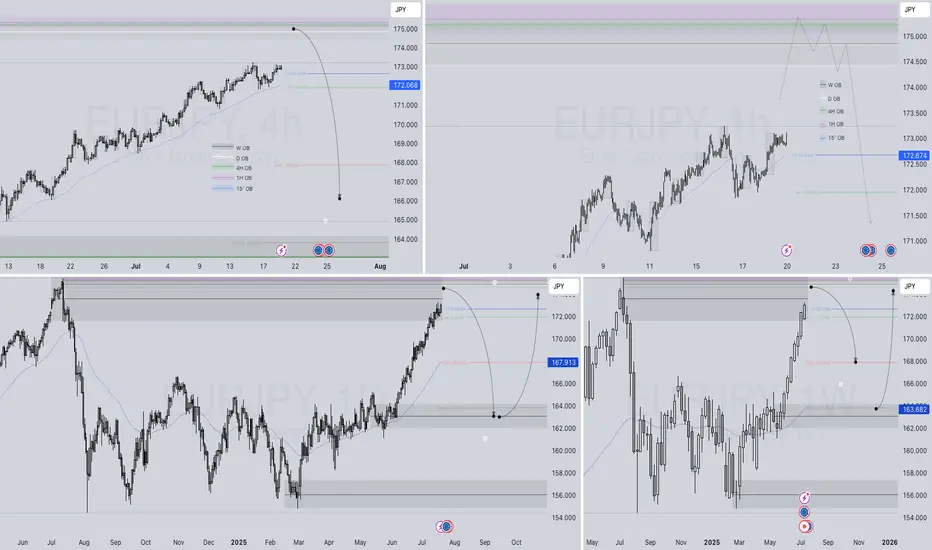
EURJPY – WEEKLY FORECAST Q3 | W30 | Y25📊 EURJPY – WEEKLY FORECAST
Q3 | W30 | Y25
Weekly Forecast 🔍📅
Here’s a short diagnosis of the current chart setup 🧠📈
Higher time frame order blocks have been identified — these are our patient points of interest 🎯🧭.
It’s crucial to wait for a confirmed break of structure 🧱✅ before forming a directional bias.
This keeps us disciplined and aligned with what price action is truly telling us.
📈 Risk Management Protocols
🔑 Core principles:
Max 1% risk per trade
Only execute at pre-identified levels
Use alerts, not emotion
Stick to your RR plan — minimum 1:2
🧠 You’re not paid for how many trades you take, you’re paid for how well you manage risk.
🧠 Weekly FRGNT Insight
"Trade what the market gives, not what your ego wants."
Stay mechanical. Stay focused. Let the probabilities work.
FRGNT FOREX ANALYSIS 📊
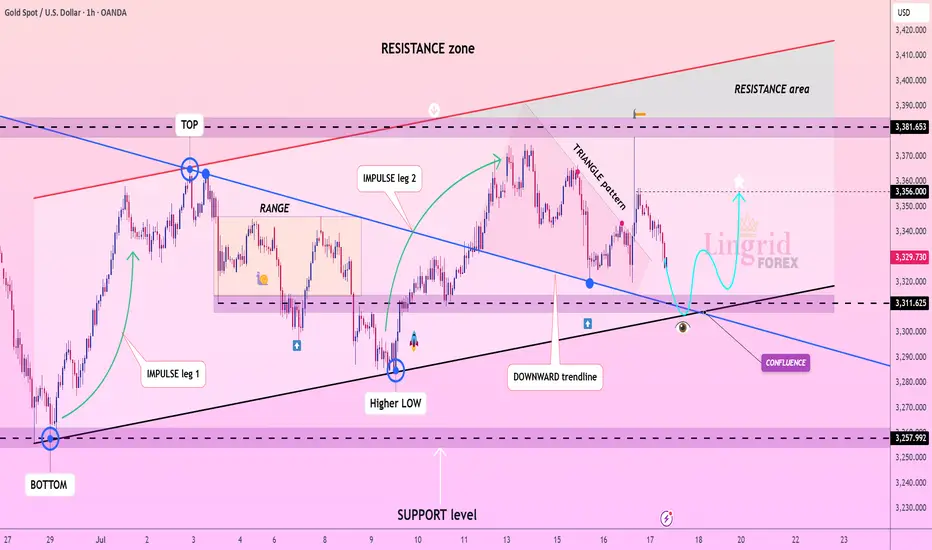
Lingrid | GOLD Continues to See Range-Bound MovementOANDA:XAUUSD is forming a bullish structure above the confluence of the downward trendline and horizontal support at 3,310. A strong impulse move followed by a triangle consolidation hints at an emerging continuation pattern, with buyers preparing for another leg higher. Price is currently approaching a key decision zone where previous support and diagonal confluence intersect, creating a launchpad scenario. If price confirms support above 3,311, a rebound toward the 3,356–3,382 zone becomes likely.
📉 Key Levels
Buy trigger: Rebound from 3,310–3,320
Buy zone: 3,300–3,315
Target: 3,356 and potentially 3,380
Invalidation: Break and close below 3,250
💡 Risks
Breakdown below the support zone may trigger extended retracement
False breakout through triangle resistance without volume
Sudden volatility from macroeconomic catalysts (e.g., Fed comments or CPI data)
If this idea resonates with you or you have your own opinion, traders, hit the comments. I’m excited to read your thoughts!
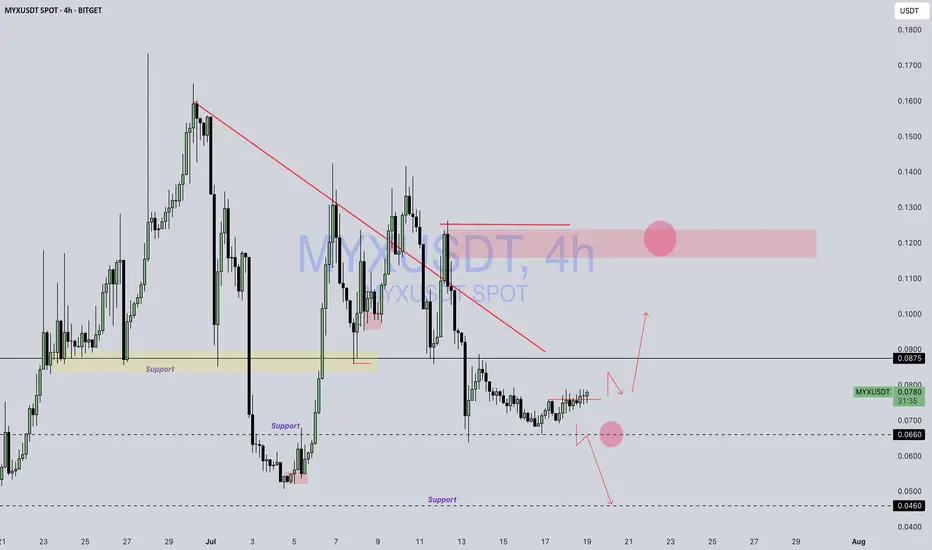
MYX / USDTBITGET:MYXUSDT
Something’s cooking in MYX… 🍳📊
Be careful now — and enjoy it later.
The chart’s heating up — don’t sleep on it. 🔥👀
Disclaimer : Not Financial Advice
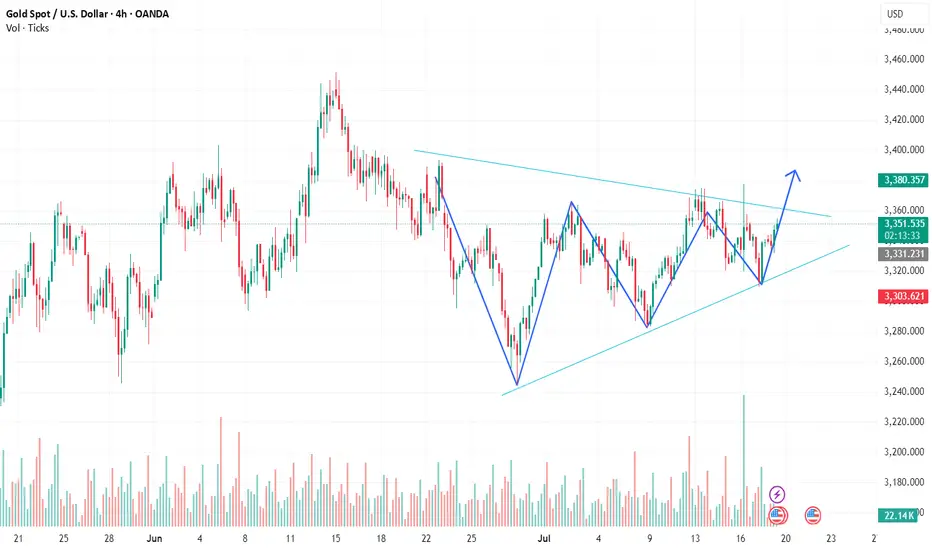
GOLD H1 Technical Analysis🧠 Chart Breakdown & Trade Idea: Symmetrical Triangle Formation
We’re observing a symmetrical triangle formation — a classic consolidation pattern that often precedes a strong breakout move. The price has been making higher lows and lower highs, gradually tightening within two converging trendlines.
This pattern indicates that buyers and sellers are in a temporary equilibrium, with volatility compressing. The market is clearly waiting for a catalyst to decide the next big move.
🔍 Key Observations:
1. Trendlines:
- The upper resistance trendline is sloping downward, connecting several lower highs.
- The lower support trendline is sloping upward, connecting multiple higher lows.
2. Volume Pattern:
- Volume has been tapering off during the consolidation phase — a typical behavior during triangle formation.
- A volume spike at the breakout point would confirm the direction and strength of the move.
3. Price Action:
- The price has bounced cleanly off the lower trendline and is now approaching the upper boundary.
- A strong V-shaped recovery from support indicates buyer dominance at lower levels.
- The market is now testing the triangle’s upper resistance again — a crucial inflection point.
🚀 What the Chart is Saying
The chart is signaling a potential bullish breakout. The consistent formation of higher lows shows increasing demand, and the price is now poised to test — and possibly break — the descending resistance.
If the breakout happens with above-average volume, it would validate the pattern and open the door for a sharp upward rally.
🎯 Trade Setup (When to Buy)
✅ Buy Entry:
- Wait for a confirmed breakout — a candle close above the upper trendline with strong volume.
- Ideally, price should break above the recent swing high to avoid a false breakout.
🛑 Stop Loss:
- Just below the most recent higher low or the triangle’s lower trendline.
🎯 Take Profit:
- Measure the widest part of the triangle and project it upward from the breakout point.
- This gives you a realistic and technical target area.
📌 Conclusion:
This symmetrical triangle is nearing its apex, and the current setup favors the bulls. A breakout above resistance, accompanied by volume, could offer a high-probability long trade. Patience is key — wait for confirmation before entering.
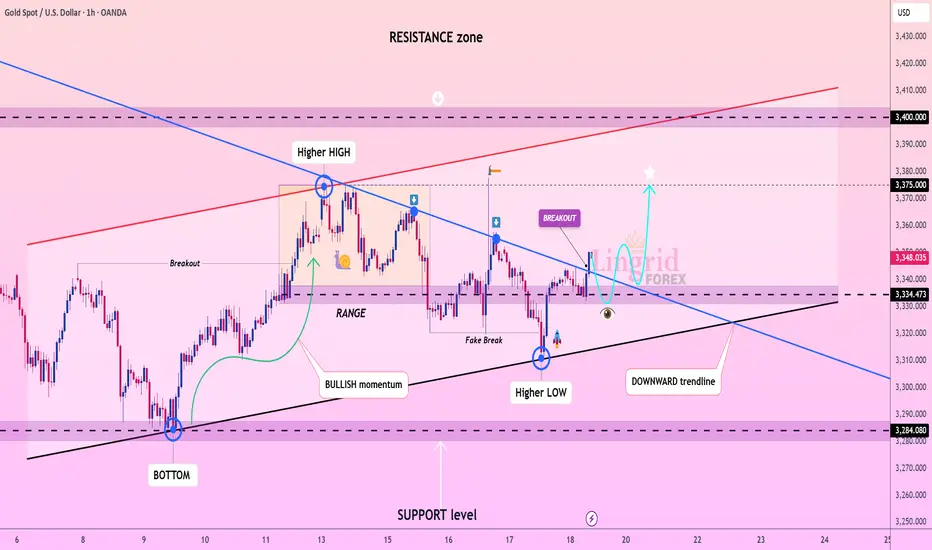
Lingrid | GOLD Broke Corrective Dynamic Resistance OANDA:XAUUSD rebounded off the key support near 3334, forming a higher low and breaking above the descending trendline. This breakout confirms bullish intent, supported by prior accumulation in the range and fake breakdown traps. Price is now retesting the breakout zone and is expected to launch toward 3375 and possibly higher. The structure favors a bullish continuation pattern supported by confluence of trendlines and rising momentum.
📉 Key Levels
Buy trigger: Break and hold above 3350
Buy zone: 3335–3345
Target: 3375 short-term, with potential to 3400
Invalidation: Drop below 3320 support line
💡 Risks
Another fake breakout followed by strong rejection
Resistance at 3375 acting as a supply wall
Low volume on breakout can cause reversal
If this idea resonates with you or you have your own opinion, traders, hit the comments. I’m excited to read your thoughts!
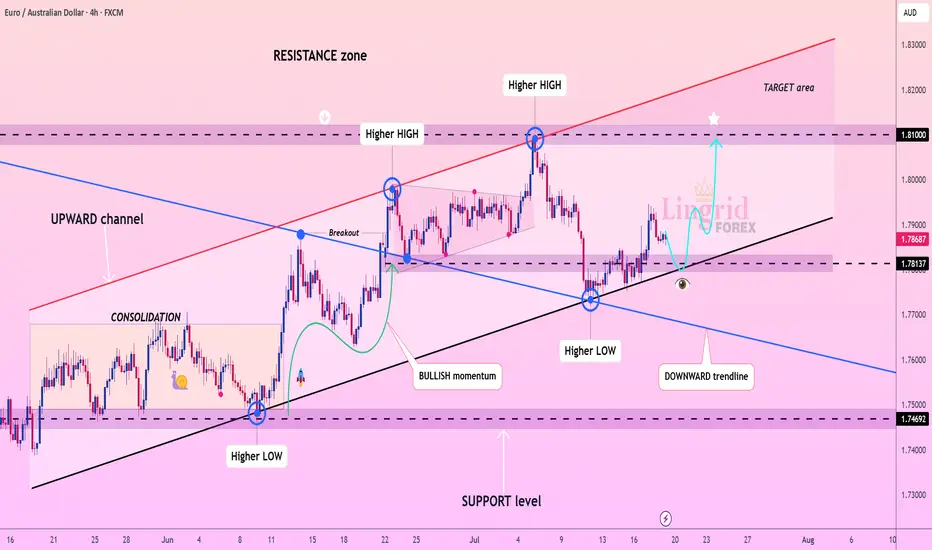
Lingrid | EURAUD Potential Retest of the Key LevelFX:EURAUD is holding firmly above the rising trendline after a successful retest of the support zone at 1.7813. The price has formed consecutive higher lows and remains within a well-defined upward channel, indicating continued bullish structure. A small corrective pullback is expected before a renewed rally toward the 1.8100 resistance level. Momentum is building for a potential breakout continuation toward the upper boundary of the channel.
📉 Key Levels
Buy trigger: Bounce from 1.7813 and reclaim of 1.7900
Buy zone: 1.7820–1.7880
Target: 1.8100
Invalidation: Breakdown below 1.7780 and support trendline
💡 Risks
Failure to hold above the current higher low
False breakout followed by bearish rejection from the mid-range
Weak momentum due to macroeconomic uncertainty
If this idea resonates with you or you have your own opinion, traders, hit the comments. I’m excited to read your thoughts!
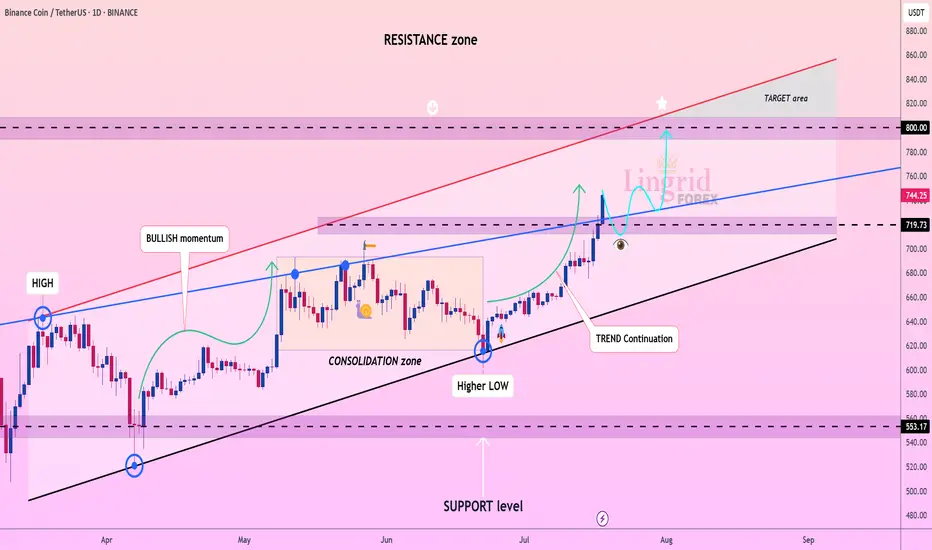
Lingrid | BNBUSDT Bullish MOMENTUM. Long from SUPPORT zoneBINANCE:BNBUSDT is continuing its bullish momentum after bouncing from the support trendline and breaking above the consolidation zone. Price has formed a higher low and followed through with strong impulse candles, pushing past local resistance around 720–740. The breakout confirms trend continuation within the upward channel, with price now aiming toward the 800 psychological level. The next leg higher could accelerate toward the upper resistance zone if support holds near 720.
📉 Key Levels
Buy trigger: Breakout above 740 confirmed
Buy zone: 719–730
Target: 800
Invalidation: Close below 700 support and trendline
💡 Risks
Rejection near horizontal resistance around 760
Bearish divergence on lower timeframes
Macro volatility from regulatory headlines or BTC sharp moves
If this idea resonates with you or you have your own opinion, traders, hit the comments. I’m excited to read your thoughts!
EURGBP SHORT – DAILY FORECAST Q3 | D17/18 | W29 | Y25💼 EURGBP SHORT – DAILY FORECAST
Q3 | D17/18 | W29 | Y25
FUN COUPON FRIDAY INCOMING !
📊 MARKET STRUCTURE SNAPSHOT
EURGBP is currently reacting from a key higher time frame supply zone, with price action showing weakness at premium levels. Momentum has slowed, and early signs of distribution are appearing. With structure aligning bearishly across multiple timeframes, the pair presents a short bias opportunity.
🔍 Confluences to Watch 📝
✅ Daily Order Block (OB)
Price reacted from a high-probability bearish OB.
Rejection wicks and a shift in candle body control point to supply dominance.
Momentum is fading, confirming the presence of smart money sellers.
✅ 4H Order Block
Clear mitigation of 4H OB followed by an internal break of structure (iBoS).
Price is respecting the OB zone, printing lower highs beneath key supply.
Perfect mid-timeframe confirmation of trend transition.
✅ 1H Order Block
1H structure shifted bearish, validating LTF trend alignment.
Price building supply chain with continued lower highs and bearish engulfing patterns.
Ideal zone for entry on pullback or liquidity sweep.
📈 Risk Management Protocols
🔑 Core Principles:
💰 Max 1% risk per trade
📍 Only execute at pre-identified zones
⏰ Set alerts — avoid impulsive trades
📉 Respect RR — minimum 1:2 per position
🧠 You're not paid for frequency. You're paid for discipline and execution quality.
🧠 Weekly FRGNT Insight
“Trade what the market gives, not what your ego wants.”
Stay mechanical, stay focused, and allow the probabilities to play out. Your job is to control risk — not the outcome.
🏁 Final Thoughts from FRGNT
📌 The structure is clear.
📌 The confluences are stacked.
📌 The bias is confirmed.
Let your execution reflect your discipline, not your emotions.
❤️ Good luck this week, and as always – I’ll see you at the very top.

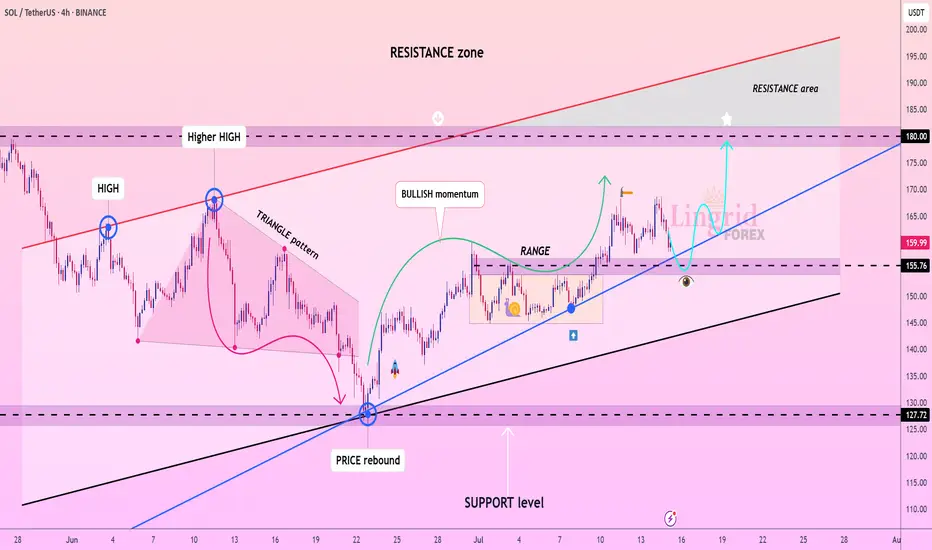
Lingrid | SOLUSDT trend Continuation TradeThe price perfectly fulfilled my previous idea . BINANCE:SOLUSDT found strong support around the 155.7 level after a brief pullback and continues to respect the ascending blue trendline. The previous bullish impulse followed by a healthy consolidation suggests a classic trend continuation structure. If buyers defend the current demand zone and reclaim upward momentum, a move toward the 180 resistance zone is likely. This setup aligns with broader bullish market structure and rising channel dynamics.
📉 Key Levels
Buy trigger: confirmed bounce from 155.7 trendline support
Buy zone: 155.7–158.0 (range floor and trendline confluence)
Target: 180.0
Invalidation: breakdown below 155.0 signals structure shift
💡 Risks
Volatility around trendline retest could trigger stop hunts
Failure to reclaim momentum above 165 may lead to ranging
Sudden market-wide weakness could pressure altcoins broadly
If this idea resonates with you or you have your own opinion, traders, hit the comments. I’m excited to read your thoughts!
Lingrid | GBPUSD buying Opportunity from the Demand ZoneFX:GBPUSD is rebounding from the 1.3390 support level after completing a triangle breakdown and retesting the lower support zone. A potential double-bottom pattern is forming near the key support area, signaling a short-term bullish reversal. If bulls reclaim the descending blue trendline, momentum could drive price back toward the 1.3550 resistance level. This retracement would mark a corrective phase within the larger structure, offering an upside opportunity.
📉 Key Levels
Buy trigger: bullish rejection from 1.3390 with recovery above 1.3440
Buy zone: 1.3390–1.3440 (demand and bounce structure)
Target: 1.3550
Invalidation: 4H candle close below 1.3390 support breaks bullish setup
💡 Risks
Failure to break above trendline could result in further consolidation
Macroeconomic news may override technical rebound
Downtrend pressure remains unless higher lows are confirmed
If this idea resonates with you or you have your own opinion, traders, hit the comments. I’m excited to read your thoughts!

GOLD XAUUSD TodayGOLD XAUUSD Today
SSM Structure back to sell trend
In my opinion good for looking sell setup

Lingrid | GBPAUD Selling Opportunity From the Key LevelFX:GBPAUD rebounded sharply from the key support zone near 2.0415, forming a corrective leg toward the mid-range resistance at 2.0800. However, the overall structure remains within a downward channel, and the recent lower high under the red resistance trendline suggests continuation of bearish pressure. A rejection from the 2.08–2.10 zone would likely resume the prior impulse leg toward lower support levels. Until a breakout above the descending red trendline occurs, rallies remain corrective.
📉 Key Levels
Sell trigger: Rejection from 2.0800–2.0900
Sell zone: 2.0750–2.0850
Target: 2.0589 and potentially 2.0415
Invalidation: Break and close above 2.1020
💡 Risks
Breakout from the red resistance line could reverse the downtrend
Sudden AUD weakness from macro events
Price closes above the descending channel boundary
If this idea resonates with you or you have your own opinion, traders, hit the comments. I’m excited to read your thoughts!

Lingrid | SUIUSDT Pullback and New Higher High PotentialBINANCE:SUIUSDT has rebounded strongly from the support level at $3.60, continuing its bullish sequence of higher highs and higher lows. The price broke out of the consolidation zone and climbed above the blue upward trendline, confirming a continuation of the bullish trend. A retest of the breakout area is likely before a push toward the major resistance zone at $4.50. The structure remains bullish as long as the channel support holds.
📉 Key Levels
Buy trigger: Bounce from $3.60 zone
Buy zone: $3.55–$3.70 (retest range)
Target: $4.50 (red resistance line)
Invalidation: Close below $3.45 trendline support
💡 Risks
Breakdown of the black channel line
Volume divergence or failure to hold the $3.60 support
Broader market weakness across altcoins
If this idea resonates with you or you have your own opinion, traders, hit the comments. I’m excited to read your thoughts!

USD/JPY – Rising Wedge Meets Major ResistanceChart Overview:
USD/JPY is printing a textbook rising wedge formation, typically a bearish pattern—especially when occurring at the top of a major move.
What makes this setup compelling:
Price is testing the upper wedge resistance near the 148.50–149.00 region, a historically reactive zone.
There’s clear confluence with the 200 SMA, horizontal resistance, and wedge structure—all signaling potential exhaustion.
🔍 Key Technicals:
Resistance Zone: 148.00–149.00 (Highlighted Supply Zone)
Rejection Candle Pattern: Recent upper wick shows rejection and buyer fatigue
Bearish Divergence on RSI (14): Price made higher highs, RSI printed lower highs — a classic warning signal
🧠 Educational Note: Rising Wedge Patterns
A rising wedge is a bearish reversal pattern, especially potent when it forms after an extended rally. The structure narrows as buyers lose steam, leading to a likely breakdown once support is breached.
Pro Tip: Always confirm a wedge breakdown with a close below support + volume spike or bearish engulfing.
🔄 Invalidation:
This idea becomes invalid above 150.467, where the wedge breaks upward and price potentially enters a new bullish phase. Marked clearly as “Idea Invalid” on the chart.
🧠 Final Thoughts:
This chart combines price action, pattern structure, RSI divergence, and SMA confluence — a high-probability scenario favored by elite traders. If you trade based on confirmation rather than prediction, this could be a setup to watch closely.
🗣 Drop your thoughts or questions below!
💬 Let’s learn and grow together.

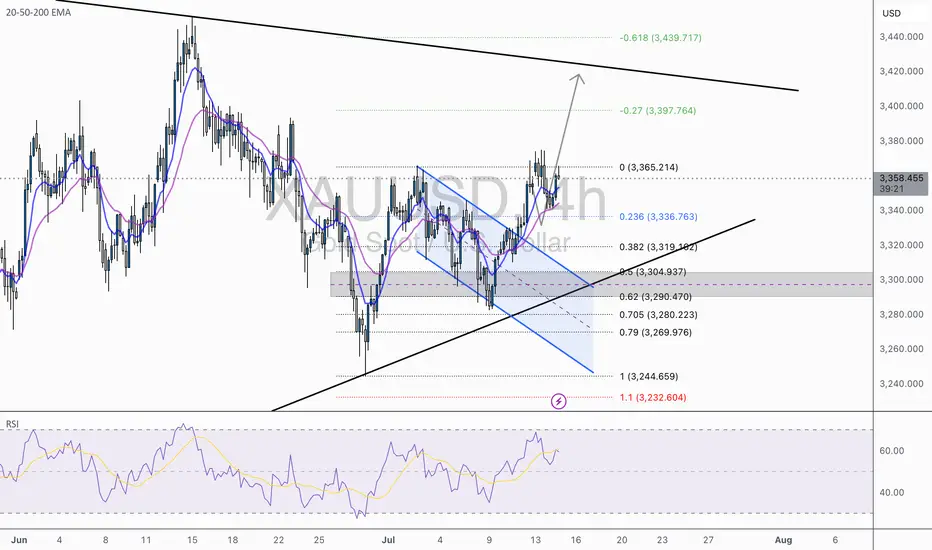
XAU/USD 1H – Bullish Breakout in Play | Eyes on 3,400+XAU/USD has officially broken out of a falling wedge pattern, triggering a classic bullish continuation setup. The rejection off the 0.618–0.705 fib retracement zone ($3,280–$3,290) acted as a powerful launchpad, pushing price above the mid-structure confluence and EMAs.
✅ Key Technical Highlights:
Structure Break: Clear bullish breakout from descending wedge + EMA crossover confirmation (20/50 over 200).
Fibonacci Anchors: Price respected the golden pocket (0.618–0.705), now aiming for full fib extension targets.
Targets:
🎯 TP1: 3,397 (-0.27 fib)
🎯 TP2: 3,440 (-0.618 fib / upper wedge trend-line resistance)
Support Zone: 3,304 – 3,319 (0.5–0.382 fib zone), now acting as fresh demand area.
RSI: Rebounding from 50 with momentum, no divergence, suggesting room for continuation.
🔔 Bullish Scenario:
As long as price holds above the breakout retest zone (≈3,336), momentum favors the bulls with high probability toward 3,400+. Clean higher highs and higher lows confirm trend alignment.
⚠️ Invalidation Level:
Break and close back below 3,304 would shift this from breakout to fakeout — watch for bearish pressure toward 3,280 if that occurs.
📌 Wright Way Outlook:
Momentum is on the side of the bulls. With fundamentals aligned and structure broken, this setup favors precision swing entries with clean RR.
Stay patient, stay tactical. Trade the Wright Way.
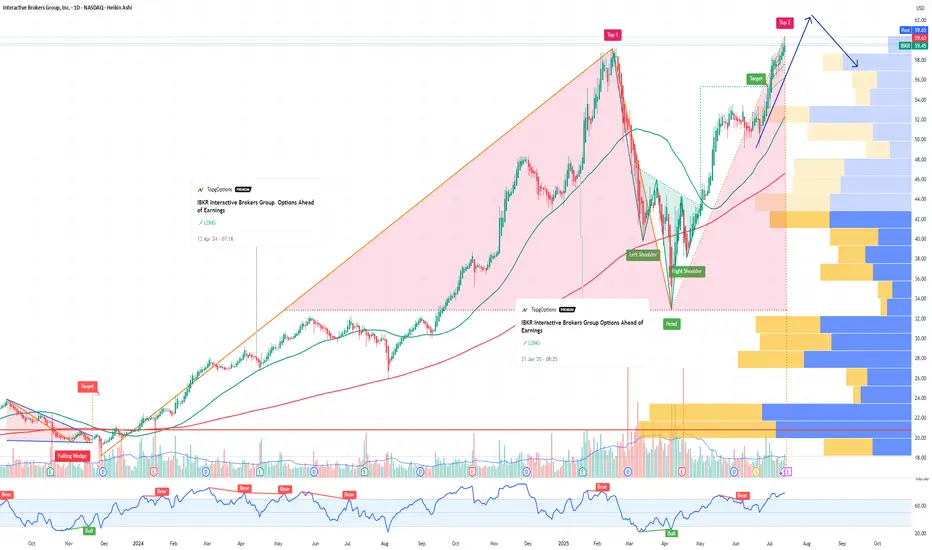
IBKR Interactive Brokers Group Options Ahead of EarningsIf you haven`t bought IBKR before the rally:
Now analyzing the options chain and the chart patterns of IBKR Interactive Brokers prior to the earnings report this week,
I would consider purchasing the 60usd strike price Calls with
an expiration date of 2025-9-19,
for a premium of approximately $3.90.
If these options prove to be profitable prior to the earnings release, I would sell at least half of them.