Lingrid | GOLD Shorting Opportunity at Confluence ResistanceOANDA:XAUUSD is approaching the key resistance near 3360 after rebounding from the 3245 support level and breaking out of the downward channel. Price is now testing the upward trendline from below, intersecting with the red descending trendline and horizontal resistance. If this confluence zone rejects the rally, a return toward 3305 or lower is likely, forming a potential bearish retest.
📉 Key Levels
Sell zone: 3350–3360
Buy trigger: breakout above 3360 with close above 3375
Target: 3305
Sell trigger: rejection from 3360 and break of 3340
⚠️ Risks
Break and retest of 3360 may invalidate short setup
Volatility around red trendline could trigger fakeouts
Demand near 3305 may cause sharp bounces if sellers stall
If this idea resonates with you or you have your own opinion, traders, hit the comments. I’m excited to read your thoughts!
Signalsprovider
Lingrid | EURAUD Trend Continuation Pattern FX:EURAUD is maintaining bullish momentum within a broad upward channel after bouncing from the 1.7900 support zone and forming a triangle continuation pattern. Price is coiling just below the 1.8000 handle and the red resistance boundary of the channel. A confirmed breakout above 1.8000 could open the path toward the 1.8100 target area, extending the broader bullish structure.
📈 Key Levels
Buy zone: 1.7880–1.7900
Sell trigger: breakdown below 1.7880
Target: 1.8100
Buy trigger: breakout and retest of 1.8000–1.8020 zone
💡 Risks
Rejection from 1.8000 resistance could trigger a pullback
Break below the blue trendline may invalidate bullish setup
Low momentum breakout may stall below 1.8050
If this idea resonates with you or you have your own opinion, traders, hit the comments. I’m excited to read your thoughts!

Lingrid | GOLD Breakout of Trend Continuation PatternThe price perfectly fulfilled my last idea . FX:XAUUSD is forming a bullish base just above the upward trendline and key support near 3,310, showing signs of price compression within a flag continuation pattern. After the recent pullback, the market is holding structure and coiling for a potential breakout toward the 3,365 resistance. If price rebounds from the confluence zone, it would signal bullish continuation with upside momentum building.
📈 Key Levels
Buy zone: 3,305–3,310 support confluence
Buy trigger: break and close above 3,340 minor structure
Target: 3,365–3,370 resistance zone
Sell invalidation: break below 3,290
💡 Risks
Breakdown below the flag may turn structure bearish
Weak volume on breakout could result in fakeout
Resistance at 3,365 may reject price on first test
If this idea resonates with you or you have your own opinion, traders, hit the comments. I’m excited to read your thoughts!

GOLD XAUUSD TodayThree posible scenarious
1.Now GOLD is bulish but possible is deep correct
2.UNTIL break my SSM Structure on H4 possible SSM reversal
3. If break SSM area go to new high

AUDUSD SHORT & LONG FORECAST Q3 W28 Y25AUDUSD SHORT & LONG FORECAST Q3 W28 Y25
Professional Risk Managers👋
Welcome back to another FRGNT chart update📈
Diving into some Forex setups using predominantly higher time frame order blocks alongside confirmation breaks of structure.
Let’s see what price action is telling us today! 👀
💡Here are some trade confluences📝
✅Daily Order block identified
✅4H Order Block identified
✅1H Order Block identified
🔑 Remember, to participate in trading comes always with a degree of risk, therefore as professional risk managers it remains vital that we stick to our risk management plan as well as our trading strategies.
📈The rest, we leave to the balance of probabilities.
💡Fail to plan. Plan to fail.
🏆It has always been that simple.
❤️Good luck with your trading journey, I shall see you at the very top.
🎯Trade consistent, FRGNT X

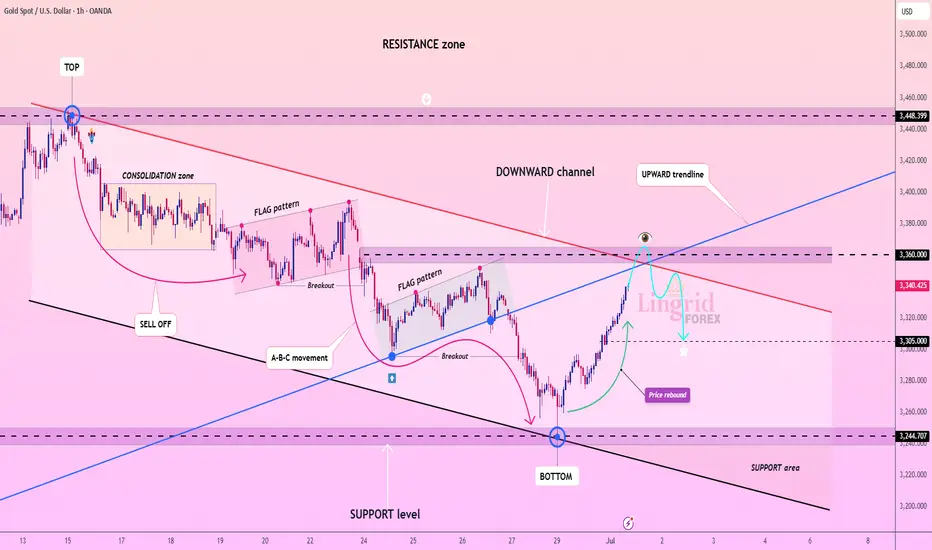
Lingrid | GOLD Weekly Analysis: Consolidation Within UptrendOANDA:XAUUSD market remain trapped in volatile sideways action within a broad consolidation range, following the recent strong rally. Despite the current noisy price behavior, the underlying longer-term bullish momentum remains intact.
Higher timeframe reveals critical technical levels, with gold testing the resistance zone around after breaking above the upward channel. The triangle pattern breakout suggests potential for higher targets, though the market is currently experiencing a corrective pullback near the $3,300 support level. The presence of multiple resistance tests indicates strong institutional interest at these elevated levels.
The 4H chart provides broader context, showing the A-B-C corrective structure from the June highs. The market appears to be forming a potential ascending triangle pattern, with the June high serving as key resistance. The current consolidation between the June high and low suggests accumulation before the next directional move.
Key levels to watch include the $3,300 support zone and the $3,400 resistance area. A decisive break above resistance could trigger another leg higher toward $3,500, while failure to hold support might see a retest of the $3,200 level. The overall structure suggests this consolidation is part of a larger bullish continuation pattern.
If this idea resonates with you or you have your own opinion, traders, hit the comments. I’m excited to read your thoughts!

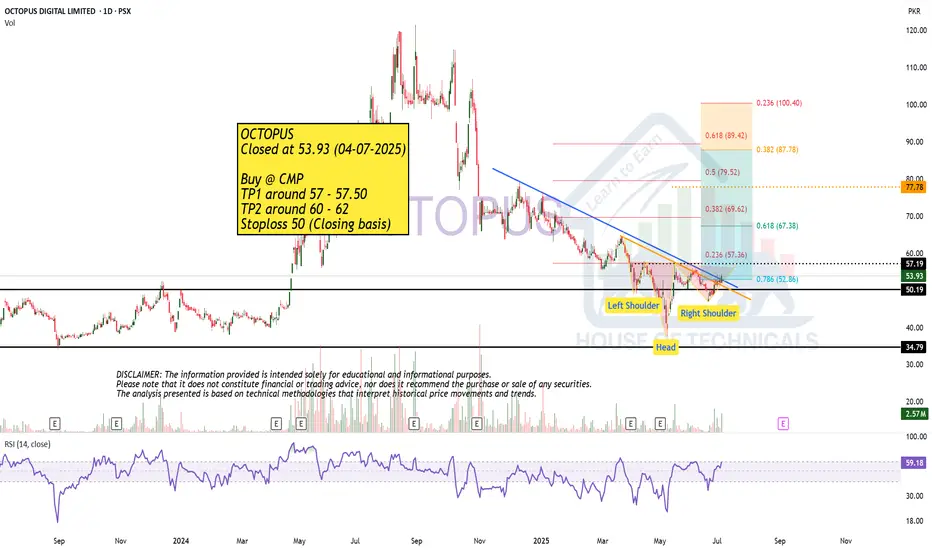
Buy CallOCTOPUS
Closed at 53.93 (04-07-2025)
Buy @ CMP
TP1 around 57 - 57.50
TP2 around 60 - 62
Stoploss 50 (Closing basis)
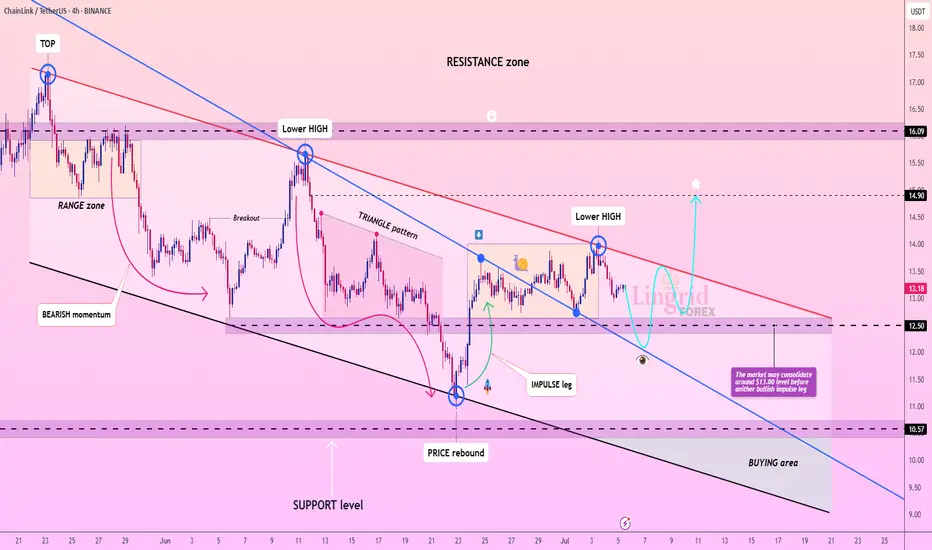
Lingrid | LINKUSDT potential Bullish BreakoutBINANCE:LINKUSDT has formed a sequence of lower highs beneath a descending red trendline, indicating that bearish pressure remains dominant. After a recent rejection near $13.80, price action is now pulling back toward the $12.50–$13.00 range where consolidation is likely. The structure suggests a potential rebound from the lower boundary before another bullish push into the resistance zone near $14.90.
📉 Key Levels
Buy zone: 12.50–13.00 (support + prior consolidation)
Sell trigger: loss of 12.50 support with strong volume
Target: 14.90 – major horizontal resistance
Buy trigger: bullish reversal from the 12.50 support zone
💡 Risks
Breakdown below $12.50 could send price toward $10.57
Lower highs pattern still intact unless $14.00 is cleared
Mid-range chop could delay trend continuation or trap longs
If this idea resonates with you or you have your own opinion, traders, hit the comments. I’m excited to read your thoughts!
Lingrid | SOLUSDT possible Channel BreakoutBINANCE:SOLUSDT is showing early signs of recovery after rebounding from the 127 support zone and reclaiming structure near the 140 level. Price is now consolidating below the red descending trendline, which acts as dynamic resistance. A breakout above 145 could confirm bullish reversal and target the 159 resistance zone as indicated by the star projection. The key lies in whether buyers can sustain pressure above the 140 zone.
📈 Key Levels
Buy zone: 138–142
Sell trigger: break below 127
Target: 159
Buy trigger: breakout and close above 145 trendline
💡 Risks
Failure to hold above 140 may lead to fresh lows
Downtrend may resume if price gets rejected at 145
Low volume breakout may signal a bull trap
If this idea resonates with you or you have your own opinion, traders, hit the comments. I’m excited to read your thoughts!

Lingrid | BTCUSDT possible Channel Break - Upside Surge The price perfectly fulfilled my last idea . BINANCE:BTCUSDT is pulling back slightly after rejecting the descending red trendline near the 108,000 level, while remaining above the breakout zone around 105,000. The structure suggests a potential bullish continuation if the price holds this level and forms a higher low. A successful breakout above 108,000 could ignite a move toward the 111,000 resistance band.
📈 Key Levels
Buy zone: 105,000–105,300
Sell trigger: breakdown below 105,000
Target: 111,000
Buy trigger: breakout and retest above 108,000 with strong momentum
💡 Risks
Failure to hold 105,000 reopens path to 98,700
Bearish rejection at 108,000 could maintain lower high structure
Weak volume breakout may lead to a bull trap under 111,000
If this idea resonates with you or you have your own opinion, traders, hit the comments. I’m excited to read your thoughts!

Lingrid | GOLD Pre-NFP Price Action AnalysisThe price perfectly fulfilled my last idea . OANDA:XAUUSD rebounded strongly from the 3244 support area, breaking above the downward trendline and pushing into the mid-resistance band. The price is currently testing 3353 and could pull back slightly before retesting the 3388 key resistance level. A sustained breakout above that red trendline would open the door for a run toward 3450.
📈 Key Levels
Buy zone: 3312–3330 (post-breakout retest area)
Sell trigger: break below 3312 and close under trendline
Target: 3388 with potential extension to 3450
Buy trigger: confirmed bullish bounce from 3312 and momentum above 3353
💡 Risks
Resistance at 3388 may cause rejection if volume fades
Downward trendline remains a structural cap unless fully broken
False breakout could return price back to 3244 zone quickly
If this idea resonates with you or you have your own opinion, traders, hit the comments. I’m excited to read your thoughts!

Lingrid | GBPUSD Potential Bounce at Key Psychological LevelThe price perfectly fulfilled my previous idea . FX:GBPUSD is consolidating above the upward trendline after forming a local double top near the 1.3787 resistance zone. The price is currently retesting the 1.3611–1.3660 support cluster, aligned with the trendline and previous impulse breakout area. A successful bounce from this zone could initiate another rally toward the upper boundary of the resistance range.
📈 Key Levels
Buy zone: 1.3600–1.3660 (trendline + support overlap)
Sell trigger: breakdown below 1.3600
Target: 1.3787 – resistance ceiling with prior rejection
Buy trigger: bullish reaction from 1.3611 area with strong candle close
💡 Risks
Breakdown below 1.3600 may expose deeper retracement to 1.3367
Repeated rejection at 1.3787 could form a longer-term double top
Macro data surprises could shift short-term direction suddenly
If this idea resonates with you or you have your own opinion, traders, hit the comments. I’m excited to read your thoughts!

Lingrid | SUIUSDT Pullback Setup: Expansion Trade OpportunityBINANCE:SUIUSDT is forming a bullish continuation structure within an upward channel, with the price pulling back after reaching a recent peak. Current support is found around 2.885, aligned with the upward trendline and prior breakout zone. If the price rebounds from this cluster, it may target the upper resistance near 3.20.
📈 Key Levels
Buy zone: 2.85–2.89 (support + trendline confluence)
Sell trigger: break and close below 2.85
Target: 3.20 within the upper boundary of the resistance zone
Buy trigger: bullish bounce from trendline and higher low confirmation
💡 Risks
Failure to hold above 2.88 support may invalidate the upward bias
Price volatility near trendline could trap early buyers
Rejection from 3.20 might trigger sharp retracement back to 2.70
If this idea resonates with you or you have your own opinion, traders, hit the comments. I’m excited to read your thoughts!

EURJPY SHORT DAILY FORECAST Q3 D4 W27 Y25EURJPY SHORT DAILY FORECAST Q3 D4 W27 Y25
Professional Risk Managers👋
Welcome back to another FRGNT chart update📈
Diving into some Forex setups using predominantly higher time frame order blocks alongside confirmation breaks of structure.
Let’s see what price action is telling us today! 👀
💡Here are some trade confluences📝
✅Daily Order block identified
✅4H Order Block identified
✅1H Order Block identified
🔑 Remember, to participate in trading comes always with a degree of risk, therefore as professional risk managers it remains vital that we stick to our risk management plan as well as our trading strategies.
📈The rest, we leave to the balance of probabilities.
💡Fail to plan. Plan to fail.
🏆It has always been that simple.
❤️Good luck with your trading journey, I shall see you at the very top.
🎯Trade consistent, FRGNT X

KWEB: China’s Internet Sector - AI Catch-Up and Cheap ValuationsChina’s internet and tech stocks have been hammered for years — regulatory crackdowns, slowing growth fears, and geopolitical tension have crushed sentiment. But as investors know, the best opportunities often hide in what everyone hates.
Enter KWEB, the KraneShares CSI China Internet ETF.
It’s a diversified, liquid way to play a bounce in major names like Alibaba, Tencent, JD .com, Baidu, Meituan and PDD.
Here’s why I think the risk/reward looks compelling now — especially if you believe in AI closing the gap.
Key Bullish Points:
1) Valuations at Rock-Bottom
Many big China internet stocks are still trading at single-digit P/E ratios, even as their cash flows recover. Compared to U.S. big tech trading at 30–50x, this is a huge valuation gap.
Regulatory fears seem largely priced in — Beijing wants growth, not stagnation, and some policies are easing.
2) China’s AI Push — Just “Months Behind”
Jansen Whang recently argued that China’s generative AI development is only “months behind” the U.S. Players like Baidu, Alibaba Cloud, Tencent, and SenseTime are all racing to launch new LLMs and integrated AI tools.
If you believe the gap closes, Chinese platforms could see a major earnings rebound as they roll out AI upgrades across search, cloud, e-commerce and social media.
3) Sentiment So Bad, It’s Good
When the headlines scream “China is uninvestable,” that’s often when big mean reversion trades set up. Even a small policy pivot, stimulus plan, or positive AI news cycle can spark a sharp rally.
KWEB is one of the cleanest ways to express this view because it holds a diversified basket — you don’t have to pick a single winner.

Lingrid | AUDUSD capitalizing on the BULLISH ContinuationOANDA:AUDUSD is forming higher lows above the key ascending trendline, showing clear signs of bullish structure continuation. After breaking out of the flag pattern and triangle, price is now consolidating just above the 0.6572 support zone. If buyers hold this level, a breakout toward the 0.6613 resistance area becomes increasingly likely.
📈 Key Levels
Buy zone: 0.6572–0.6580 (above trendline)
Sell trigger: break below 0.6572 trendline support
Target: 0.6613 resistance area
Buy trigger: bounce from trendline and continuation above minor resistance
💡 Risks
Failure to hold the ascending trendline may trigger deeper correction
Low volume during breakout attempts could invalidate the move
Strong resistance at 0.6613 may cause short-term rejection
If this idea resonates with you or you have your own opinion, traders, hit the comments. I’m excited to read your thoughts!

Lingrid | TONUSDT Market Bottom Established at Demand ZoneOKX:TONUSDT is rebounding from the April low near the 2.81 zone after holding a higher low structure above key support. Price remains compressed within a long-term consolidation, but the higher lows and recent bounce signal potential for a breakout attempt. A move toward the 3.28 level would test the major downward trendline and open the path toward the upper resistance range.
📈 Key Levels
Buy zone: 2.81–2.90 (above April low)
Sell trigger: rejection at 3.28 trendline resistance
Target: 3.28 breakout zone
Buy trigger: daily close above 3.28 confirms bullish reversal
💡 Risks
Repeated failure to break the trendline may reintroduce downside pressure
Momentum could stall without volume confirmation
Strong resistance between 3.28–3.40 may limit breakout attempts
If this idea resonates with you or you have your own opinion, traders, hit the comments. I’m excited to read your thoughts!

Lingrid | ETHUSDT Price Compression and Expansion PhasesBINANCE:ETHUSDT is struggling to hold gains after a rejection from the top of the range, with price retracing back toward the breakout point and key trendline support. The structure remains intact above 2,363, where bulls may attempt another rebound. A sustained move above the blue ascending trendline would open the way toward the 2,650 target, completing the projected rebound path.
📈 Key Levels
Buy zone: 2,363–2,400
Sell trigger: breakdown below 2,363
Target: 2,650
Buy trigger: breakout and retest of 2,475–2,500 with volume
💡 Risks
Failure to hold the trendline could push price toward 2,159
Weak follow-through may stall near 2,550
Bearish engulfing from current range top can trap early buyers
If this idea resonates with you or you have your own opinion, traders, hit the comments. I’m excited to read your thoughts!

Lingrid | PEPEUSDT Inverse Head and Shoulder. Bullish Reversal ?BINANCE:PEPEUSDT is forming a potential reversal setup after rebounding from the 0.00000876 support within a well-defined downward channel. Price action shows signs of accumulation with a right shoulder (RS) formation and a potential breakout brewing above the descending blue trendline. A clean push toward the 0.00001125 resistance would confirm the pattern and may trigger further upside toward the red trendline.
📈 Key Levels
Buy zone: 0.00000876–0.00000900
Sell trigger: failure below 0.00000876
Target: 0.00001125
Buy trigger: breakout and retest of 0.00000960–0.00000980
💡 Risks
Strong resistance from downward channel could limit upside
Breakout failure may trap buyers near 0.00000980
Low liquidity increases volatility risk near major levels
If this idea resonates with you or you have your own opinion, traders, hit the comments. I’m excited to read your thoughts!

Lingrid | GOLD Weekly Analysis: Risk-Off Trade Unwinds OANDA:XAUUSD endured another challenging week as the Iran-Israel ceasefire continued to diminish safe-haven demand, while robust equity market performance drew capital away from precious metals. The risk-on environment has fundamentally shifted investor priorities, with growth assets overshadowing traditional defensive plays like gold.
The chart reveals gold testing the crucial $3,270 support zone, representing a significant confluence level where the upward trendline intersects with horizontal support. This area has historically provided strong buying interest and serves as a critical inflection point for gold's medium-term direction.
From a broader perspective, the 4H chart shows gold approaching the lower boundary of its established upward channel around $3,250. The pullback from the HH near $3,450 has accelerated through multiple support levels, with the downward trendline acting as dynamic support to any recovery attempts.
A decisive break below the $3,235 - $3,250 support confluence could trigger further selling toward the $3,200 major support zone. However, the long-term upward trendline dating back several months provides substantial technical backing. A successful defense of current levels would likely attract value buyers and could spark a relief rally toward the $3,330-$3,350 resistance area, particularly if geopolitical tensions resurface or equity markets show signs of fatigue.
If this idea resonates with you or you have your own opinion, traders, hit the comments. I’m excited to read your thoughts!

Lingrid | CADJPY Potential Downside Move After BreakoutThe price perfectly fulfilled my previous idea . FX:CADJPY is facing continuous rejection from the descending trendline, maintaining its position within the downward channel. Price is struggling to hold above the 105.00 region, showing signs of distribution after a fake breakout and lower high formation. A sustained breakdown below 105.00 would confirm the bearish continuation targeting the 104.00–104.50 zone.
📉 Key Levels
Sell zone: 105.40–105.50
Buy trigger: breakout above 105.60 and retest
Target: 104.500
Sell trigger: confirmed break and close below 105.00
⚠️ Risks
False breakdown could lead to sharp recovery toward 106.20
Oversold conditions may slow downside near 104.50
Range re-accumulation above 105.00 could trap short-sellers
Thin liquidity around 104.20 might cause price spikes
If this idea resonates with you or you have your own opinion, traders, hit the comments. I’m excited to read your thoughts!

Lingrid | EURUSD Pullback - Continuation Trading OpportunityFX:EURUSD is consolidating above the upward trendline after forming a higher high and pulling back toward dynamic support. Price structure remains bullish within the rising channel, and a rebound from the 1.1640–1.1700 zone could trigger the next leg higher. If bulls regain momentum, the pair may aim for the 1.1850 resistance ceiling within the target area.
📈 Key Levels
Buy zone: 1.1640–1.1700
Sell trigger: breakdown below 1.1640
Target: 1.1850
Buy trigger: breakout and retest above 1.1750 with strong momentum
💡 Risks
Breakdown below the upward channel may signal a broader reversal
Weak bullish reaction from trendline could stall upside progress
Failure to reclaim 1.1750 resistance keeps price vulnerable to deeper pullbacks
If this idea resonates with you or you have your own opinion, traders, hit the comments. I’m excited to read your thoughts!

Lingrid | BNBUSDT breakout Setup. Preparing for Bullish Surge? BINANCE:BNBUSDT is facing strong resistance below the red descending trendline, repeatedly forming lower highs as it struggles to break above 650. The price is coiling between the 636 and 648 zones, hinting at a potential breakout or breakdown move. A clean rejection could drag price back to the 601 support area, while a surge above 650 opens the path toward 665.
📈 Key Levels
Buy zone: 636–640
Sell trigger: rejection from 648 or breakdown below 636
Target: 665
Buy trigger: breakout and close above 650 with volume
💡 Risks
Range continuation may trap breakout traders
Failure to hold 636 could accelerate downside
Resistance at 665 may cap bullish move short-term
If this idea resonates with you or you have your own opinion, traders, hit the comments. I’m excited to read your thoughts!
