Lingrid | GOLD Bear Channel Break: Short OpportunityOANDA:XAUUSD has broken down from the upward channel and is now trading below the key 3,321 level, which previously served as support. The price is forming a bearish structure beneath the black and blue trendlines, with 3,250 emerging as the next potential target. A minor relief bounce could retest 3,320, but rejection here would reinforce downside continuation.
📈 Key Levels
Sell zone: 3,315–3,330
Sell trigger: rejection below 3,321
Target: 3,250
Sell confirmation: breakdown from 3,285 with momentum
💡 Risks
False breakout above 3,321 could trap sellers
Weak bearish momentum may result in sideways chop
Re-entry into channel could negate bearish outlook
If this idea resonates with you or you have your own opinion, traders, hit the comments. I’m excited to read your thoughts!
Signalsprovider

Lingrid | USDCAD Support Level Bounce OpportunityThe price perfectly fulfilled my last idea . FX:USDCAD is attempting to stabilize after a sharp drop from the 1.3696 resistance area, approaching the lower boundary of the falling wedge pattern. The price is testing the 1.3600–1.3550 support band, aligned with the blue descending trendline and historical pivot zones. A bullish rebound here could push the pair back toward 1.3696, while failure to hold exposes 1.3500 and lower.
📈 Key Levels
Buy zone: 1.3550–1.3600
Sell trigger: breakdown below 1.3550
Target: 1.3696
Buy trigger: breakout and retest of 1.3625–1.3650 zone
💡 Risks
Bearish momentum continuation toward 1.3500 if bounce fails
Weak volume recovery may trap buyers near 1.3620
Rejection near descending red trendline can maintain bearish pressure
If this idea resonates with you or you have your own opinion, traders, hit the comments. I’m excited to read your thoughts!

Lingrid | TONUSDT April-May Low Fake BreakoutOKX:TONUSDT is recovering after a liquidity grab near the April–May lows, bouncing from the lower boundary of the descending channel. The current move is stabilizing inside the BUYING area, suggesting accumulation and possible breakout preparation. If the 2.77 support holds, price may rally toward the 3.00 psychological barrier. A deeper dip below 2.77 would negate the bullish setup and reintroduce downside risks.
📈 Key Levels
Buy zone: 2.75–2.80
Sell trigger: sustained close below 2.75
Target: 3.00
Buy trigger: breakout above 2.90 with volume
💡 Risks
Low demand at the base could stall recovery
Failure to break out of the downward channel weakens upside case
Price rejection near 2.90 may trap early buyers
If this idea resonates with you or you have your own opinion, traders, hit the comments. I’m excited to read your thoughts!

Lingrid | GOLD Potential Bullish Reversal TradeOANDA:XAUUSD is rebounding from key structure support after forming a double-leg corrective move inside an expanding triangle. Price has reclaimed the 3,324 zone, aligning with the trendline and support confluence, suggesting a short-term bullish bias. If this rebound sustains, gold could retest the 3,380 barrier before eyeing the 3,450 resistance ceiling. A rejection from mid-levels would reintroduce downside pressure toward the 3,246 zone.
📈 Key Levels
Buy zone: 3,320–3,330
Sell trigger: break below 3,324
Target: 3,450
Buy trigger: strong candle close above 3,380
💡 Risks
Weak volume could stall upside continuation
Failure to hold the trendline may drag price toward 3,246
Broader resistance zone between 3,380–3,450 could limit upside momentum
If this idea resonates with you or you have your own opinion, traders, hit the comments. I’m excited to read your thoughts!

Lingrid | GBPJPY pullback TRADE. Short from RESISTANCE zoneThe market is stalling below the 199 zone after a sharp breakout from the previous consolidation block. Price action remains inside an ascending channel, with the structure posting consistent higher lows and a clean bullish leg. However, the pair is now testing a key resistance area near 198.9, where previous highs and upper trendline pressure may trigger a correction. If rejection follows, a drop toward the 196.5-196.0 region remains likely before any further continuation.
📈 Key Levels
Buy zone: 196.0–196.5
Sell trigger: rejection at 199 resistance
Target: 199.9–200.5
Buy trigger: strong candle close above 199.0
💡 Risks
False breakout above 199 may trap late buyers
Lack of follow-through volume could weaken bullish momentum
Channel support breach may flip structure bearish
If this idea resonates with you or you have your own opinion, traders, hit the comments. I’m excited to read your thoughts!

Lingrid | EURCAD April High - Key Resistance Level TestThe price perfectly fulfilled my last idea . FX:EURCAD is extending its bullish leg after breaking out of both a triangle pattern and the downward trendline. The pair reached the 1.59500 resistance area and is now hovering within a broad supply zone where previous reactions occurred. Unless bulls force a sustained breakout, the price may revisit the 1.58060 support for reaccumulation.
📈 Key Levels
Sell zone: 1.59500 - 1.59700
Sell trigger: breakdown below 1.59000
Target: 1.58060
Buy trigger: above 1.57500
💡 Risks
False breakout from resistance could trap late buyers
Extended move may prompt short-term profit-taking
Break below the upward trendline weakens bullish momentum
If this idea resonates with you or you have your own opinion, traders, hit the comments. I’m excited to read your thoughts!

Why BABA Alibaba Could Rebound Strongly by Year-End 2025If you haven`t bought BABA before the recent rally:
What you need to know:
BABA’s fundamentals, fueled by e-commerce, cloud, and AI, support its technical bullishness:
E-commerce and Cloud Rebound:
Q1 2025 revenue grew 7% year-over-year, with Taobao/Tmall rebounding and cloud revenue surging due to AI demand.
Alibaba’s cloud division, China’s largest, benefits from hyperscaler AI workloads, with 15% profit margin projections by 2029.
AI Leadership:
BABA’s AI assistant and generative AI tools drove a 70% stock surge in early 2025, positioning it as a leader in China’s AI race.
At 12x forward P/E with 8% revenue CAGR, BABA is undervalued (fair value ~$162).
Share Buybacks:
Aggressive share repurchasing (6% annual reduction) boosts EPS, with $1 trillion GMV reinforcing e-commerce dominance.
Macro Tailwinds:
Easing CCP regulations and China’s stimulus measures (e.g., rate cuts) support BABA’s rally.
Minimal U.S. exposure insulates BABA from trade war risks.
Conclusion: BABA’s Path to $168
BABA’s technicals, with a bullish breaker and wedge, signal a breakout above $125–$130, targeting $150–$168 by year-end 2025. Fundamentally, its e-commerce dominance, cloud/AI growth, and undervaluation make it a standout. Traders should buy dips near $110–$115 or await a $130 breakout. With stimulus and buybacks as catalysts, BABA is set to soar.
Disclosure: I am part of Trade Nation's Influencer program and receive a monthly fee for using their TradingView charts in my analysis.

Dollar Index Analysis: Wedge + Powell Outlook – June 25, 2025📉 Technical Outlook: Bearish Rising Wedge + Liquidity Sweep Setup
TVC:DXY The Dollar Index (DXY) is currently trading within a rising wedge pattern, typically a bearish structure. We're anticipating a fake breakdown, potential sweep of the key demand zone, followed by a reversal move targeting key highs.
🔍 Key Technical Zones
📥 Demand Zone (Buy Area):
🔵 97.50 – 97.20 = Institutional accumulation + unfilled orders
🚫 Invalidation Level (Stop-Loss) :
❌ 96.70 = Clean break below confirms full bearish continuation
🎯 Target Projections (Upside Levels) :
TP1: 99.00
TP2: 100.00
TP3: 101.04 (HTF swing high liquidity cleanout)
🧠 Summary Setup :
Downtrend
Rising wedge formation
Sweep of 97.20 possible
Watch for fakeout & reversal play toward 101.04
🏛️ Fundamental Analysis – Powell’s Testimony Insights
Fed Chair Powell highlighted the following during his recent testimony:
🔄 “We’re not there yet on inflation” — Core services remain sticky
🛑 No immediate rate cuts — Growth is slowing but not crashing
🕰 Rate cuts likely postponed to Q4 2025
🔐 “Real rates are restrictive enough” = No more hikes expected
💡 Implication for DXY :
✅ Short-term bullish bias as higher U.S. yields remain attractive if rate cuts are delayed.
🌍 Macro Context Snapshot (as of June 25, 2025)
🇺🇸 US Disinflation: CPI & PCE easing, but not collapsing
🇪🇺 ECB Cut in June: Euro may weaken further
🇯🇵 BOJ Policy Unclear: USD/JPY likely volatile
🌐 Global Risk Appetite High: Volatility may return with geopolitical events
🔥 Watch This: Trade Tariff Narrative Heating Up
🚨 New U.S. Tariff Signals on Chinese tech and EU autos are resurfacing. This could:
Push inflation risk higher
Delay Fed’s easing timeline
Add support to USD short term as markets price in geopolitical tension and uncertainty
📌 Trading Strategy Recap :
Monitor wedge support near 97.20
Look for fakeout/sweep and bullish reversal
Target 99–101 zone on rebound
Stay alert to Powell/Fed rhetoric + tariff news
If you find this analysis helpful, Like, Comment, and Follow for more DXY, gold, and macro trades!

Lingrid | GOLD Retracement Entry Opportunity from Support ZoneOANDA:XAUUSD is attempting to stabilize after breaking below the consolidation zone and forming a new lower low near the 3,313 support. Price action hints at a bullish rebound setup, potentially targeting the 3,375 resistance aligned with the descending red trendline. The structure may shift if price forms a higher low and retests broken support as a springboard.
📈 Key Levels
Buy zone: 3,313 – 3,320
Sell trigger: break below 3,313
Target: 3,375
Buy trigger: higher low and breakout above minor resistance
💡 Risks
Failure to reclaim 3,313 could trigger another sell-off
Resistance trendline near 3,375 remains a rejection risk
Lack of volume confirmation may weaken bullish scenario
If this idea resonates with you or you have your own opinion, traders, hit the comments. I’m excited to read your thoughts!

Lingrid | EURUSD Short-Term Correction. Counter Trend SetupThe price perfectly fulfilled my previous idea . FX:EURUSD completed a full impulse move from the bottom, touching the upper resistance line while showing clear bearish divergence at recent highs. Price is now hovering near 1.16450, with early signs of weakness below the ascending blue trendline. A breakdown from this zone could confirm a reversal toward the 1.15585 support and potentially deeper if momentum builds.
📉 Key Levels
Sell zone: 1.1630 – 1.1650
Sell trigger: break below 1.1600
Target: 1.15525
Buy trigger: breakout and hold above 1.1650
⚠️ Risks
Divergence may take time to fully play out
Reclaiming 1.1650 would negate bearish setup
Consolidation near highs may trap early sellers
If this idea resonates with you or you have your own opinion, traders, hit the comments. I’m excited to read your thoughts!

Lingrid | HYPEUSDT potential Long After Correction in the MarketKUCOIN:HYPEUSDT is attempting to recover from a corrective dip, forming a higher low above the upward trendline and stabilizing near the 35.0 support zone. Price is currently testing a minor resistance and may confirm a bullish reversal if the structure builds a higher high above 38.5. A breakout toward the 42.0 level aligns with the projection, possibly extending into the 44.8 target area.
📈 Key Levels
Buy zone: 35.0 – 36.0
Sell trigger: break below 35.0
Target: 42.0 – 44.8
Buy trigger: bullish breakout from local structure
💡 Risks
Rejection below 38.5 may lead to further downside
Broad resistance near 42.0 could stall momentum
A breakdown of trendline support would invalidate the bullish setup
If this idea resonates with you or you have your own opinion, traders, hit the comments. I’m excited to read your thoughts!

GOLD XAUUSD TodayMy SSM Structure change to strong bearish
My view is on chart.
I expect move up a little bit but after this new low

GOLD XAUUSD TodayGOLD XAUUSD Today for me maybe finish down move
Next week I expect change direction to LoNG setups.
My target will be new high.

Lingrid | BTCUSDT potential Bullish Momentum after Fake BreakoutBINANCE:BTCUSDT just reclaimed the support area after a deep liquidity grab below 100,000, rebounding sharply toward the mid-range. Price is still trapped below the descending resistance trendline, but the recent fake break and reversal signal a bullish shift in momentum. If bulls hold above 100K, a breakout toward 105,000 looks increasingly probable.
📈 Key Levels
Buy zone: 99,000–100,500
Sell trigger: break below 99,000
Target: 105,000
Buy trigger: strong breakout above the descending blue trendline
💡 Risks
Retesting resistance at 105,000 may trigger a pullback
Descending structure still intact until breakout confirms
Sharp volatility spikes could invalidate short-term setups
If this idea resonates with you or you have your own opinion, traders, hit the comments. I’m excited to read your thoughts!

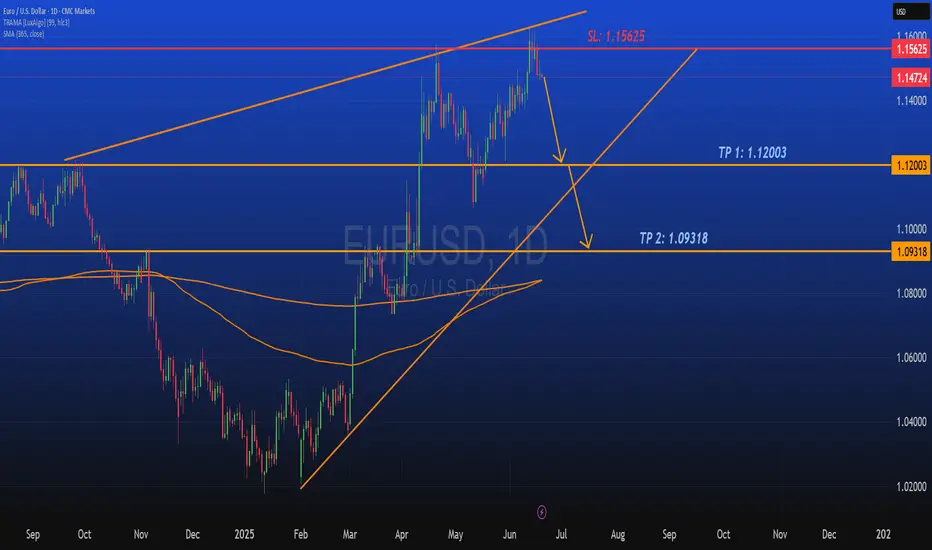
EURUSD Short Part IIEURUSD Analysis
On EURUSD daily chart from CMC Markets quota, indicates a bullish trend with a symmetrical triangle pattern forming. The price has recently broken above a key resistance level, suggesting potential for continued upward movement.
Key Price Levels
Current Price: 1.16932
Stop Loss (SL): 1.16549
Take Profit 1 (TP1): 1.12003
Take Profit 2 (TP2): 1.09318
Trend Analysis
EURUSD shows clear signs on an ascending trend supported by higher lows and higher highs since early 2025. Both orange trend-lines which I created form a symmetrical triangle, with the price nearing the apex, hinting at a potential breakout or reversal which I have been looking for a reversal bearish breakout.
The upward momentum is strong, but the proximity to the upper trend-line and set take-profit levels indicates preparation for a possible correction. I still believe in shorts on EURUSD.
Conclusion
Traders and investors should monitor the price action near the triangle apex for breakout confirmation. The set stop loss and take-profit levels provide a structured approach to managing the trade, balancing potential gains with risk mitigation. Stay tuned for more updates on the trade.

EURUSD Sell/ShortFundamental Analysis
EURUSD rates is being influenced by the current Eurozone's economic performance, driven by key economies like Germany and France, continues to be shaped by industrial output, consumer confidence, and inflation trends. The European Central Bank (ECB) has likely maintained a cautious monetary policy, with interest rates possibly held steady or adjusted slightly to combat inflation while supporting growth. On the U.S. side, the Federal Reserve's stance on interest rates, potentially in a tightening phase to address persistent inflation plays a critical role. Recent U.S. economic data, including GDP growth, employment figures, and consumer spending, may indicate a robust dollar, putting downward pressure on EURUSD. Additionally, geopolitical tensions, energy prices (affecting Eurozone energy imports), and trade balances between the U.S. and EU are likely contributing to volatility. Given the current date, recent ECB and Fed statements or data releases for June 2025 inflation reports.
Technical Analysis:
Based on the provided EURUSD 1D chart (covering mid-2024 to mid-2025), the following technical observations can be made:
Trend and Moving Averages:
For EURUSD it shows a descending trend from a peak around 1.48 in mid-2024, with a potential reversal or consolidation forming in mid-2025. The 50-day and 200-day moving averages (depicted as orange lines) are sloping downward, with the price recently testing these levels around 1.12-1.13. A break above the shorter-term moving average could signal bullish momentum, while a failure to hold might confirm a continuation of the downtrend. Looking for key support levels here are identified at 1.09318 (TP 2) and 1.08000, with the current price hovering near 1.12003 (TP 1). Resistance is notable at 1.15625 (SL) and the previous high near 1.4800. The price action suggests a potential bounce from the recent low, with the next target being the resistance zone around 1.15625 if bullish momentum persists. Candlesticks and volume patterns are showing a recent green candlesticks indicate buying pressure, potentially forming a reversal pattern near the 1.12 level. Volume analysis would confirm the strength of this move, with higher volume on upticks supporting a breakout.
Overall Bias:
The technical setup suggests a short-term bullish correction within a broader bearish trend, contingent on breaking and holding above 1.15625. A drop below 1.09318 would invalidate the bullish case and resume the downtrend toward 1.08000 or lower.
Sentiment Analysis
Market sentiment as of June 2025 likely reflects heightened interest in EUR/USD due to recent economic data and central bank policies. Traders and analysts are closely watching for signs of ECB rate cuts or Fed rate hikes, which could sway the pair. On social platforms and financial forums, there may be a mix of caution and optimism looking out for caution due to the Eurozone's economic challenges (energy costs, political uncertainty), and optimism if U.S. data softens, weakening the dollar. The chart's visibility on trading platforms suggests retail and institutional traders are actively monitoring this pair, with a focus on the 1.12-1.16 range as a critical decision point. Sentiment could shift rapidly based on upcoming economic releases or geopolitical developments.
Conclusion
The EUR/USD pair is at a pivotal juncture, with fundamentals pointing to a stronger USD due to Fed policy, while from a technical standpoint suggest a short-term bounce toward 1.15625 if support at 1.12003 holds. Sentiment indicates active trader interest, with eyes on central bank moves. A break above resistance could target 1.4800 (long-term), while a failure might see a decline to 1.08000. Monitor upcoming data for confirmation.
Lingrid | EURUSD Pullback - Awaiting Trend Continuation SignalFX:EURUSD is consolidating above the upward trendline after forming a triangle within the broader ascending channel. The recent pullback tested the 1.1444 support zone, with a rebound hinting at renewed bullish pressure. A push beyond 1.1620 could unlock upside toward the 1.1700 resistance mark.
📈 Key Levels
Buy zone: 1.1444–1.1470
Sell trigger: breakdown below 1.1444
Target: 1.16200
Buy trigger: breakout above 1.1523 resistance
💡 Risks
Triangle breakdown could shift the short-term bias bearish
Failure to reclaim 1.1620 may stall bullish momentum
A sharp drop below the black trendline would invalidate the structure
If this idea resonates with you or you have your own opinion, traders, hit the comments. I’m excited to read your thoughts!

Lingrid | AVAXUSDT strong REBOUND from the SUPPORT zoneCRYPTOCAP:AVAX is rebounding from the lower boundary of its descending channel after a deep sweep into the buying area near 17.00. The price formed a local bottom and is attempting to reclaim the 17.45–18.50 resistance band, hinting at early bullish intent. If buyers sustain this recovery, a test of the 20.00 psychological barrier could follow.
📈 Key Levels
Buy zone: 16.20–17.00
Sell trigger: breakdown below 15.80
Target: 20.00
Buy trigger: breakout and retest of 18.50 resistance
💡 Risks
Failure to break 18.50 may trap longs below key resistance
Breakdown from support invalidates current bullish setup
Broader downtrend still dominant unless 20.00 is reclaimed
If this idea resonates with you or you have your own opinion, traders, hit the comments. I’m excited to read your thoughts!

US30 TodayUS30 Today is still bearish
My SSM structure is still down
I'm waiting to open US and looking good entry

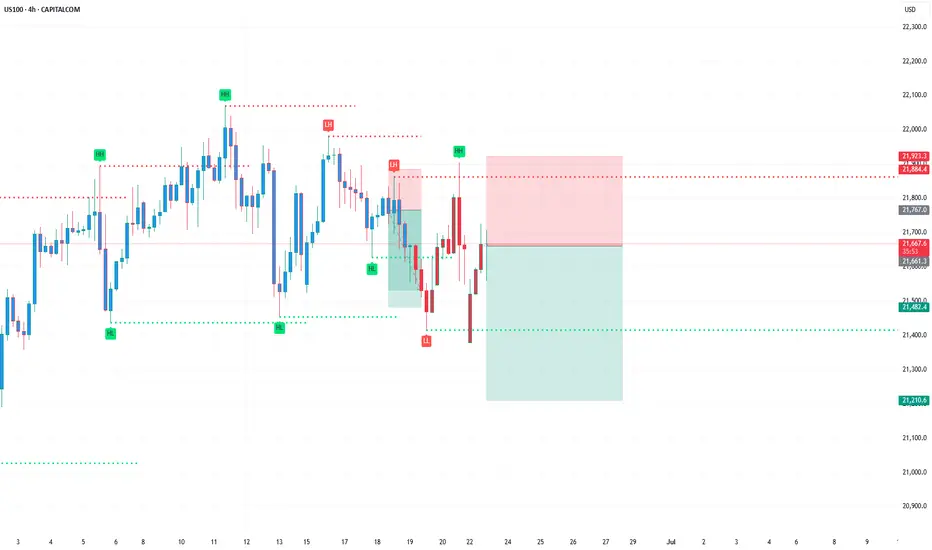
US100 / NASDAQ TodayUS100 Today is still bearish
My SSM structure is still down
I'm waiting to open US and looking good entry
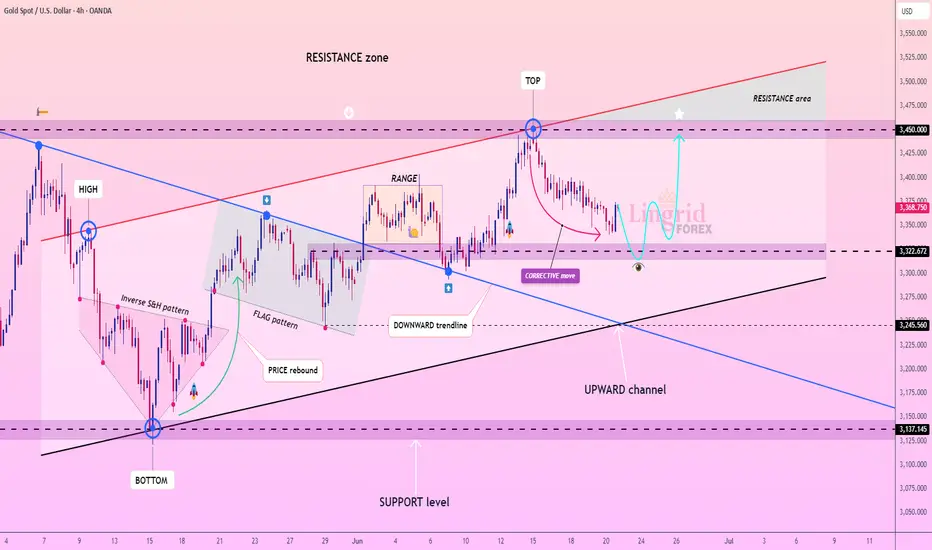
Lingrid | GOLD Weekly Outlook: Corrective Phase Tests SupportOANDA:XAUUSD experienced a notable pullback this week, retreating from the $3,450 resistance zone as profit-taking emerged following the recent geopolitical rally. The market appears to be entering a healthy corrective phase after the strong upward momentum driven by Middle Eastern tensions and safe-haven demand.
The 4H chart reveals gold testing the critical $3,320 support level, which coincides with the lower boundary of the established upward channel. This corrective move was anticipated after the sharp rally to the resistance area marked as "TOP" on the chart. The current price action suggests a natural retracement within the broader bullish structure.
Technically, the downward trendline from the recent high is being respected, indicating the correction may continue toward the $3,240-$3,270 range before finding stronger support. The flag pattern that previously drove the rally now serves as a reference point for this pullback phase.
Key levels to monitor include the $3,320 immediate support and the more substantial $3,200 level below. A decisive break below these supports could extend the correction further, while a bounce from current levels would reinforce the underlying bullish bias. The market remains within the broader upward channel, suggesting this correction is likely temporary before the next leg higher toward the resistance zone above $3,450.
Traders, if you liked this idea or if you have your own opinion about it, write in the comments.
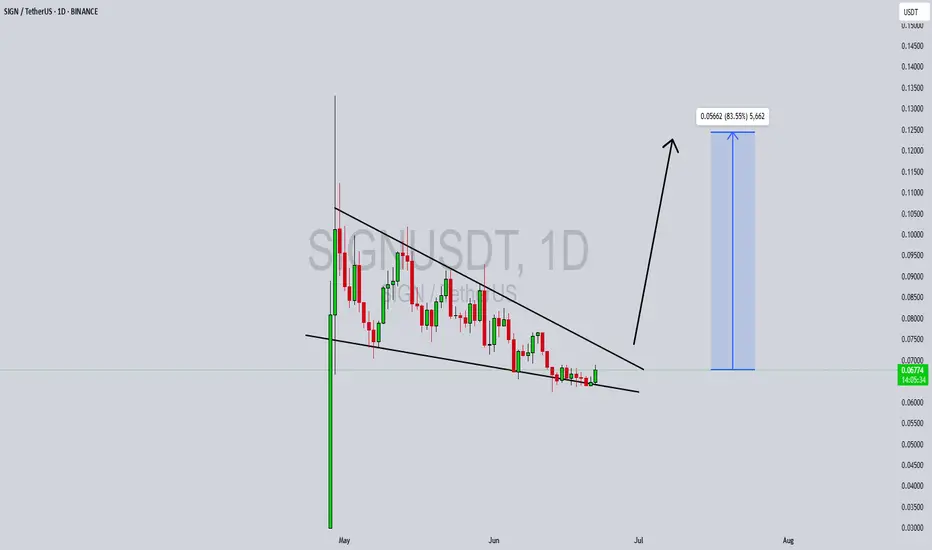
SIGNUSDT Forming Falling Wedge SIGNUSDT is currently forming a textbook Falling Wedge Pattern, a bullish chart formation that often signals the end of a downtrend and the start of a breakout rally. This pattern is becoming increasingly visible on the daily chart, with price action narrowing and volatility decreasing—setting the stage for a potential breakout. With consistent volume holding up during this consolidation phase, the conditions are aligning well for a strong move upward.
Technical traders will recognize that falling wedge breakouts are often accompanied by high-percentage gains, and in the case of SIGNUSDT, projections are targeting a 70% to 80% move to the upside. This bullish outlook is supported not only by the structure of the chart but also by the growing interest from retail and institutional investors who are gradually accumulating this asset at current levels. The breakout zone appears imminent, and traders are beginning to position accordingly.
Investor sentiment around SIGNUSDT is shifting, particularly as the broader altcoin market shows signs of recovery. The wedge formation suggests that bears are losing momentum while bulls are preparing for a push. This is often a precursor to aggressive price expansion once resistance is broken—potentially drawing in volume and market interest quickly. The risk-to-reward ratio here is favorable, especially for swing and breakout traders watching for emerging opportunities.
As more crypto assets begin to form bullish reversal setups, SIGNUSDT stands out as one of the most technically sound charts at the moment. Traders looking for well-defined entries based on proven patterns will find SIGNUSDT’s setup particularly appealing.
✅ Show your support by hitting the like button and
✅ Leaving a comment below! (What is You opinion about this Coin)
Your feedback and engagement keep me inspired to share more insightful market analysis with you!
Lingrid | XRPUSDT sideways MOVEMENT ContinuesBINANCE:XRPUSDT is consolidating within a defined horizontal channel, currently sitting just above the 2.06 support after multiple fake breaks and failed attempts at a higher high. A bullish rebound from this zone could launch price back toward the descending resistance trendline. The 2.2240 level marks a key reaction point that may cap any breakout attempt short-term.
📈 Key Levels
Buy zone: 2.05–2.10
Sell trigger: breakdown below 2.05
Target: 2.22
Buy trigger: confirmation bounce above 2.10
💡 Risks
Sideways consolidation may extend, delaying breakout
Strong rejection near 2.22 trendline could trigger reversal
Break below 1.9730 confirms bearish continuation
Traders, if you liked this idea or if you have your own opinion about it, write in the comments. I will be glad 👩💻
