SPY/QQQ Plan Your Trade For 5-28 : Inside Breakaway PatternToday's Inside-Breakaway pattern suggests the markets may attempt to rally above yesterday's close on strong news or earnings. Today is the NVDA earnings day (after the close). I suspect trading will be somewhat flat ahead of these highly anticipated earnings.
Traders would be smart to position into a HEDGE ahead of the NVDA earnings this afternoon.
Obviously, if the earnings are good, the markets will react to the upside. If they are poor/weak, the markets could easily move aggressively downward.
All I know is the tariff moves over the past few weeks pushed gamers and others into buying high-end graphics cards back in April/May because everyone thought prices would skyrocket 30-50% or more. So, maybe NVDA will report strong revenue while costs increase.
It should be an interesting day after the close. Until then, I believe the markets will stay somewhat FLAT - anticipating NVDA data/comments.
Gold and Silver are still working through the FLAG APEX. Silver is already beyond the FLAG APEX and could make a big move higher at any moment. Gold still has one small downward price move to complete before the FLAGGING pattern is complete.
Overall, I believe Gold and Silver are forming a solid base near $3300/$33 for a strong rally in the future.
BTCUSD is stalling. In fact, the SPY/QQQ/BTCUSD are all stalling near the 0.75% Fib level (as shown on my charts). We may be setting up for that big breakdown I've been warning about. But, until we actually SEE price break out of the upward EPP Flagging channel - don't get overly confident of a BIG BREAKDOWN move.
My advice would be to HEDGE any aggressive trades you are trying to take right now. If you believe the markets are going to rally substantially, try to hedge that trade with some risk protection (longer-dated PUTS).
Today could be a catalyst day. We may get a breakout/breakdown move after NVDA's earnings/data.
Buckle up.
Get some.
#trading #research #investing #tradingalgos #tradingsignals #cycles #fibonacci #elliotwave #modelingsystems #stocks #bitcoin #btcusd #cryptos #spy #gold #nq #investing #trading #spytrading #spymarket #tradingmarket #stockmarket #silver
Silver

Short-Term Key Levels for Silver as Price ContractsSilver has been contracting over the last couple of days. While the gold/silver ratio remains at historically high levels, ongoing risks in global trade and manufacturing provide strong justification for this imbalance.
In the short term, unless XAGUSD breaks above the 33.45 resistance, the direction may remain to the downside. The 200-hour moving average—often used as both support and resistance—can be followed as the next key short-term target. If this moving average is broken, bearish pressure could intensify.
For upward moves, a breakout above 33.45 could open the way toward 33.55 and 33.70 levels.

SILVER: Target Is Down! Short!
My dear friends,
Today we will analyse SILVER together☺️
The price is near a wide key level
and the pair is approaching a significant decision level of 33.092 Therefore, a strong bearish reaction here could determine the next move down.We will watch for a confirmation candle, and then target the next key level of 32.856.Recommend Stop-loss is beyond the current level.
❤️Sending you lots of Love and Hugs❤️

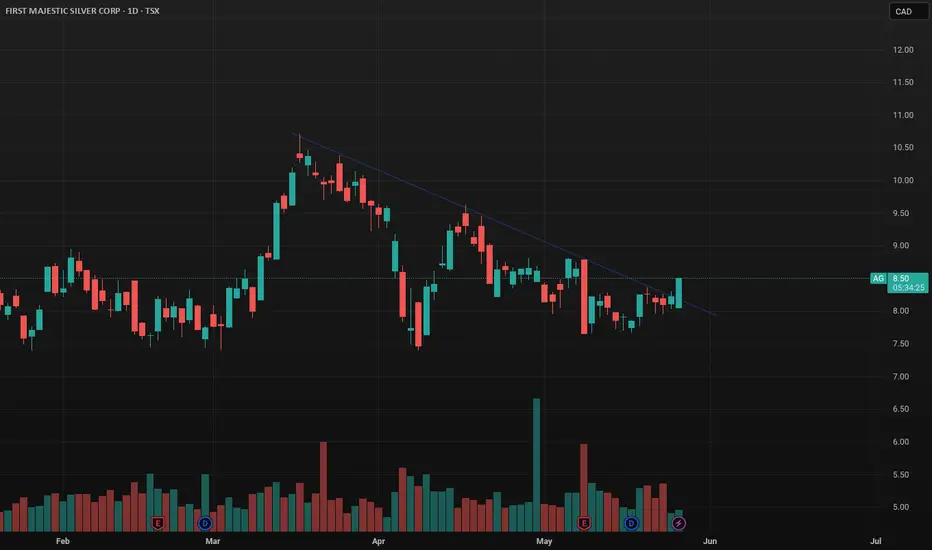
First Majestic Silver is breaking out todayFirst Majestic may be breaking out today from a trend that started on March 18, 2025. Good volume on the hourly time frame for that pump.
SPY/QQQ Plan Your Trade For 5-27-25 : Blank PatternToday's SPY Cycle Pattern is BLANK. This suggests the market will trend similarly to what we've seen over the past few days - likely melting upward.
A BLANK pattern is a price structure I have not identified as some type of price structure yet. I will check the data to see if I can find anything that correlates with this pattern throughout today.
Generally, we are rolling into a consolidation phase that may attempt to break higher or continue consolidating and roll downward.
Overall, the alignment with the Fibonacci trigger levels suggests the markets will continue to struggle near the ranges I've shown on my charts.
Gold and Silver are rolling downward - likely as a result of the EU tariff pause. That move to pause EU tariffs takes quite a bit of pressure off the metals markets.
I do believe the Gold/Silver will continue to try to rocket higher - but this week metals may stay somewhat flat and trend downward a bit.
BTCUSD is setting up a MASSIVE Excess Phase Peak pattern. This is a very big price rotation that could either INVALIDATE (upward) or CONFIRM (downward). If we get confirmation, BTCUSD could fall back below $75k very easily. If we get invalidation, the sky is the limit to the upside.
Ultimately, I believe the global markets need another 60-90+ days to settle with all the global trade/tariff and other issues before moving into a more bullish price trend.
We'll see if I'm right or not over the next 60-90+ days.
Get some.
#trading #research #investing #tradingalgos #tradingsignals #cycles #fibonacci #elliotwave #modelingsystems #stocks #bitcoin #btcusd #cryptos #spy #gold #nq #investing #trading #spytrading #spymarket #tradingmarket #stockmarket #silver

SILVER SHORT FROM RESISTANCE
SILVER SIGNAL
Trade Direction: short
Entry Level: 3,288.2
Target Level: 3,157.4
Stop Loss: 3,374.6
RISK PROFILE
Risk level: medium
Suggested risk: 1%
Timeframe: 12h
Disclosure: I am part of Trade Nation's Influencer program and receive a monthly fee for using their TradingView charts in my analysis.
✅LIKE AND COMMENT MY IDEAS✅

SILVER Buyers In Panic! SELL!
My dear friends,
Please, find my technical outlook for SILVER below:
The price is coiling around a solid key level - 33.484
Bias - Bearish
Technical Indicators: Pivot Points Low anticipates a potential price reversal.
Super trend shows a clear sell, giving a perfect indicators' convergence.
Goal - 32.948
Safe Stop Loss - 33.744
About Used Indicators:
The pivot point itself is simply the average of the high, low and closing prices from the previous trading day.
Disclosure: I am part of Trade Nation's Influencer program and receive a monthly fee for using their TradingView charts in my analysis.
———————————
WISH YOU ALL LUCK

Silver Slips to $33.31 on Profit-TakingSilver eased to $33.31 per ounce, pulling back slightly as investors booked profits after recent gains. The retreat came even as the dollar remained weak and geopolitical tensions, including the conflict in Ukraine, persisted. While momentum slowed, physical demand, especially from Asia, continues to provide a firm base for silver.
Support is at $32.30, with resistance at $33.80. Additional levels include $34.20 and $34.90 above, and $31.40 and $30.20 below.

Silver M15 I Bearish Drop Based on the H4 chart analysis, we can see that the price is reading near our sell entry at 33.38, a pullback resistance close to the 50% Fibonacci retracement.
Our take profit will be at 33.24, an overlap support.
The stop loss will be placed at 33.53, which is a swing-high resistance.
High Risk Investment Warning
Trading Forex/CFDs on margin carries a high level of risk and may not be suitable for all investors. Leverage can work against you.
Stratos Markets Limited (tradu.com ):
CFDs are complex instruments and come with a high risk of losing money rapidly due to leverage. 63% of retail investor accounts lose money when trading CFDs with this provider. You should consider whether you understand how CFDs work and whether you can afford to take the high risk of losing your money.
Stratos Europe Ltd (tradu.com ):
CFDs are complex instruments and come with a high risk of losing money rapidly due to leverage. 63% of retail investor accounts lose money when trading CFDs with this provider. You should consider whether you understand how CFDs work and whether you can afford to take the high risk of losing your money.
Stratos Global LLC (tradu.com ):
Losses can exceed deposits.
Please be advised that the information presented on TradingView is provided to Tradu (‘Company’, ‘we’) by a third-party provider (‘TFA Global Pte Ltd’). Please be reminded that you are solely responsible for the trading decisions on your account. There is a very high degree of risk involved in trading. Any information and/or content is intended entirely for research, educational and informational purposes only and does not constitute investment or consultation advice or investment strategy. The information is not tailored to the investment needs of any specific person and therefore does not involve a consideration of any of the investment objectives, financial situation or needs of any viewer that may receive it. Kindly also note that past performance is not a reliable indicator of future results. Actual results may differ materially from those anticipated in forward-looking or past performance statements. We assume no liability as to the accuracy or completeness of any of the information and/or content provided herein and the Company cannot be held responsible for any omission, mistake nor for any loss or damage including without limitation to any loss of profit which may arise from reliance on any information supplied by TFA Global Pte Ltd.
The speaker(s) is neither an employee, agent nor representative of Tradu and is therefore acting independently. The opinions given are their own, constitute general market commentary, and do not constitute the opinion or advice of Tradu or any form of personal or investment advice. Tradu neither endorses nor guarantees offerings of third-party speakers, nor is Tradu responsible for the content, veracity or opinions of third-party speakers, presenters or participants.

XAGUSD: Wait for a clear breakout to buy.Silver turned bullish on its 1D technical outlook (RSI = 57.038, MACD = 0.169, ADX = 26.102) but that alone isn't enough to turn us into buyers again just yet, as the Channel Up on the 4H timeframe has failed so far twice to break over the R1 level. If it does, then we will turn bullish, aiming for a +5.75% rise from the last 4H MA50 contact with TP = 34.4500.
See how our prior idea has worked out:
## If you like our free content follow our profile to get more daily ideas. ##
## Comments and likes are greatly appreciated. ##

Silver Continues to Face Broad Lateral ChannelOver the past five trading sessions, silver has managed to sustain a significant short-term bullish move, posting a steady gain of just over 4%. The current bullish bias has remained relatively consistent, as global risk perception stays elevated, mainly due to the ongoing back-and-forth of the trade war.
In his recent comments, President Trump announced that he might impose tariffs of up to 50% on European products if negotiations failed to progress quickly. Although a temporary truce has been reached following this statement, the European Union may continue preparing countermeasures in case no concrete agreement is achieved.
In this context, silver plays a crucial role, as XAG/USD is widely regarded as one of the quintessential safe-haven assets. As global economic risk perception—tied to the growing trade conflict—continues to rise, silver will likely attract enough capital to sustain steady buying pressure.
Additionally, it's important to note that the U.S. dollar is currently showing marked weakness against its major peers. If this weakness persists, buying pressure on silver could become even more relevant in upcoming sessions, provided these macroeconomic factors remain in place.
Broad Lateral Channel:
Since October 2024, silver has remained within a broad lateral channel between resistance at $34.43 and support at $30.38. Recently, a short-term bullish trend has begun to form, although buying momentum still seems insufficient to break out of this range. Therefore, this remains the most important technical pattern to monitor in the short term. As long as the top of the channel holds, it could serve as a key level triggering pullbacks in the current buying trend.
RSI:
Although the RSI line has started to rise steadily, it remains close to the neutral 50 level, suggesting equilibrium between buying and selling forces in the market. As long as the RSI continues to hover around this level, such neutrality may start to weigh on the current upward trend.
ADX:
The ADX line remains below the 20 mark, indicating that average volatility in recent movements is not decisive. This may signal that a phase of persistent neutrality is reemerging in the short term.
Key Levels to Watch:
$32.75 – Near-term resistance marked by the 50-period moving average. This level could serve as a barrier in case of downside corrections.
$31.45 – A critical support level, aligned with the 200-period moving average. Selling movements reaching this area could invalidate the ongoing bullish setup.
$34.43 – Main resistance, representing the upper boundary of the broad lateral range. Breakouts above this level would reinforce a stronger bullish bias.
Written by Julian Pineda, CFA – Market Analyst

SILVER: Strong Growth Ahead! Long!
My dear friends,
Today we will analyse SILVER together☺️
The market is at an inflection zone and price has now reached an area around 33.383 where previous reversals or breakouts have occurred.And a price reaction that we are seeing on multiple timeframes here could signal the next move up so we can enter on confirmation, and target the next key level of 33.469.Stop-loss is recommended beyond the inflection zone.
❤️Sending you lots of Love and Hugs❤️

SILVER Will Move Higher! Buy!
Here is our detailed technical review for SILVER.
Time Frame: 1D
Current Trend: Bullish
Sentiment: Oversold (based on 7-period RSI)
Forecast: Bullish
The market is trading around a solid horizontal structure 3,333.6.
The above observations make me that the market will inevitably achieve 3,538.8 level.
P.S
Overbought describes a period of time where there has been a significant and consistent upward move in price over a period of time without much pullback.
Disclosure: I am part of Trade Nation's Influencer program and receive a monthly fee for using their TradingView charts in my analysis.
Like and subscribe and comment my ideas if you enjoy them!

SHORT ON SILVERSilver is coming off a lower high and looks like it will start its run push to go and break previous lows to the downside.

Skeptic | Silver (XAG/USD): Bullish Breakout Ready to Surge?Hey everyone, Skeptic here! Let’s dive into a quick Silver (XAG/USD) update—I’m catching some serious bullish vibes! 😎
On the 4-hour chart , Silver’s teasing a major resistance level right now. Keep your eyes locked on 33.68855 . If we break and hold above it, we could see a nice rally kick off. You can also use RSI hitting overbought to confirm that bullish momentum is heating up. Just stay patient and wait for that breakout confirmation to ride the wave! 👀 By the way, for you forex traders out there, what’s your go-to alternative to volume, which is super key in crypto? Drop your thoughts in the comments so we can learn together! 📝
💬 Let’s Chat!
If this sparks some trading ideas, give it a quick boost—it means a lot! 😊 Want me to dive into another pair or setup? Drop it in the comments. Thanks for hanging out—keep trading sharp! ✌️

Silver Consolidates After Huge Drop – Breakout Ahead?At the beginning of April, XAGUSD experienced a dramatic decline, losing over 5,000 pips in just three trading days — a drop of more than 15% of its value.
However, after bottoming out on Monday, April 7, the price staged a sharp rebound and, within a week, was back around the 33.00 level.
📉➡️📈 From Panic to Pause – What’s Next?
For more than a month now, Silver has been trading in a tight range, between just under 32.00 and slightly above 33.00.
This consolidation forms a rectangle pattern, which is typically a continuation structure in technical analysis.
With this in mind, I expect further upside from Silver. A clean breakout above the current range could send the price toward the 35.00 zone — and possibly beyond this psychological level.
📊 Trading Plan:
As long as the 32.00 support holds, I remain bullish and will look to buy dips, aiming for a positive risk-reward setup, ideally around 1:2.
🧠 Consolidation breeds momentum — don’t sleep on Silver. If the genuine breakout comes, it could be explosive. 🚀
Disclosure: I am part of Trade Nation's Influencer program and receive a monthly fee for using their TradingView charts in my analyses and educational articles.

Silver H4 I Bullish Bounce Off Based on the H4 chart analysis, price could fall toward our buy entry at 133.05, which is a pullback support.
Our take profit will be at 34.26, which is a pullback resistance that aligns close to the 161.8% Fibonacci extension.
The stop loss will be placed at 32.54, a pullback support.
High Risk Investment Warning
Trading Forex/CFDs on margin carries a high level of risk and may not be suitable for all investors. Leverage can work against you.
Stratos Markets Limited (tradu.com ):
CFDs are complex instruments and come with a high risk of losing money rapidly due to leverage. 63% of retail investor accounts lose money when trading CFDs with this provider. You should consider whether you understand how CFDs work and whether you can afford to take the high risk of losing your money.
Stratos Europe Ltd (tradu.com ):
CFDs are complex instruments and come with a high risk of losing money rapidly due to leverage. 63% of retail investor accounts lose money when trading CFDs with this provider. You should consider whether you understand how CFDs work and whether you can afford to take the high risk of losing your money.
Stratos Global LLC (tradu.com ):
Losses can exceed deposits.
Please be advised that the information presented on TradingView is provided to Tradu (‘Company’, ‘we’) by a third-party provider (‘TFA Global Pte Ltd’). Please be reminded that you are solely responsible for the trading decisions on your account. There is a very high degree of risk involved in trading. Any information and/or content is intended entirely for research, educational and informational purposes only and does not constitute investment or consultation advice or investment strategy. The information is not tailored to the investment needs of any specific person and therefore does not involve a consideration of any of the investment objectives, financial situation or needs of any viewer that may receive it. Kindly also note that past performance is not a reliable indicator of future results. Actual results may differ materially from those anticipated in forward-looking or past performance statements. We assume no liability as to the accuracy or completeness of any of the information and/or content provided herein and the Company cannot be held responsible for any omission, mistake nor for any loss or damage including without limitation to any loss of profit which may arise from reliance on any information supplied by TFA Global Pte Ltd.
The speaker(s) is neither an employee, agent nor representative of Tradu and is therefore acting independently. The opinions given are their own, constitute general market commentary, and do not constitute the opinion or advice of Tradu or any form of personal or investment advice. Tradu neither endorses nor guarantees offerings of third-party speakers, nor is Tradu responsible for the content, veracity or opinions of third-party speakers, presenters or participants.

SILVER WILL FALL|SHORT|
✅SILVER has retested a key resistance level around 33.60$
And as the pair is already making a bearish pullback
A move down to retest the demand level below at 33.30$ is likely
SHORT🔥
✅Like and subscribe to never miss a new idea!✅
Disclosure: I am part of Trade Nation's Influencer program and receive a monthly fee for using their TradingView charts in my analysis.

BRIEFING Week #21 : Watch out for ComoditiesHere's your weekly update ! Brought to you each weekend with years of track-record history..
Don't forget to hit the like/follow button if you feel like this post deserves it ;)
That's the best way to support me and help pushing this content to other users.
Kindly,
Phil

SILVER: Short Signal Explained
SILVER
- Classic bearish setup
- Our team expects bearish continuation
SUGGESTED TRADE:
Swing Trade
Short SILVER
Entry Point - 33.484
Stop Loss - 33.753
Take Profit - 32.948
Our Risk - 1%
Start protection of your profits from lower levels
Disclosure: I am part of Trade Nation's Influencer program and receive a monthly fee for using their TradingView charts in my analysis.
❤️ Please, support our work with like & comment! ❤️

SILVER 1DA possible scenario for silver on the daily timeframe involves buying from the levels of 30.90-31.00 with further targets at 33.02, 34.8291 and the expected completion of the rounding pattern with a subsequent movement to the zone 40.0251
Everything is clearly depicted on the graph!
Have a good day!

SPY/QQQ Plan Your Trade EOD Update : Memorial Weekend RisksThis EOD update is to help you try to position for the risks associated with a further breakdown in price trends over the lone Memorial Day weekend.
I know this video will be posted late in the day - but I want you to learn how to hedge against risks and try to learn to take your profits when they are THERE.
This is a really quick video.
Stay safe this weekend and thank you to all our VETS for your service and sacrifices.
We honor you this weekend.
GET SOME.
#trading #research #investing #tradingalgos #tradingsignals #cycles #fibonacci #elliotwave #modelingsystems #stocks #bitcoin #btcusd #cryptos #spy #gold #nq #investing #trading #spytrading #spymarket #tradingmarket #stockmarket #silver

SILVER: Local Bearish Bias! Short!
My dear friends,
Today we will analyse SILVER together☺️
The market is at an inflection zone and price has now reached an area around 33.327 where previous reversals or breakouts have occurred.And a price reaction that we are seeing on multiple timeframes here could signal the next move down so we can enter on confirmation, and target the next key level of 33.210.Stop-loss is recommended beyond the inflection zone.
❤️Sending you lots of Love and Hugs❤️
