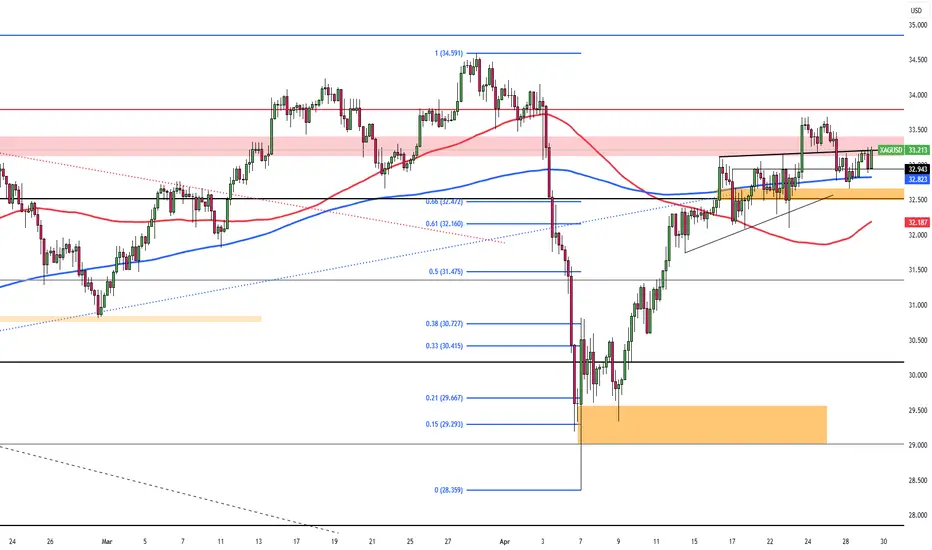
SILVER - BEARISH SCENARIOHello Traders !
The Silver price failed to create a new higher high !
Let's expect the bearish scenario:
If the market breaks the higher low and closes below that,
We will see a bearish move📉
TARGET: 31.23🎯
Silver

GOLD - FVG-Based Long & Short Setup Within Range ContextPrice action remains range-bound with well-defined FVG zones acting as both support and resistance, offering reactive trading opportunities on both sides.
---
1. Upper FVG as Resistance — Short Setup Trigger Zone
The highlighted upper green zone marks:
- Fair Value Gap (FVG): A clear inefficiency from the previous bearish impulse.
- Structural Significance: Price has struggled to break and hold above, showing signs of supply reactivation.
This zone is likely to attract sellers upon revisit, offering a clean risk-defined short opportunity.
---
2. Lower FVG as Support — Long Setup Zone
The lower blue zone serves as:
- FVG Rebalance Area: A region where price previously left inefficiency, now acting as strong support.
- Accumulation Interest: Smart money often reloads in such imbalanced areas on retests.
This zone is optimal for positioning into the next bullish leg should price dip lower.
---
3. Liquidity Sweep Mechanics — Trap Both Sides
The market structure hints at:
- Step 1: Induce buyers into breakout longs into resistance.
- Step 2: Reverse from FVG, triggering short entries and trapping longs.
- Step 3: Collect liquidity from lower range, potentially initiating new accumulation.
This movement pattern is characteristic of engineered liquidity grabs in both directions.
---
4. Mid-Range Reaction — Key Pivot Area
Price currently hovers around the mid-range zone:
- Serving as a temporary balance point before volatility expansion.
- Acting as a launchpad for the next impulsive move, depending on order flow dominance.
Patience here is key — waiting for clean confirmations near FVGs provides optimal entry quality.
---
5. Summary:
- Upper FVG Resistance → Short Bias
- Lower FVG Support → Long Bias
- Structured Reactions Around Imbalances Suggest Smart Money Activity
This is a dual-sided setup ideal for reaction-based traders awaiting price confirmation at extremes.

SPY/QQQ Plan Your Trade Update For 4-30 : Moving Into FlaggingThis quick update video should help you understand how my May 2-5 Major Bottom pattern could represent a move into FLAGGING within an inverted EPP pattern.
If my research is correct, the next move for the market will be a moderate downward price trend that will represent the FLAGGING portion of the inverted EPP pattern.
You've all see how bullish EPP patterns play out over the past 3 to 5+ months. Now we get to see how this recent SPY low near 480 turns into an inverted EPP pattern. This is basically the same pattern - but forming in an inverted mode.
As we transition through this inverted EPP pattern, what I'm looking for is a breakdown move to create the new FLAGGING formation. This move aligns perfectly with my May 2-5 Major Bottom pattern and could be a perfect setup for the attempted "breaking of the Flag High" in late May 2025.
I'm watching Gold and Silver stay relatively strong today. So I'm seeing today's market move as a "reversion move" - not really a breakdown move (yet).
It will be interesting to see how this plays out.
If the markets move into Flagging, as I expect, the big opportunities will be to ride the Flagging & Breakdown patterns over the next 30+ days before we move into either an INVALIDATION or CONTINUATION phase of the inverted EPP pattern.
Price is the ultimate indicator - you just need to know what to look for.
Get some.
#trading #research #investing #tradingalgos #tradingsignals #cycles #fibonacci #elliotwave #modelingsystems #stocks #bitcoin #btcusd #cryptos #spy #gold #nq #investing #trading #spytrading #spymarket #tradingmarket #stockmarket #silver

SILVER: Strong Growth Ahead! Long!
My dear friends,
Today we will analyse GOLD together☺️
The in-trend continuation seems likely as the current long-term trend appears to be strong, and price is holding above a key level of 32.688 So a bullish continuation seems plausible, targeting the next high. We should enter on confirmation, and place a stop-loss beyond the recent swing level.
❤️Sending you lots of Love and Hugs❤️

SPY/QQQ Plan Your Trade For 4-30 : Carryover PatternToday's Carryover pattern suggests the markets may attempt to trend slightly upward after the big downward pressure/GAP sets up this morning.
As many of you are already aware, I have been predicting a May 2-5 Major Bottom in the markets.
I would suggest today's carryover pattern may be negated by an early breakdown in the markets. If my May 2-5 Major Bottom pattern is going to show up, the markets would likely start to break downward today and tomorrow - leading to the Major CRUSH pattern on Friday.
Gold and Silver appear to be consolidating into a flagging/cradle pattern. I believe the downward pressure on the markets will likely prompt a flush-out low in metals before another big rally phase sets up.
BTCUSD is stalling and will likely pull downward as my May 2-5 Major Bottom pattern plays out.
Basically, HEDGE your positions.
This market looks like it will roll into a moderate low over the next 4-5+ days, then base and bottom after May 10th or so.
As I've suggested, I positioned for this move about 4-5 days ago. Now, I just need to ride it out and start booking profits when they happen.
Get some.
#trading #research #investing #tradingalgos #tradingsignals #cycles #fibonacci #elliotwave #modelingsystems #stocks #bitcoin #btcusd #cryptos #spy #gold #nq #investing #trading #spytrading #spymarket #tradingmarket #stockmarket #silver

Silver - Expecting Retraces Before Prior Continuation LowerH1 - Strong bearish momentum
Lower lows on the moving averages of the MACD indicator.
Expecting retraces and further continuation lower until the two Fibonacci resistance zones hold.
If you enjoy this idea, don’t forget to LIKE 👍, FOLLOW ✅, SHARE 🙌, and COMMENT ✍! Drop your thoughts and charts below to keep the discussion going. Your support helps keep this content free and reach more people! 🚀
--------------------------------------------------------------------------------------------------------------------
Disclosure: I am part of Trade Nation's Influencer program and receive a monthly fee for using their TradingView charts in my analysis.

SILVER BEARISH BIAS RIGHT NOW| SHORT
SILVER SIGNAL
Trade Direction: short
Entry Level: 3,321.1
Target Level: 3,263.1
Stop Loss: 3,359.8
RISK PROFILE
Risk level: medium
Suggested risk: 1%
Timeframe: 2h
Disclosure: I am part of Trade Nation's Influencer program and receive a monthly fee for using their TradingView charts in my analysis.
✅LIKE AND COMMENT MY IDEAS✅

SPY/QQQ Plan Your Trade For 4-29 : BreakAway in CarryoverToday's pattern is a Breakaway in Carryover mode.
That suggests today's price move will attempt to break away from yesterday's body range and may be somewhat similar to yesterday's price action.
I interpret this pattern as a potential breakdown (breakaway) attempting to possibly find support below 540.
Remember, we are moving into the May 2-5 Major Low cycle pattern - so price should attempt to move downward at this stage.
Gold and Silver are moving through a consolidated topping phase. Where price attempts to push higher through a series of tops. Ultimately, I believe Gold and Silver will make a big breakout move higher (above $3500, $35.00) and attempt to rally up - breaking the $4200+ level (eventually).
Bitcoin seems to be stalling, like the SPY/QQQ, near upper resistance (near the FIB 50% level).
I see this stalling as the markets searching for a trend.
As I keep saying, I have a hard time seeing any reason why the markets will rally to new ATHs in the current environment (except the possibility of pure speculation).
We need to see some real growth expectations for the markets to begin another big rally phase.
Right now, I'm looking for confirmation of my breakdown into the May 2-5 Major Bottom pattern. Let's see if that actually happens or not.
Get some.
#trading #research #investing #tradingalgos #tradingsignals #cycles #fibonacci #elliotwave #modelingsystems #stocks #bitcoin #btcusd #cryptos #spy #gold #nq #investing #trading #spytrading #spymarket #tradingmarket #stockmarket #silver

SILVER: Strong Bearish Sentiment! Short!
My dear friends,
Today we will analyse SILVER together☺️
The recent price action suggests a shift in mid-term momentum. A break below the current local range around 33.293 will confirm the new direction downwards with the target being the next key level of 33.052.and a reconvened placement of a stop-loss beyond the range.
❤️Sending you lots of Love and Hugs❤️

Silver INTRADAY breakout retest supported at 3247Silver INTRADAY uptrend continuation supported at 3247
Key Support and Resistance Levels
Resistance Level 1: 3383
Resistance Level 2: 3414
Resistance Level 3: 3457
Support Level 1: 3247
Support Level 2: 3184
Support Level 3: 3112
This communication is for informational purposes only and should not be viewed as any form of recommendation as to a particular course of action or as investment advice. It is not intended as an offer or solicitation for the purchase or sale of any financial instrument or as an official confirmation of any transaction. Opinions, estimates and assumptions expressed herein are made as of the date of this communication and are subject to change without notice. This communication has been prepared based upon information, including market prices, data and other information, believed to be reliable; however, Trade Nation does not warrant its completeness or accuracy. All market prices and market data contained in or attached to this communication are indicative and subject to change without notice.

Silver Falls to $33.00 on Trade OptimismSilver (XAG/USD) slipped to around $33.00 on Tuesday as safe-haven demand eased amid improving U.S.-China trade sentiment and a stronger U.S. dollar. Optimism grew after Trump suggested tariff rollbacks and China granted exemptions. Treasury Secretary Bessent confirmed ongoing talks and positive proposals. Markets now await key US data, Q1 GDP, PCE inflation, and Nonfarm Payrolls for clues on Fed policy.
Technically, the first resistance level is located at 33.80. In case of its breach 34.20 and 34.85 could be monitored respectively. On the downside, first support is at 32.50. 31.40 and 30.20 would become the next support levels if this level is passed.
SILVER WILL GROW|LONG|
✅SILVER made a retest of
The horizontal support area
Around 32.75$ while trading
In an uptrend and we are now
Seeing a bullish rebound
Which reinforces our bullish
Biased and we will be expecting
A further bullish move up
LONG🚀
✅Like and subscribe to never miss a new idea!✅
Disclosure: I am part of Trade Nation's Influencer program and receive a monthly fee for using their TradingView charts in my analysis.

SPY/QQQ Plan Your Trade Update : Playing Into The Major BottomThis update highlights what I believe will be the last level of defense for price (support) on the SPY and why it is so important to HEDGE the markets right now.
The upward price move has reached the ULTIMATE HIGH (I believe) and is now moving into a Bullish EPP pattern (shifting into the downward pullback, then it will move into the flagging phase).
This flagging phase will be the deciding move (IMO) related to IF the markets attempt to break upward or downward near the current Fib 50% level.
This is why it is so important to HEDGE all open positions right now.
This battle zone in the markets (near the Fib 50% level) is not a guaranteed move higher or lower. Basically, we are watching the battle take place in live trading.
What we can do is try to rely on the EPP patterns and other formations to help guide us to the highest probable outcome, but we have to stay liquid and fluid as the markets trend.
Right now, I would suggest the breakdown (Major Low) outcome is about 70-80% likely. Thus, the breakaway (upside) outcome may be 20-30% likely based on my analysis.
But that could change if the SPY moves above $555.
Thank you again for all the great comments. I'm trying to help as many traders as I can. But this move to the 50% level is very "indecisive". So, I'm having to rely on Fibonacci Price Theory and other techniques (money management/HEDGING) as a way to protect my capital while I trade.
This is a great example of how you can learn techniques (beyond technical analysis) related to what to do when you really don't know what the markets may do in the near future.
The answer is HEDGE ACTIVE POSITIONS - or pull trades off (even if they are at a loss) and then HEDGE whatever you want to keep active.
No one is going to laugh when you tell them, "I protected my capital by hedging last week" when they are looking at severe losses and you are NOT looking as severe losses.
It is SMART TRADING.
Get some.
#trading #research #investing #tradingalgos #tradingsignals #cycles #fibonacci #elliotwave #modelingsystems #stocks #bitcoin #btcusd #cryptos #spy #gold #nq #investing #trading #spytrading #spymarket #tradingmarket #stockmarket #silver

SILVER: Move Down Expected! Short!
My dear friends,
Today we will analyse GOLD together☺️
The recent price action suggests a shift in mid-term momentum. A break below the current local range around 33.0203 will confirm the new direction downwards with the target being the next key level of 32.8151.and a reconvened placement of a stop-loss beyond the range.
❤️Sending you lots of Love and Hugs❤️

Gold-Silver Ratio: Silver’s Lag and Historical DivergencesThe gold-silver ratio - the number of silver ounces equals in value to one ounce of gold – has surged recently as gold prices rally while silver underperforms. Gold, a traditional safe-haven, has climbed to record highs amid economic uncertainty, whereas silver, which is partly an industrial commodity, has struggled to break past $35/oz. As a result, the ratio is around 100 – meaning gold is ~100 times the price of silver despite the correction in the ratio from its peak around 125.
For context, the ratio averaged 57 from 1975-2000, and between 2000-2025 the ratio has ranged from 32 and 125 (with the max level reached this month with an average of 68. The ratio has observed extreme spikes in unusual crises).
Today’s elevated ratio highlights the divergence between gold’s sharp rally and silver’s lagging performance. The 25-year mean of the ratio is at 68, suggesting the present levels (100) represent an extreme deviation in favour of gold.
Historical Parallels in Gold-Silver Divergences
Similar wide divergences between gold and silver have occurred in the past. Key historical episodes illustrate how silver eventually played “catch-up” after lagging gold – albeit with varying lag times:
1970s – Silver’s Late Surge: After the U.S. abandoned the gold standard, gold prices soared while silver lagged. However, silver eventually staged a sharp rally later in the decade, quickly closing the gap and driving the gold-silver ratio sharply lower.
1980s – Prolonged Underperformance: Following the 1980 peak, precious metals collapsed, with silver suffering far more than gold. The gold-silver ratio surged and remained elevated through the 1980s and 1990s, as silver failed to catch up and largely moved sideways until the 2000s.
Early 2000s – Post-Recession Catch-Up: After the 2001 recession, gold began a
new bull market while silver initially lagged. Eventually, silver outpaced gold’s gains over the next several years, significantly narrowing the gold-silver ratio.
2008 Financial Crisis – Sharp Divergence and Recovery: The 2008 crisis caused gold to outperform sharply as silver collapsed. However, as the economy recovered, silver staged a dramatic rebound, quickly closing the gap and normalizing the ratio by 2011.
Why Is Silver Lagging Now? Industrial Demand Uncertainty
Roughly half of silver demand is industrial (electronics, photovoltaics, chemicals). Persistent worries about a global manufacturing slowdown and elevated inventories have capped silver’s upside just as investors have chased gold for geopolitical protection.
Source: Silver Institute
Worries about industrial demand have been exacerbated by the recent trade uncertainties which impact industrial sectors in an outsized manner.
By contrast, gold’s appeal as a safe haven has been boosted by geopolitical and inflation fears, driving it to record highs in 2025.
Despite cyclical swings, the underlying secular trend has crept higher for decades. Gold’s monetisation (central-bank reserves, ETF holdings surge) versus silver’s demonetisation, higher real production costs for gold, and silver’s growing industrial elasticity are all factors that represent a risk to normalization of the GSR.
Even a forceful mean-reversion might therefore stall nearer 60–70 than the sub-40 extremes of earlier cycles.
Hypothetical Trade Setups
History shows that once macroeconomic uncertainty clears, silver often recovers lost ground quickly. In previous periods of extreme gold-silver divergence, from the 1970s through 2008, silver staged strong rallies that pushed the gold-silver ratio (GSR) back toward normal levels.
Today, however, silver’s outlook remains clouded by uncertainty, particularly amid the ongoing trade war. Prices risk stalling below resistance around $35/oz. Consequently, the normalization in the GSR may instead result from a correction in gold prices. Gold has consistently broken record highs, and its long-term outlook remains firmly bullish. Nevertheless, concerns about the sustainability of the recent rally are valid - last week, gold fell sharply after setting a new high above $3,500/oz.
In summary, a normalization in the GSR could result from either a silver rally or a gold correction. While each path remains uncertain, a position focused on the ratio itself is relatively insulated from further divergence.
Given this environment, we could express our view in GSR through a long position in silver and a short position in gold. Investors can implement this using CME Micro Silver and Micro Gold futures. This setup benefits from 72% margin offsets. The Micro contracts balance the notional value between both legs by using one contract each.
A hypothetical trade setup consisting of a short position in CME Micro Gold futures expiring in June (MGCM2025) and a short position in CME Micro Silver futures expiring in June (SILM2025), offering a reward to risk ratio of 1.6x, is described below.
MARKET DATA
CME Real-time Market Data helps identify trading set-ups and express market views better. If you have futures in your trading portfolio, you can check out on CME Group data plans available that suit your trading needs tradingview.com/cme .
DISCLAIMER
This case study is for educational purposes only and does not constitute investment recommendations or advice. Nor are they used to promote any specific products, or services.
Trading or investment ideas cited here are for illustration only, as an integral part of a case study to demonstrate the fundamental concepts in risk management or trading under the market scenarios being discussed. Please read the FULL DISCLAIMER the link to which is provided in our profile description.

SPY/QQQ Plan Your Trade For 4-28 : Inside Breakaway In TRENDToday's Inside Breakaway pattern in Trend mode suggests the SPY will attempt to break away from Friday's body range. The Weekly Bias turned to BULLISH last week.
I believe today's price move will be indicative of the rest of the week. We are moving into a very strong Major CRUSH pattern on Friday and I believe that pattern will be a big breakdown move in price.
Thus, I believe the early trading this week (today and tomorrow) will set the tone for the rest of the week.
If we see a rotation in price near the 550 level (to the downside) then my May Low pattern will likely transition into a price breakdown this week.
If we see more upside price action on Monday/Tuesday, then I would be very cautious of the end of this week as a sudden price breakdown may happen.
Gold and Silver will likely stay very muted for the next two trading days. The Canadian Elections will likely cause the US to briefly pause as one of our closest neighbors and trading partners moves through this pivotal election.
Bitcoin will also likely pause a bit in early trading this week and BTCUSD moves up to the $95-96k upper resistance area.
I suggest traders take advantage of this pause in price action to HEDGE their open positions. I believe the bigger move is still to the downside, but I also believe the markets could continue to push a bit higher before ROLLING into that May 2-5 Major Bottom.
At this point, near the 50% Fib retracement level, the markets could break in either direction. But I still believe the May 2-5 Major Bottom will play out as a unique lower low price level - below $525-530 on the SPY.
Get some.
#trading #research #investing #tradingalgos #tradingsignals #cycles #fibonacci #elliotwave #modelingsystems #stocks #bitcoin #btcusd #cryptos #spy #gold #nq #investing #trading #spytrading #spymarket #tradingmarket #stockmarket #silver

SILVER Local Long! Buy!
Hello,Traders!
SILVER is trading in a local
Uptrend and the price made
A retest of the horizontal
Support level around 32.83$
From where we will be
Expecting a rebound and
A move up on Monday
Buy!
Comment and subscribe to help us grow!
Check out other forecasts below too!
Disclosure: I am part of Trade Nation's Influencer program and receive a monthly fee for using their TradingView charts in my analysis.

SILVER: Short Trading Opportunity
SILVER
- Classic bearish formation
- Our team expects fall
SUGGESTED TRADE:
Swing Trade
Sell SILVER
Entry Level - 33.096
Sl - 33.729
Tp - 31.949
Our Risk - 1%
Start protection of your profits from lower levels
Disclosure: I am part of Trade Nation's Influencer program and receive a monthly fee for using their TradingView charts in my analysis.
❤️ Please, support our work with like & comment! ❤️

GOLD weekly outlook Part 2Explaining the scenarios. DO's and DONT's. Time windows. Back testing with Proper explanation and Timeframe Alignment

BRIEFING Week #17 : AAPL's fate is the SP'sHere's your weekly update ! Brought to you each weekend with years of track-record history..
Don't forget to hit the like/follow button if you feel like this post deserves it ;)
That's the best way to support me and help pushing this content to other users.
Kindly,
Phil

GOLD REMAINS BULLISH ON LOWER TIMEFRAME - H4Despite posting the weekly indecision on gold, the metal remains bullish on the lower timeframe like H4 which is yet to break it's bullish structure. And with the rejection followed by the bullish candle before the close last trading week, XAUUSD likely will continue to rally up when market opens for trade next week.
N.B!
- XAUUSD price might not follow the drawn lines . Actual price movements may likely differ from the forecast.
- Let emotions and sentiments work for you
- ALWAYS Use Proper Risk Management In Your Trades
#gold
#xauusd

With Last Trading Week Indecision Next Week Will be BIG for GoldGold shows indecision after the close of trading hours for last week, and with the long sellers' wick exhibited on the candlestick, XAUUSD will require a huge geopolitical uncertainty news for price to continue to rise. A further rejection will drag gold's price to its mean.
N.B!
- XAUUSD price might not follow the drawn lines . Actual price movements may likely differ from the forecast.
- Let emotions and sentiments work for you
- ALWAYS Use Proper Risk Management In Your Trades
#gold
#xauusd

SILVER My Opinion! BUY!
My dear friends,
Please, find my technical outlook for NATGAS below:
The price is coiling around a solid key level - 33.100
Bias - Bullish
Technical Indicators: Pivot Points Low anticipates a potential price reversal.
Super trend shows a clear buy, giving a perfect indicators' convergence.
Goal - 33.330
About Used Indicators:
The pivot point itself is simply the average of the high, low and closing prices from the previous trading day.
Disclosure: I am part of Trade Nation's Influencer program and receive a monthly fee for using their TradingView charts in my analysis.
———————————
WISH YOU ALL LUCK
