Bear-Trap armed: Gold ticks 4 / 5 boxes - waiting for the spark
1️⃣ Why the 2020 déjà-vu is EVEN louder
2025 (now) 2020 (pre-rally)
TradingView ideas still bearish 💬
> 70 % 60 % bearish
Managed-money net-longs ≈ 115 k
(-35 % from Apr) –25 % from peak
+ $741 m PM-ETF inflow, first after months Record IN-flows
G/S ratio 87 (< 90) Fell to 95
S&P keeps making highs. Ditto
2️⃣ What’s still different
Real 10-y TIPS yield +0.7 % vs -1 % in 2020 → smaller monetary tail-wind.
Gold is already at an infl-adj. record – expect a short & sharp squeeze, not a fresh multi-year super-cycle (yet).
3️⃣ Checklist – updated
Signal Status 18 Jul Comment
———————————————————
Gold DAILY close ≥ $3 200–3 250 YES – $3 354 ✔
G/S ratio < 90 YES – 87 ✔
CFTC net-longs < 150 k YES – ~115 k ✔
ETF flows turn positive. YES – $741 m ✔
Equity stress (VIX > 25 or SPX −5 %) NOT YET – VIX 16.5 ✖
4 / 5 boxes = 99 % primed. One spark missing.
4️⃣ What could light the fuse
Date Potential trigger Why it matters
22 Jul Mega-tech Q2 earnings (NVDA/AMD) Any guidance miss → SPX wobble
30 Jul FOMC Fed holds but sounds dovish USD dump + yield spike risk
1 Aug Trump s “reciprocal” duties Imported-inflation scare → VIX pop
Early Aug. DXY crashes < 96 in < 5 days. Disorderly USD slide = funding stress
Hit ≥ 2 of: DXY < 96, VIX > 25, SPX -5 % or HY-spread +75 bp → final ✔.
Bottom line
The bear-trap thesis aged well: sentiment, positioning, ETFs, and G/S ratio have already clicked bullish.
Only equity-market stress is missing. A fast USD slide or a tariff shock right after a neutral Fed is the most likely detonator.
Stay nimble: Collect premium inside $3 250-3 400 while volatility sleeps – but keep alarms on VIX 25 and DXY 96. One red headline could still launch the squeeze.
Disclaimer: Educational opinion, not investment advice. Futures & CFD trading is risky – do your own research and consult a professional.
Silver
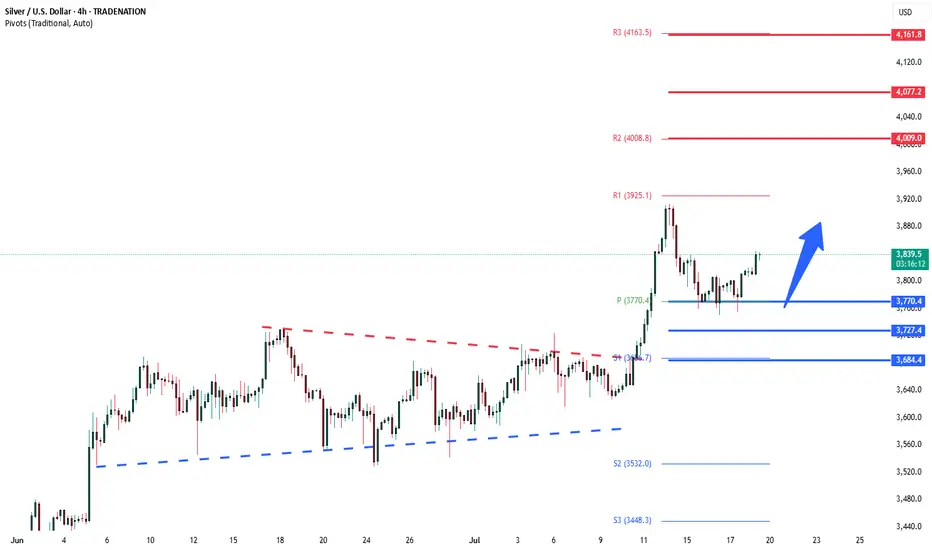
Silver bullish above 3770The Silver remains in a bullish trend, with recent price action showing signs of a continuation breakout within the broader uptrend.
Support Zone: 3770 – a key level from previous consolidation. Price is currently testing or approaching this level.
A bullish rebound from 3770 would confirm ongoing upside momentum, with potential targets at:
4000 – initial resistance
4077 – psychological and structural level
4160 – extended resistance on the longer-term chart
Bearish Scenario:
A confirmed break and daily close below 3770 would weaken the bullish outlook and suggest deeper downside risk toward:
3727 – minor support
3685 – stronger support and potential demand zone
Outlook:
Bullish bias remains intact while the Silver holds above 3770. A sustained break below this level could shift momentum to the downside in the short term.
This communication is for informational purposes only and should not be viewed as any form of recommendation as to a particular course of action or as investment advice. It is not intended as an offer or solicitation for the purchase or sale of any financial instrument or as an official confirmation of any transaction. Opinions, estimates and assumptions expressed herein are made as of the date of this communication and are subject to change without notice. This communication has been prepared based upon information, including market prices, data and other information, believed to be reliable; however, Trade Nation does not warrant its completeness or accuracy. All market prices and market data contained in or attached to this communication are indicative and subject to change without notice.
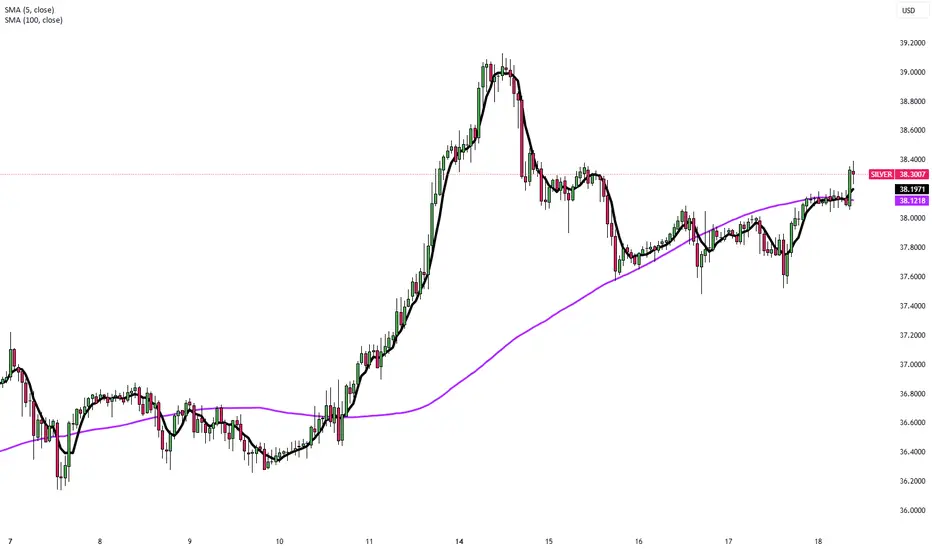
Silver Rebounds Toward $38 as Dollar EasesSilver rebounded toward $38 per ounce on Friday, recovering from a two-day decline as the U.S. dollar and Treasury yields eased. The move reflected shifting sentiment on Fed policy and trade conditions after earlier losses sparked by inflation data that reduced hopes for near-term rate cuts.
U.S. stock futures edged higher following record closes for the S&P 500 and Nasdaq, driven by strong retail sales, lower jobless claims, and optimism in AI-related tech stocks after Taiwan Semiconductor’s positive forecast. On monetary policy, Fed officials remain divided: Mary Daly expects two rate cuts this year, while Adriana Kugler urges caution due to tariff-driven inflation. President Trump reinforced trade tensions by sending letters to over 20 partners setting new tariffs between 20% and 40%.
In corporate updates, United Airlines expects stronger earnings in the second half of 2025, and Chevron signaled higher future cash flow as production in its top U.S. oil field nears a plateau.
Resistance is at 38.50, while support holds at 37.20.
The AI Boom's Unsung HeroThe rise of artificial intelligence isn’t just shaking up tech companies it’s quietly transforming the global silver market in a big way. As major players like NVIDIA, Google and others ramp up their AI infrastructure silver is becoming more critical than ever. Why? Because silver, thanks to its unmatched electrical conductivity, plays a key role in powering the hardware behind AI.
Silver is the most conductive metal on Earth. That makes it perfect for high-performance computing something AI needs a lot of. It’s especially important in data centers and advanced semiconductors, where both electrical and thermal performance are mission-critical.
What’s really interesting is that AI servers tend to use two to three times more silver than traditional data center servers. That’s because AI workloads are more power-hungry, generate more heat and require more complex cooling and electrical systems. Simply put, more AI means more silver.
If there’s one company at the heart of this trend it’s NVIDIA. Analysts at Morgan Stanley expect NVIDIA to consume a staggering 77% of all silicon wafers used for AI accelerators in 2025 up from 51% in 2024. That adds up to around 535,000 300-mm wafers a year each of which contains silver in key components.
All of this AI growth is showing up in the numbers. Industrial silver demand hit an all-time high of 680.5 million ounces in 2024. The electronics industry alone uses around 250 million ounces per year and AI is now the fastest-growing part of that.
Despite all this demand, silver supply just isn’t keeping up. The market’s been in deficit for four straight years, with a total shortfall of 678 million ounces between 2021 and 2024. That’s roughly ten months of global mine output gone missing from the balance sheet.
It’s no surprise, then, that silver prices have been climbing fast. As of July 2025 silver’s up nearly 30% for the year. Looking further ahead I see room for silver to keep climbing:
In the short term (2025): $36–$42 per ounce seems realistic
By 2026: Potential for $50+ as more AI growth stays strong
AI isn’t just changing how we work, communicate, or compute—it’s literally reshaping the commodities that make this technology possible. Silver, once thought of mainly in the context of jewelry or coins, is now a backbone material for the AI revolution.

HL-Insane Confluence HereChart speaks for itself.
Confluence on many indicators suggests a hard bottom here

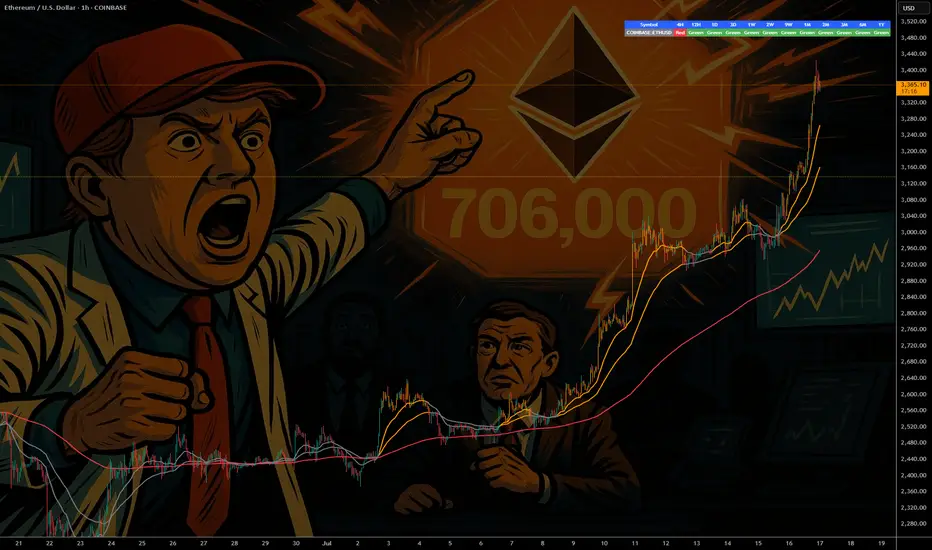
ETH - If You Know ...... You Know whats Coming
NYSE:BLK $BUIDL tokenized U.S.-Treasury fund launched on COINBASE:ETHUSD in Mar 2024—Wall Street is already settling real dollars on-chain.
NYSE:JPM JPMD stablecoin just went live on Base (an COINBASE:ETHUSD L2), piping wholesale payments from a $4 T balance-sheet straight through COINBASE:ETHUSD rails.
COINBASE:ETHUSD isn’t just riding the next crypto cycle—it’s becoming Wall Street’s settlement layer. From BlackRock’s on-chain Treasury fund to JPMorgan’s and soon Bank of America’s dollar tokens, a tidal wave of institutional stable-coin flows is lining up behind ETH. Fewer coins, more real-world volume—if you know, you know what’s coming.
NYSE:BAC CEO says they’ll issue a dollar-backed token the moment regulators nod—another tier-1 bank boarding the Ethereum train.
Stablecoin cap has blasted past $230 B , with 80 %+ of all on-chain transfers riding Ethereum (plus BSC) blocks.
Corporate settlements via stablecoins grew 25 % YoY in 2024 as multinationals replaced SWIFT with instant on-chain clearing.
Daily stablecoin throughput averages $7 B—each hop burning ETH and tightening supply.
BCG projects tokenized real-world assets to exceed $16 T by 2030 , with EVM chains as the default plumbing.
Over 500 M wallets already interact with stablecoins , a 30 % YoY surge led by emerging-market demand.
L2s like BINANCE:ARBUSDT & BINANCE:OPUSDT cut transaction fees 35 % yet still settle back to mainnet—meaning ETH captures the fee stream and the burn.
Bottom line: a tidal wave of bank-grade stablecoins + tokenized assets is lining up behind ETH; supply shrinks, demand soars—if you know, you know what’s coming.
quote] Marty Boots | 17-Year Trader — smash that , hit LIKE & SUBSCRIBE, and share your views in the comments below so we can make better trades & grow together!
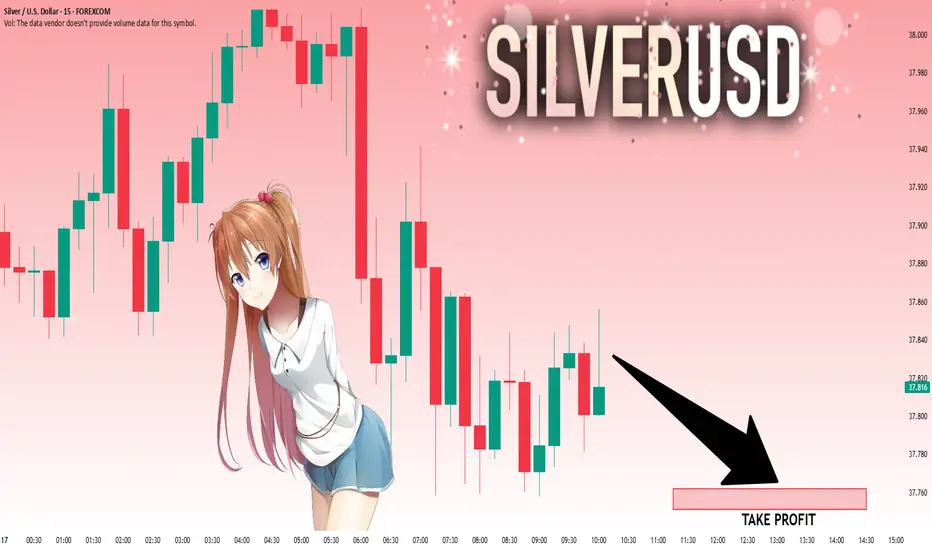
SILVER: Local Bearish Bias! Short!
My dear friends,
Today we will analyse SILVER together☺️
The market is at an inflection zone and price has now reached an area around 37.832 where previous reversals or breakouts have occurred.And a price reaction that we are seeing on multiple timeframes here could signal the next move down so we can enter on confirmation, and target the next key level of 37.762..Stop-loss is recommended beyond the inflection zone.
❤️Sending you lots of Love and Hugs❤️
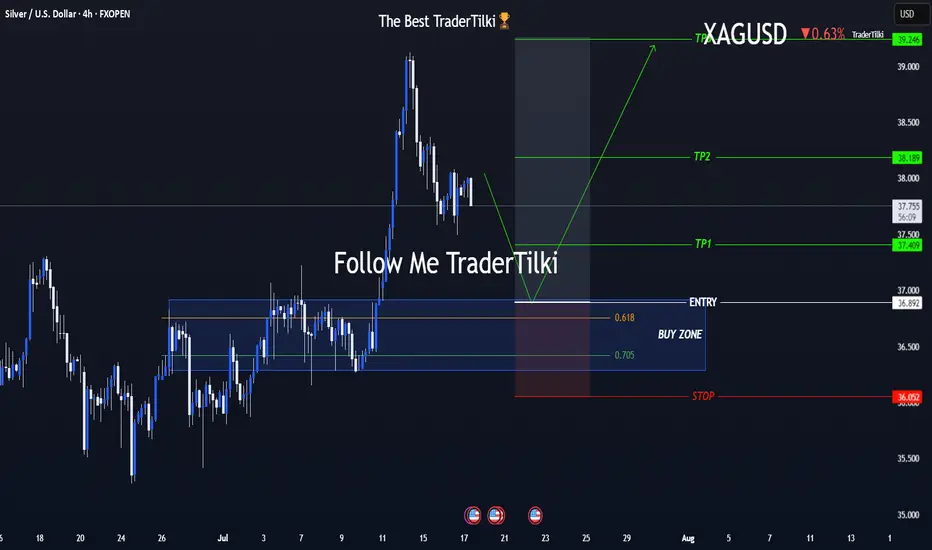
One Shot, Clear Strategy – Silver Buy Zone in SightHey everyone 👋
📌 BUY LIMIT ORDER / XAGUSD-SILVER Key Levels
🟢 Entry: 36,892
🎯 Target 1: 37,409
🎯 Target 2: 38,189
🎯 Target 3: 39,246
🔴 Stop: 36,052
📈 Risk/Reward Ratio: 2,79
I double-checked the levels and put together a clean, focused analysis just for you. Every single like seriously boosts my motivation to keep sharing 📈 Your support means the world to me! Huge thanks to everyone who likes and backs this work 💙 Our goals are crystal clear, our strategy is solid. Let’s keep moving forward with confidence and smart execution!
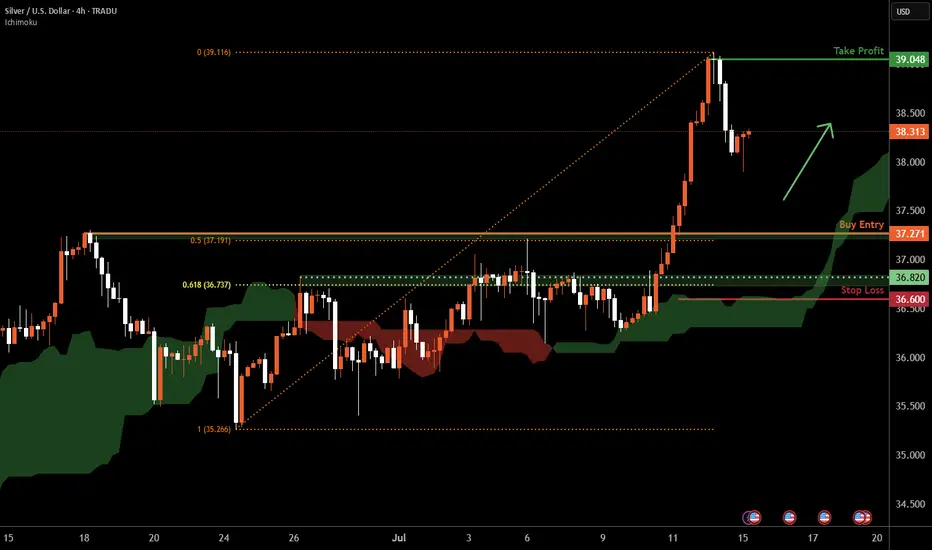
Silver H4 | Falling toward a pullback supportSilver (XAG/USD) is falling towards a pullback support and could potentially bounce off this level to climb higher.
Buy entry is at 37.27 which is a pullback support that aligns with the 50% Fibonacci retracement.
Stop loss is at 36.60 which is a level that lies underneath a pullback support and the 61.8% Fibonacci retracement.
Take profit is at 38.31 which is a swing-high resistance.
High Risk Investment Warning
Trading Forex/CFDs on margin carries a high level of risk and may not be suitable for all investors. Leverage can work against you.
Stratos Markets Limited (tradu.com ):
CFDs are complex instruments and come with a high risk of losing money rapidly due to leverage. 66% of retail investor accounts lose money when trading CFDs with this provider. You should consider whether you understand how CFDs work and whether you can afford to take the high risk of losing your money.
Stratos Europe Ltd (tradu.com ):
CFDs are complex instruments and come with a high risk of losing money rapidly due to leverage. 66% of retail investor accounts lose money when trading CFDs with this provider. You should consider whether you understand how CFDs work and whether you can afford to take the high risk of losing your money.
Stratos Global LLC (tradu.com ):
Losses can exceed deposits.
Please be advised that the information presented on TradingView is provided to Tradu (‘Company’, ‘we’) by a third-party provider (‘TFA Global Pte Ltd’). Please be reminded that you are solely responsible for the trading decisions on your account. There is a very high degree of risk involved in trading. Any information and/or content is intended entirely for research, educational and informational purposes only and does not constitute investment or consultation advice or investment strategy. The information is not tailored to the investment needs of any specific person and therefore does not involve a consideration of any of the investment objectives, financial situation or needs of any viewer that may receive it. Kindly also note that past performance is not a reliable indicator of future results. Actual results may differ materially from those anticipated in forward-looking or past performance statements. We assume no liability as to the accuracy or completeness of any of the information and/or content provided herein and the Company cannot be held responsible for any omission, mistake nor for any loss or damage including without limitation to any loss of profit which may arise from reliance on any information supplied by TFA Global Pte Ltd.
The speaker(s) is neither an employee, agent nor representative of Tradu and is therefore acting independently. The opinions given are their own, constitute general market commentary, and do not constitute the opinion or advice of Tradu or any form of personal or investment advice. Tradu neither endorses nor guarantees offerings of third-party speakers, nor is Tradu responsible for the content, veracity or opinions of third-party speakers, presenters or participants.

BRIEFING Week #29-30 : BTC stalling, ETH & then Alts ?Here's your weekly update ! Brought to you each weekend with years of track-record history..
Don't forget to hit the like/follow button if you feel like this post deserves it ;)
That's the best way to support me and help pushing this content to other users.
Kindly,
Phil

BITCOIN- MONSTER ORDERS IN THE BOOK -> You Know What This Means COINBASE:BTCUSD “Monster orders” are exceptionally large buy-limit orders clustered roughly 7 % beneath the current market price.
Large buy-limit walls can act like a price magnet—deep liquidity attracts algos and traders hunting fills, often pulling price straight toward the level.
Once the wall absorbs the selling pressure, the magnet flips: liquidity dries up, supply thins, and price can rip away from that zone with force.
They create a visible demand wall in the order book, signalling that whales / institutions are ready to absorb a dip and accumulate at that level.
Price will often wick into this zone to fill the wall, then rebound sharply—treat the 7 % band as potential support or entry.
Such walls can act as liquidity traps : market makers may push price down to trigger retail stop-losses before snapping it back up.
Confirm that the wall persists as price approaches and that spot + derivatives volume rises; if the wall disappears, it may have been spoofing.
Always combine order-book context with trend, momentum and higher-time-frame support for higher-probability trades, Just like the extremely powerful indicators on the chart.
🚀 Marty Boots | 17-Year Trader — smash that 👍, hit LIKE & SUBSCRIBE, and share your views in the comments below so we can make better trades & grow together!

SILVER: Strong Bullish Sentiment! Long!
My dear friends,
Today we will analyse SILVER together☺️
The market is at an inflection zone and price has now reached an area around 37.873 where previous reversals or breakouts have occurred.And a price reaction that we are seeing on multiple timeframes here could signal the next move down so we can enter on confirmation, and target the next key level of 37.962..Stop-loss is recommended beyond the inflection zone.
❤️Sending you lots of Love and Hugs❤️

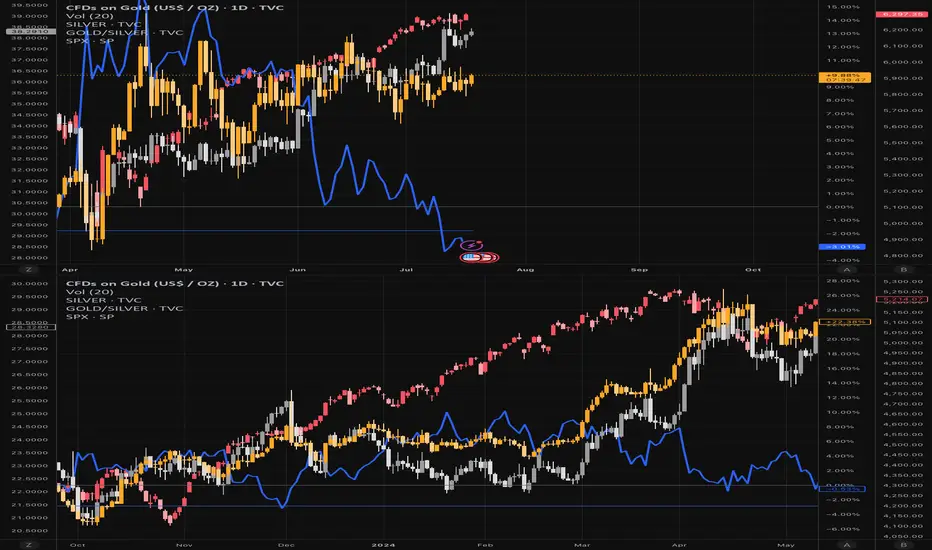
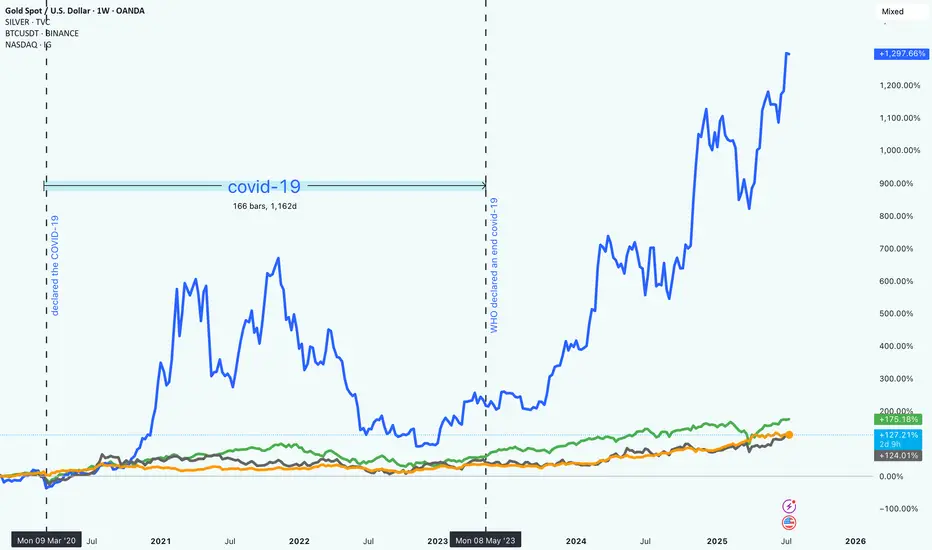
Market Trends from 2020 to 2025How Bitcoin, NASDAQ, Gold, and Silver Really Performed Since 2020
It’s been a wild few years in the markets. From early 2020 to mid-2025, investors have had to navigate uncertainty, changing interest rates, tech booms, and the rise of digital assets. Looking back, it’s clear that some assets took off while others just quietly held their ground.
So, what happened if you had invested in Bitcoin, the NASDAQ, gold, or silver five years ago?
Bitcoin (BTC): +1,297.87%
No surprise here. Bitcoin absolutely stole the show. Despite all the ups and downs (and there were plenty), BTC ended up with nearly 1,300% gains. It had a huge surge in late 2020 and 2021, crashed hard, and then climbed even higher starting in 2023.
This kind of return doesn’t come without risk. Bitcoin was by far the most volatile of the group. But for those who held on, the reward was massive. It also marked a big shift in how people think about money and investing.
"Crypto is no longer just a fringe idea."
NASDAQ: +175.26%
Tech stocks had a strong run, too. The NASDAQ gained around 175%, driven by innovation, digital expansion, and eventually, the AI boom. While there were some bumps along the way (especially when interest rates went up), the general trend was up and to the right.
Unlike Bitcoin, the NASDAQ was more predictable, less explosive.
Gold: +127.39%
Gold did what gold usually does. It held its value and slowly moved higher. Over five years, it returned about 127%, which is pretty solid for a “safe haven” asset. It didn’t grab headlines like crypto or tech stocks, but it stayed reliable through the chaos.
Silver: +124.50%
Silver had a similar story to gold, but with a bit more fluctuation. It benefited from both investor demand and industrial use, and it ended up with just over 124% in gains. Not bad for a metal that often gets overshadowed by its shinier cousin ;).
What It All Means
If you were in Bitcoin, you saw huge gains, but also had to stomach major volatility. Tech investors did well too, especially those who stayed in through the dips. Meanwhile, gold and silver offered steadier, more defensive returns.
One big takeaway: the investment landscape is changing. Traditional assets still matter, but new ones like crypto are reshaping what portfolios can look like.
In the end, it’s about balancing risk and reward!
and figuring out what kind of investor you are.
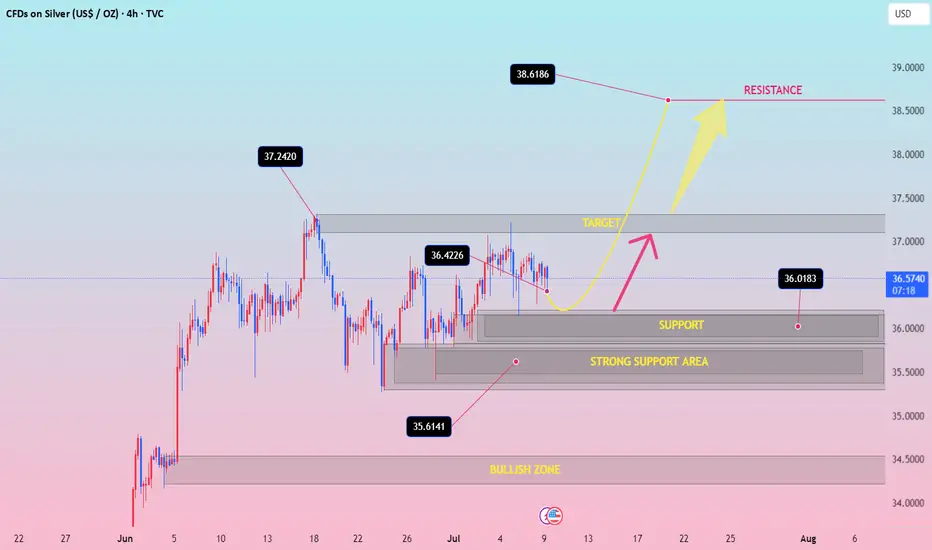
SILVER h4 bullish pattansilver bullish mode Bearish Disruption Scenario:
Fake bounce to ~$37.00
Rejection → Break $36.00 support
Bear momentum pushes to $35.00–34.50
Neutral/Range Disruption:
Price oscillates between 36.00 and 36.80 for longer than expected — builds up coiled energy before either sharp breakout or breakdown
Only Bullish IF:
Clean reclaim of 37.25 with strong close above
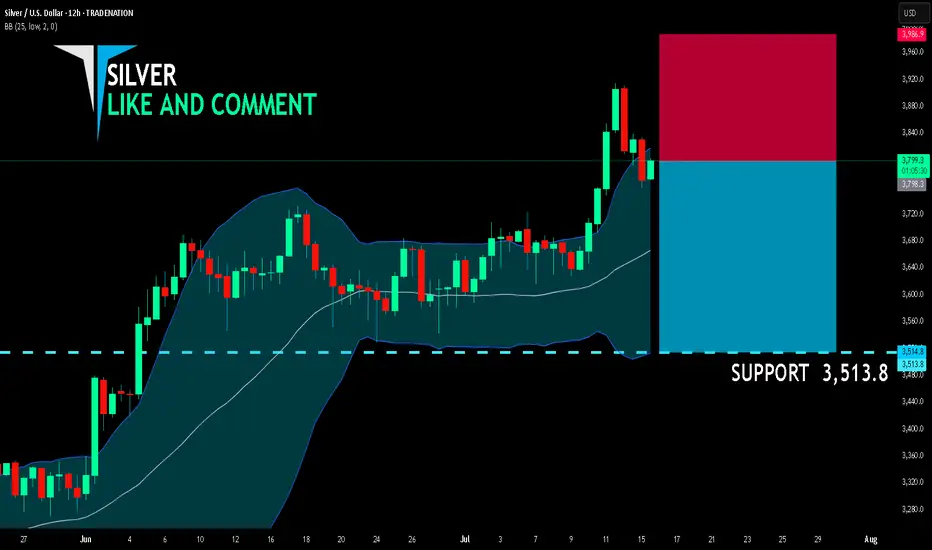
SILVER SELLERS WILL DOMINATE THE MARKET|SHORT
SILVER SIGNAL
Trade Direction: short
Entry Level: 3,798.3
Target Level: 3,513.8
Stop Loss: 3,986.9
RISK PROFILE
Risk level: medium
Suggested risk: 1%
Timeframe: 12h
Disclosure: I am part of Trade Nation's Influencer program and receive a monthly fee for using their TradingView charts in my analysis.
✅LIKE AND COMMENT MY IDEAS✅
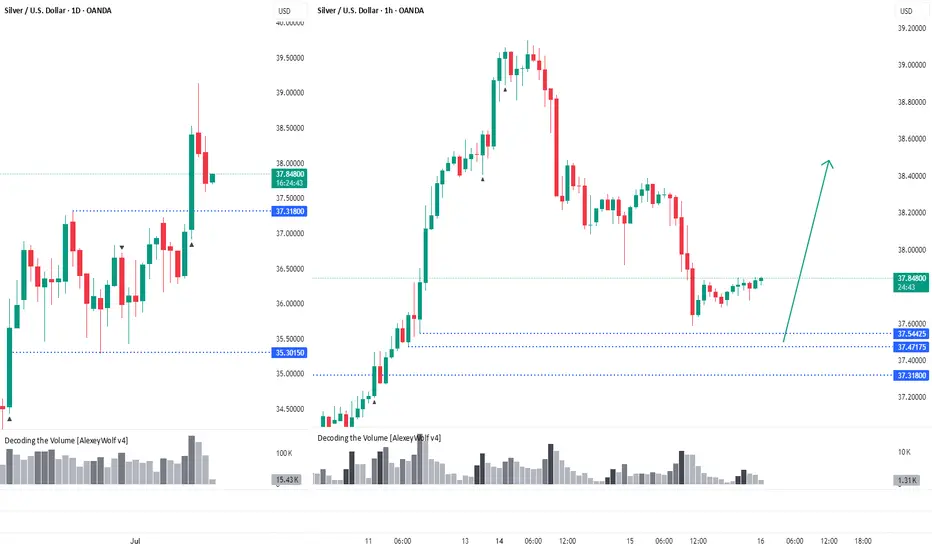
Silver. The price has pulled backHi traders and investors!
On the daily timeframe, the price has broken out of the sideways range through the upper boundary at 37.31.
The price has pulled back close to levels where potential buy patterns could form — 37.54, 37.47, and 37.31.
This analysis is based on the Initiative Analysis concept (IA).
Wishing you profitable trades!
SPY/QQQ Plan Your Trade Special Update : BUCKLE UPThis video is a special update for all TradingView members. I felt I needed to share this information and present the case that I believe poses the most significant risk to your financial future - and it's happening right now.
Several weeks ago, I identified a very unique mirror setup in the SPY and kept an eye on how it was playing out. I needed to see confirmation of this setup before I could say it had any real likelihood of playing out as I expected.
As of today, I'm suggesting that we now have excellent confirmation that the US/Global markets are about to enter a deep consolidation phase, lasting through the rest of 2025 and possibly into 2026 and early 2027.
The interesting thing about this price pattern/structure is that it is almost exactly the same as the 2003-2007 structure, which I believe is the origin of this mirror setup. Almost down to the exact type of price bars/patterns I'm seeing.
Many of you are already aware that I've been calling for a critical low cycle in the SPY on July 18 for many months. What you may not realize is that the pattern is based on Weekly price data. The July 18 cycle low can have a span of +/- 1-3 weeks related to when and how the cycle low pattern plays out.
Watch this video. If you have any questions, message me or comment.
I'm still here, doing my best to identify and unlock the secrets of price action and to help as many traders as I can.
Price is the Ultimate Indicator.
Get some.
#trading #research #investing #tradingalgos #tradingsignals #cycles #fibonacci #elliotwave #modelingsystems #stocks #bitcoin #btcusd #cryptos #spy #gold #nq #investing #trading #spytrading #spymarket #tradingmarket #stockmarket #silver

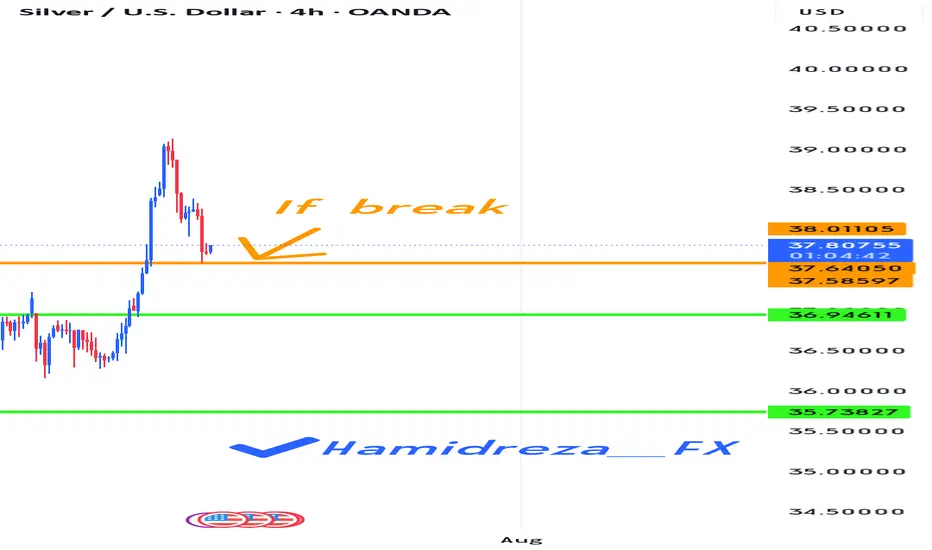
Is it time for a correction for silver?
Hi my dears
It seems that silver, like gold, should spend a few months in a resting phase. Of course, this is a guess. There is a condition on the chart that, if it happens, we should probably see the conditions shown on the chart happen.
I would be happy to hear your opinion.
SILVER Support Ahead! Buy!
Hello,Traders!
SILVER is going down now
But the price is trading in a
Long-term uptrend so we are
Bullish biased and after the
Price retests of the horizontal
Support support below
Around 37.20$ we will be
Expecting a bullish rebound
Buy!
Comment and subscribe to help us grow!
Check out other forecasts below too!
Disclosure: I am part of Trade Nation's Influencer program and receive a monthly fee for using their TradingView charts in my analysis.

LITCOIN : So what is an ETF ?Hello friends
Be careful with the recent fluctuations of this coin because the movements of this coin have become unpredictable and we suggest that if you want to buy, buy in the specified support areas and in steps, of course with capital and risk management...
We have also specified targets for you.
*Trade safely with us*

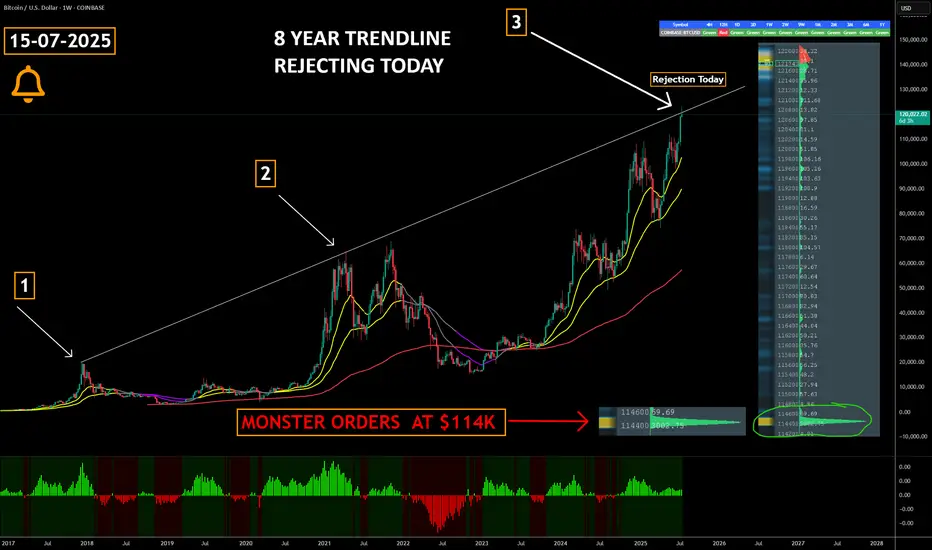
Did Bitcoin Just TOP OUT ??????
COINBASE:BTCUSD has just collided with an 8-year rising trendline that capped the market’s last two cyclical peaks—historically, this level has triggered multi-month corrections and Bear Markets.
Triple-test significance : a third touch of a long-term trendline ➜ heightened odds of a reaction; failure to break cleanly often confirms a major top.
Watch for confirmation signals —weekly bearish RSI divergence, waning volume, or rejection wicks can validate a reversal scenario.
Breakout = regime change : a decisive close and hold above the line flips it to support, opening the door to fresh price discovery and potential parabolic upside.
Large Orders at $114k create a visible demand wall in the order book, signalling that whales / institutions are ready to absorb a dip and accumulate at that level.
Risk-management alert : consider tightening stops, reducing leverage, or hedging until trendline fate is resolved.
The buy pressure has been relentless but this is always worth paying attention to
Marty Boots | 17-Year Trader — smash that , hit LIKE & SUBSCRIBE, and share your views in the comments below so we can make better trades & grow together!
SILVER: Next Move Is Down! Short!
My dear friends,
Today we will analyse SILVER together☺️
The recent price action suggests a shift in mid-term momentum. A break above the current local range around 38.253 will confirm the new direction upwards with the target being the next key level of 38.151 and a reconvened placement of a stop-loss beyond the range.
❤️Sending you lots of Love and Hugs❤️
Silver H4 | Pullback support at 50% Fibonacci retracementSilver (XAG/USD) is falling towards a pullback support and could potentially bounce off this level to climb higher.
Buy entry is at 37.27 which is a pullback support that aligns with the 50% Fibonacci retracement.
Stop loss is at 36.60 which is a level that lies underneath a pullback support and the 61.8% Fibonacci retracement.
Take profit is at 38.32 which is a swing-high resistance.
High Risk Investment Warning
Trading Forex/CFDs on margin carries a high level of risk and may not be suitable for all investors. Leverage can work against you.
Stratos Markets Limited (tradu.com ):
CFDs are complex instruments and come with a high risk of losing money rapidly due to leverage. 63% of retail investor accounts lose money when trading CFDs with this provider. You should consider whether you understand how CFDs work and whether you can afford to take the high risk of losing your money.
Stratos Europe Ltd (tradu.com ):
CFDs are complex instruments and come with a high risk of losing money rapidly due to leverage. 63% of retail investor accounts lose money when trading CFDs with this provider. You should consider whether you understand how CFDs work and whether you can afford to take the high risk of losing your money.
Stratos Global LLC (tradu.com ):
Losses can exceed deposits.
Please be advised that the information presented on TradingView is provided to Tradu (‘Company’, ‘we’) by a third-party provider (‘TFA Global Pte Ltd’). Please be reminded that you are solely responsible for the trading decisions on your account. There is a very high degree of risk involved in trading. Any information and/or content is intended entirely for research, educational and informational purposes only and does not constitute investment or consultation advice or investment strategy. The information is not tailored to the investment needs of any specific person and therefore does not involve a consideration of any of the investment objectives, financial situation or needs of any viewer that may receive it. Kindly also note that past performance is not a reliable indicator of future results. Actual results may differ materially from those anticipated in forward-looking or past performance statements. We assume no liability as to the accuracy or completeness of any of the information and/or content provided herein and the Company cannot be held responsible for any omission, mistake nor for any loss or damage including without limitation to any loss of profit which may arise from reliance on any information supplied by TFA Global Pte Ltd.
The speaker(s) is neither an employee, agent nor representative of Tradu and is therefore acting independently. The opinions given are their own, constitute general market commentary, and do not constitute the opinion or advice of Tradu or any form of personal or investment advice. Tradu neither endorses nor guarantees offerings of third-party speakers, nor is Tradu responsible for the content, veracity or opinions of third-party speakers, presenters or participants.