SILVER: Strong Bullish Sentiment! Long!
My dear friends,
Today we will analyse SILVER together☺️
The market is at an inflection zone and price has now reached an area around 38.768 where previous reversals or breakouts have occurred.And a price reaction that we are seeing on multiple timeframes here could signal the next move up so we can enter on confirmation, and target the next key level of 38.937.Stop-loss is recommended beyond the inflection zone.
❤️Sending you lots of Love and Hugs❤️
Silver
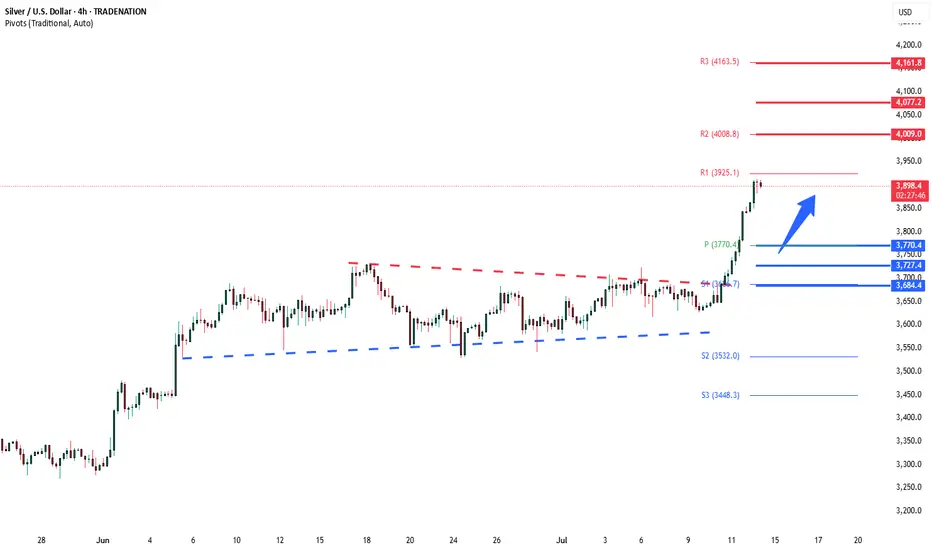
Silver INTRADAY breakout support at 3770The Silver remains in a bullish trend, with recent price action showing signs of a continuation breakout within the broader uptrend.
Support Zone: 3770 – a key level from previous consolidation. Price is currently testing or approaching this level.
A bullish rebound from 3770 would confirm ongoing upside momentum, with potential targets at:
4000 – initial resistance
4077 – psychological and structural level
4160 – extended resistance on the longer-term chart
Bearish Scenario:
A confirmed break and daily close below 3770 would weaken the bullish outlook and suggest deeper downside risk toward:
3727 – minor support
3685 – stronger support and potential demand zone
Outlook:
Bullish bias remains intact while the Silver holds above 3770. A sustained break below this level could shift momentum to the downside in the short term.
This communication is for informational purposes only and should not be viewed as any form of recommendation as to a particular course of action or as investment advice. It is not intended as an offer or solicitation for the purchase or sale of any financial instrument or as an official confirmation of any transaction. Opinions, estimates and assumptions expressed herein are made as of the date of this communication and are subject to change without notice. This communication has been prepared based upon information, including market prices, data and other information, believed to be reliable; however, Trade Nation does not warrant its completeness or accuracy. All market prices and market data contained in or attached to this communication are indicative and subject to change without notice.
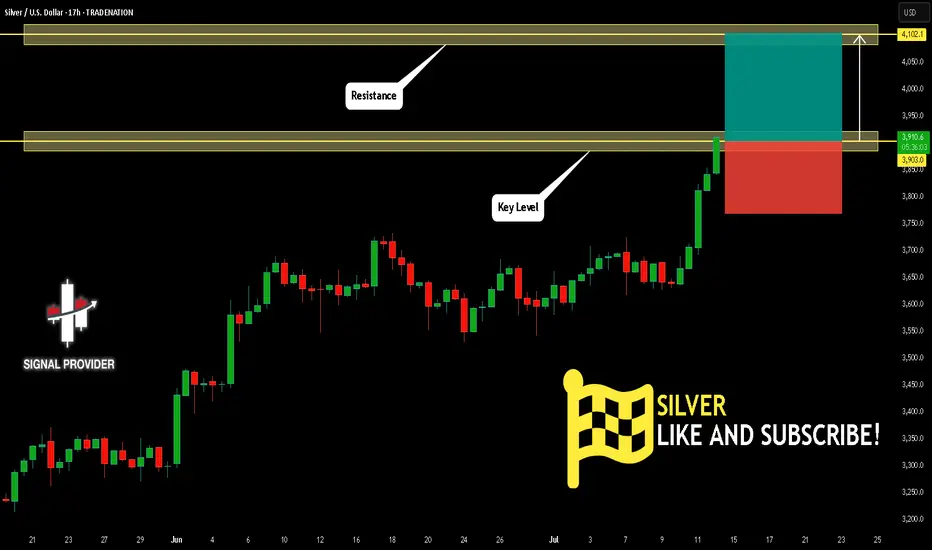
SILVER Will Go Up From Support! Buy!
Please, check our technical outlook for SILVER.
Time Frame: 17h
Current Trend: Bullish
Sentiment: Oversold (based on 7-period RSI)
Forecast: Bullish
The market is approaching a key horizontal level 3,903.0.
Considering the today's price action, probabilities will be high to see a movement to 4,102.1.
P.S
Overbought describes a period of time where there has been a significant and consistent upward move in price over a period of time without much pullback.
Disclosure: I am part of Trade Nation's Influencer program and receive a monthly fee for using their TradingView charts in my analysis.
Like and subscribe and comment my ideas if you enjoy them!
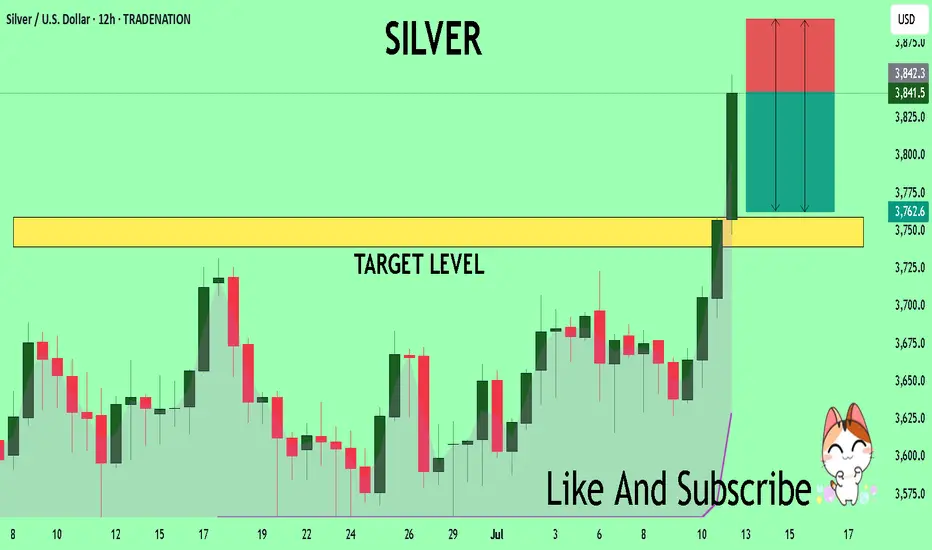
Silver Analysis – Strong Bulls and a Clean Setup AheadLast month, Silver printed a new multi-decade high, a major technical milestone.
Since then, price has entered a sideways consolidation, forming a rectangle — but what stands out is this:
👉 Silver bulls have absorbed every dip, even when Gold dropped.
That’s strength. And strength usually precedes breakout.
🔍 Current Situation
At the time of writing, price is trading around 37.20,
and from the current structure, it looks like nothing is standing in the way of an upside break.
We don’t predict — we prepare...
And this chart looks ready.
🎯 Next Target: 40.00 USD?
A push to 40.00 looks like the next “normal” target.
But don’t forget: that’s a 3,000 pip move.
This type of move will require patience
Plan your trade.
Respect your risk.
Let the bulls work. 🚀
Disclosure: I am part of TradeNation's Influencer program and receive a monthly fee for using their TradingView charts in my analyses and educational articles.

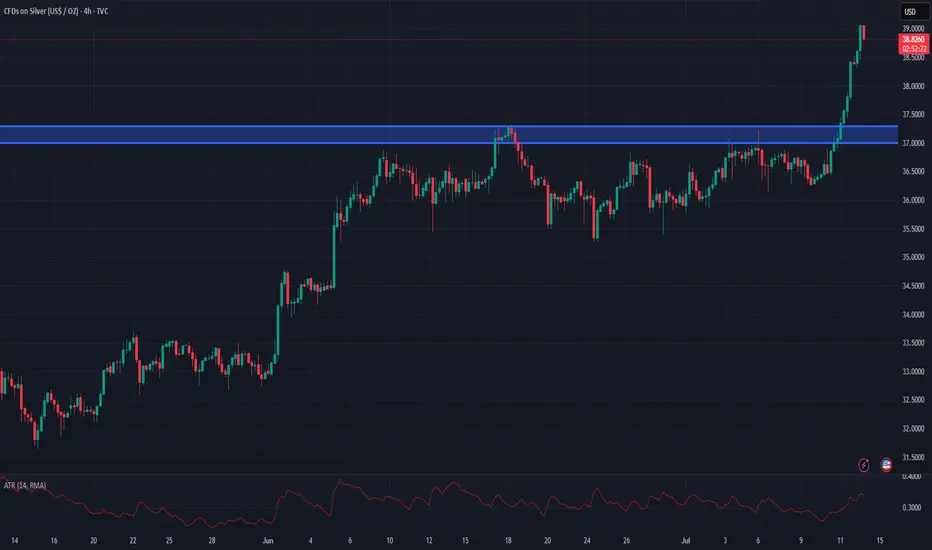
Silver breaks out to 14 year highsSilver has broken out again above the previous resistance zone at $37.00-$37.30 amid ongoing concerns surrounding tariffs
If we see corrective retests of this $37.00-$37.30 it can offer a good opportunity to get long and take advantage of Silvers bullish momentum.
Stops would need to be below $36.75 and targets can be set to around $40.00-$41.50
SHORT ON SILVER XAG/USDSilver has given us a CHOC (change of character) on the lower timeframe with a nice retest to the supply zone.
Bears have shown up and I expect silver to drop seeking sell side liquidity to the next demand level.

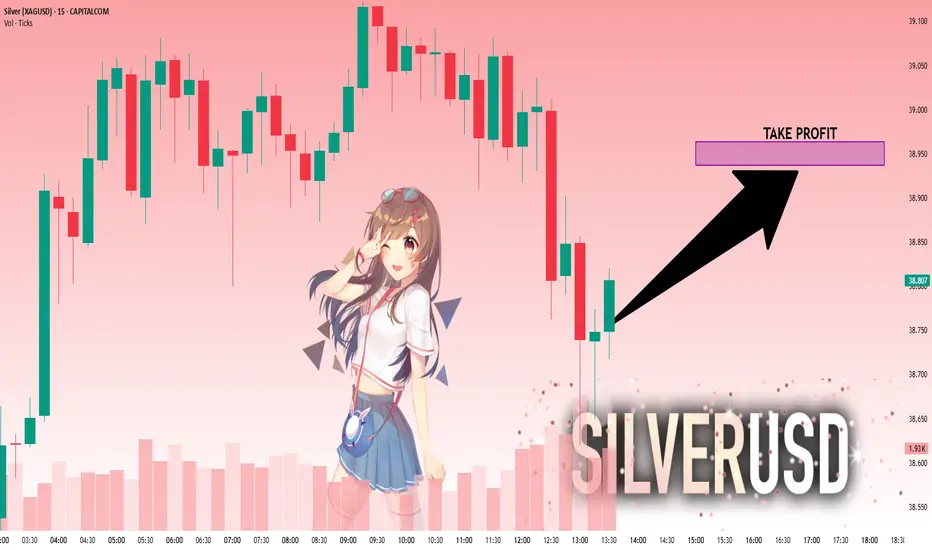
“Can This XAG/USD Setup Make You the Next Market Thief?”🏴☠️ Operation Silver Swipe — Thief Trading Heist Plan for XAG/USD
🚨 Target Locked: The Silver Vault 🧳🎯
🌟Hi! Hola! Ola! Bonjour! Hallo! Marhaba!🌟
Dear Market Hustlers & Chart Whisperers, 🕵️♂️💼📉💰
Step into the shadows with our stealth plan based on our signature Thief Trading Style—a mix of smart technicals and crafty fundamentals. Today, we’re eyeing XAG/USD (Silver) for a clean sweep. Here's how to gear up for the breakout job:
🎯 Entry Zone — “The Heist Is On!” 💥
📍Key Level: Break & Retest above 37.000 – that's your cue to act.
🔑Strategy:
Buy Stop Orders: Set above the breakout level
Buy Limit Orders: Use recent 15/30M swings for a sneaky pullback entry 🎯
🛑 Stop Loss — “Every Thief Has a Backup Plan” 🎭
Place your SL like a pro, not a panic button!
📌Recommended: Around 35.660 using the 4H nearest candle wick swing low place after the breakout entry.
⚠️Tip: Adjust based on your risk appetite, lot size, and number of entries. You’re the mastermind, not a minion.
🎯 Target — “Escape Route” 🏃♂️💸
📌 First checkpoint: 38.800
📌 Or take your loot early if the heat rises! (Overbought zones, trend traps, or reversal zones)
💡 Scalper's Shortcut 💡
Go only long for safety. If you’ve got the cash stack, jump in fast. If you’re more of a sneaky swing trader, follow the roadmap and trail your SL to secure that bag 🧳📈
🔍 Market Status
Silver’s in a Neutral Phase – but signs point to an upward getaway 🚀
Fueling this momentum:
Macro & Fundamental trends
COT Positioning
Intermarket Clues
Sentimental Signals
🔗 Read the full breakdown check there 👉🔗🔗🌏🌎!
📢 Trading Alert — News Release Caution ⚠️
Don’t get caught mid-escape during news bombs! 💣
✅ Avoid fresh entries during high-impact events
✅ Use trailing SL to lock in your gains and cover your tracks
💖 Smash the Boost Button if you vibe with this plan 💥
Support the crew and help keep the charts hot and the loot flowing. Your boost powers up our next big heist 🚁🔥
📡 Stay tuned for more street-smart setups... we rob the charts, not the rules! 🐱👤💸📊💎

SILVER Trading Opportunity! SELL!
My dear subscribers,
My technical analysis for SILVER is below:
The price is coiling around a solid key level - 38.415
Bias - Bearish
Technical Indicators: Pivot Points High anticipates a potential price reversal.
Super trend shows a clear sell, giving a perfect indicators' convergence.
Goal - 37.591
My Stop Loss - 38.905
About Used Indicators:
By the very nature of the supertrend indicator, it offers firm support and resistance levels for traders to enter and exit trades. Additionally, it also provides signals for setting stop losses
Disclosure: I am part of Trade Nation's Influencer program and receive a monthly fee for using their TradingView charts in my analysis.
———————————
WISH YOU ALL LUCK
Bitcoin pushes higher, but its not the only game in townBitcoin is up around 26% this year. A strong gain. But it’s not alone. The higher Bitcoin rises, the less the gains become in percentage terms. It's now in a different league, so a $1,000 or $10,000 move its necessarily what it used to be.
Meanwhile, Gold, silver and copper have also pushed higher in 2025. The Nasdaq 100 is up too. All signs point to a weakening US dollar.
When risk assets and commodities rally together, it's a signal. Investors are shifting. Not out of fear, but to diversify away from the dollar. This is a theme that’s building strength.
Gold is up nearly over 25% YTD. Silver even more. Copper, the industrial bellwether, has joined the rally. These aren’t just trades. They’re strategic moves. A hedge against dollar debasement, inflation, and long-term fiscal risks in the US.
The Nasdaq’s rise tells a similar story. Tech stocks benefit when yields fall and the dollar softens. Big tech also has global revenue exposure. A weaker dollar inflates their earnings in foreign currencies.
What ties all this together? Loss of confidence in the dollar as the sole reserve hedge. Too much debt, too much printing. Central banks know it. They’ve been buying gold for years. Now, retail and institutional investors are catching on.
Bitcoin, the digital alternative to gold, gets the headlines. But it’s part of a broader move. The USD remains the world’s most important currency. That’s not changing tomorrow. But its dominance is being questioned in ways we haven’t seen in decades.
This isn’t just a crypto rally. It’s a dollar diversification play. And it’s gaining momentum.
The forecasts provided herein are intended for informational purposes only and should not be construed as guarantees of future performance. This is an example only to enhance a consumer's understanding of the strategy being described above and is not to be taken as Blueberry Markets providing personal advice.

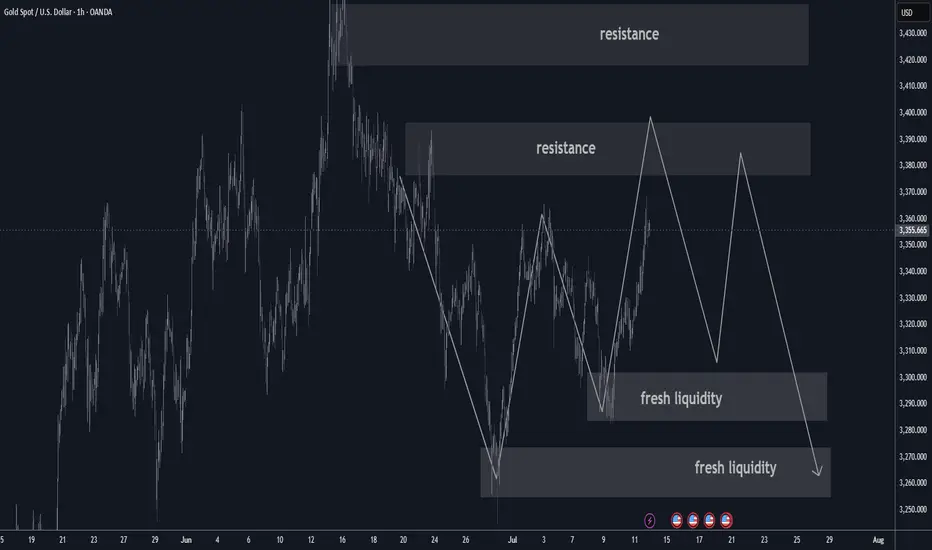
Gold Market Update and Recommended Strategy bulls/bears📉 Gold Holds Steady ~$3,354/oz
Moderate USD strength and tariff-driven safe‑haven buying have kept gold anchored in the $3,330–$3,360 zone.
🤝 Trade & Tariff Influence
Tariff headlines—from Canada’s 35% rate to broader threats—have supported gold by boosting safe‑haven demand heading into U.S. CPI.
📊 Technical Watch
Testing resistance at $3,360; full breakout above $3,342–$3,360 opens path to $3,400–$3,500.
Support sits at $3,330–$3,322 (20‑day EMA); breach risks pickup in short‑term bearish momentum.
💼 U.S. Macro & Fed Cues
Inflation data (June CPI due July 15) and Fedspeak ahead of the July blackout window are set to define next directional moves.
🌍 Central Bank Insight
World central banks are stockpiling gold at record rates, creating a bullish backdrop.
⚖ Range‑Bound Outlook
Expect gold to drift between $3,330–$3,360 near‑term, with upside if tariff/CPI triggers materialize.
📉 Short‑Term Bias
Neutral‑to‑bullish; momentum indicators are calm but could shift quickly on macro surprises.
📈 Med‑Term Outlook Bullish
Ongoing central bank demand, trade dynamics, and macro fundamentals still favor a gradual move toward $3,500+.
⭐ Updated Strategy Recommendations
Accumulate on dips near $3,330–$3,320.
Watch resistance at $3,360–$3,400 for profit‑taking or breakout buying opportunities.
Bears may focus on selling rallies near the upper range.
SILVER: Short Signal with Entry/SL/TP
SILVER
- Classic bearish formation
- Our team expects fall
SUGGESTED TRADE:
Swing Trade
Sell SILVER
Entry Level - 38.415
Sl - 38.910
Tp - 37.378
Our Risk - 1%
Start protection of your profits from lower levels
Disclosure: I am part of Trade Nation's Influencer program and receive a monthly fee for using their TradingView charts in my analysis.
❤️ Please, support our work with like & comment! ❤️

Canadian Venture index --- Inverse head & shouldersGold has reached unprecedented heights, approaching the $3000 mark—a prediction we made with precision. Now is the moment to turn our attention to silver and the mining sector.
To start, let's examine the Canadian venture index, which is displaying a promising inverse head and shoulders pattern. I am confident that the logarithmic projection will be achieved without much difficulty.

Silver to $38The move from March 2020 to August 2020
Was a measured move that played out to the Tee.
We have a similar structure building that projects to the High 30's
Suggesting #Gold move beyond ATH's and #Silver the beta play to move faster in an attempt to catch up, and move towards it's high's again.

SILVER: Strong Bullish Sentiment! Long!
My dear friends,
Today we will analyse SILVER together☺️
The market is at an inflection zone and price has now reached an area around 38.207 where previous reversals or breakouts have occurred.And a price reaction that we are seeing on multiple timeframes here could signal the next move up so we can enter on confirmation, and target the next key level of 38.594.Stop-loss is recommended beyond the inflection zone.
❤️Sending you lots of Love and Hugs❤️

SILVER - at cut n reverse area? what's next??#SILVER... market just reached at his resistance of the week and month.
that is around 38.20-25
keep close it and if market hold it then drop expected.
otherwise not
NOTE: we will go for cut n reverse above 38.20-25 on confirmation.
GOOD LUCK
TRADE WISELY

Silver: Daily Reversal Possible at Supply ZoneI'm anticipating a potential daily reversal in silver prices. Retail traders are maintaining a bullish stance, while commercial traders remain heavily short. The current price action suggests a possible reaction to a key supply area. What are your thoughts on the likelihood of a reversal, and what technical indicators might support or refute this potential shift?
✅ Please share your thoughts about SI1! in the comments section below and HIT LIKE if you appreciate my analysis. Don't forget to FOLLOW ME; you will help us a lot with this small contribution.

Silver Traces New Highs Last Seen in 2011As silver traces new 2025 records, surpassing 2012 highs above 37.50/ounce, it aligns further with the target of the inverted head and shoulders pattern that has extended on the chart between 2020 and 2024, within the 38–39 price zone.
This aligns with overbought momentum from the perspective of the monthly RSI, at levels last seen in 2020, strengthening the case for a potential pullback to recharge momentum—possibly back toward levels 35, or 32 and 29 in a steeper scenario.
Should the price trend hold above the 39-price zone, further gains can be forecasted toward 42, 46, and eventually the 50 high, in line with tech advancement.
- Razan Hilal, CMT

Silver bullish breakout support at 3686The Silver remains in a bullish trend, with recent price action showing signs of a continuation breakout within the broader uptrend.
Support Zone: 3686 – a key level from previous consolidation. Price is currently testing or approaching this level.
A bullish rebound from 3686 would confirm ongoing upside momentum, with potential targets at:
3814 – initial resistance
3865 – psychological and structural level
3920 – extended resistance on the longer-term chart
Bearish Scenario:
A confirmed break and daily close below 3686 would weaken the bullish outlook and suggest deeper downside risk toward:
3645 – minor support
3590 – stronger support and potential demand zone
Outlook:
Bullish bias remains intact while the Silver holds above 3686. A sustained break below this level could shift momentum to the downside in the short term.
This communication is for informational purposes only and should not be viewed as any form of recommendation as to a particular course of action or as investment advice. It is not intended as an offer or solicitation for the purchase or sale of any financial instrument or as an official confirmation of any transaction. Opinions, estimates and assumptions expressed herein are made as of the date of this communication and are subject to change without notice. This communication has been prepared based upon information, including market prices, data and other information, believed to be reliable; however, Trade Nation does not warrant its completeness or accuracy. All market prices and market data contained in or attached to this communication are indicative and subject to change without notice.

SILVER (XAGUSD): Correction is Over?!
It looks like Silver has finally completed a consolidation within
a wide horizontal parallel channel on a daily.
A new higher high formation today indicates coming growth.
Because if its Friday, I suggest looking for trend-following buy from Monday.
Let the market close above the underlined resistance to let it set a Higher Close
as well.
Look for buying after a pullback, aiming at 38.0 as the first goal.
❤️Please, support my work with like, thank you!❤️

XAG/USD (Silver) - Triangle Breakout (09.07.2025)The XAG/USD (Silver) pair on the M30 timeframe presents a Potential Buying Opportunity due to a recent Formation of a Wedge Breakout Pattern. This suggests a shift in momentum towards the upside and a higher likelihood of further advances in the coming hours.
Possible Long Trade:
Entry: Consider Entering A Long Position around Trendline Of The Pattern.
Target Levels:
1st Resistance – 3749
2nd Resistance – 3781
🎁 Please hit the like button and
🎁 Leave a comment to support for My Post !
Your likes and comments are incredibly motivating and will encourage me to share more analysis with you.
Best Regards, KABHI_TA_TRADING
Thank you.
Disclosure: I am part of Trade Nation's Influencer program and receive a monthly fee for using their TradingView charts in my analysis

Silver is Again in the Bullish directionHello Traders
In This Chart XAGUSD HOURLY Forex Forecast By FOREX PLANET
today XAGUSD analysis 👆
🟢This Chart includes_ (XAGUSD market update)
🟢What is The Next Opportunity on XAGUSD Market
🟢how to Enter to the Valid Entry With Assurance Profit
This CHART is For Trader's that Want to Improve Their Technical Analysis Skills and Their Trading By Understanding How To Analyze The Market Using Multiple Timeframes and Understanding The Bigger Picture on the Charts

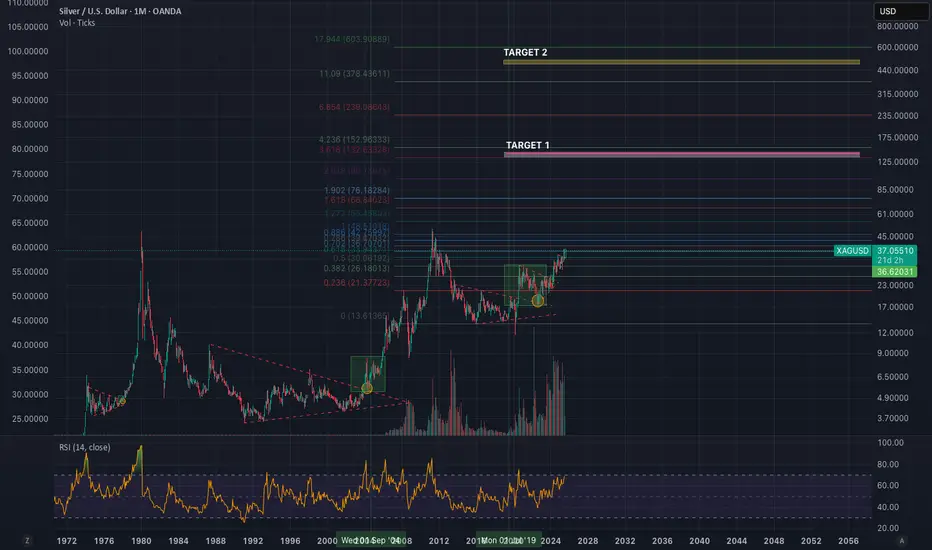
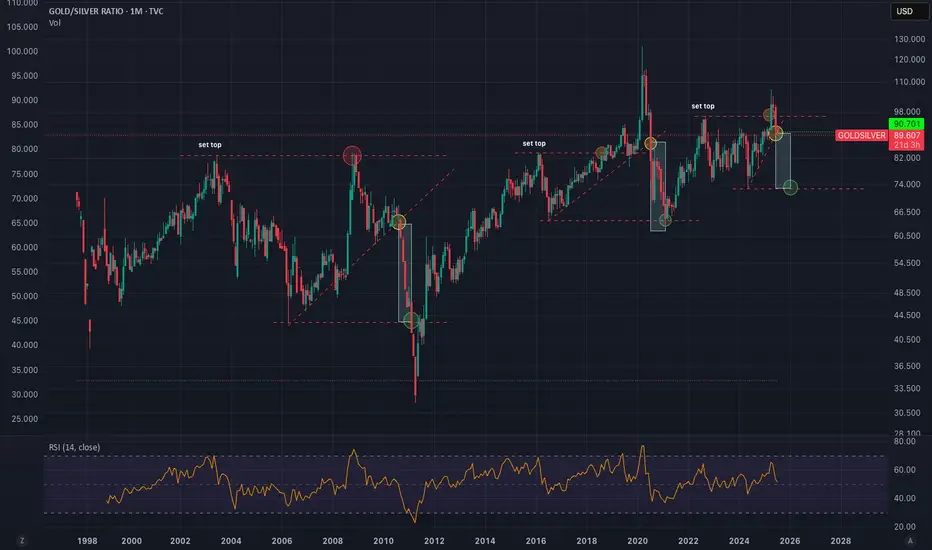
Gold/Silver Ratio to 72 Minimum - Imminent Silver BreakoutGoldSilver Ratio is following a clear pattern of behavior. We can expect a return to mean conservatively hitting 72 at a minimum. This puts silver at $46-58 if Gold doesn't move higher. I think we will see silver 5-10X over the next few years. Easy 25-50% in the short term (6-12 months).
Silver Spot to $136/oz then $477/ozThis could take multiple years to play out, my gold call 2-3 years ago was dead on. All I'm using are multi-fib confluences and the assumption that currency debasement and global liquidity will continue to increase over time. I am riding silver for the long haul. Watch Gold and for DXY bottoming pattern. Silver and Crypto move when DXY enters a momentum shift to the upside. Silver to $136-150 then $477-500 eventually.