SILVER: Bulls Are Winning! Long!
My dear friends,
Today we will analyse SILVER together☺️
The price is near a wide key level
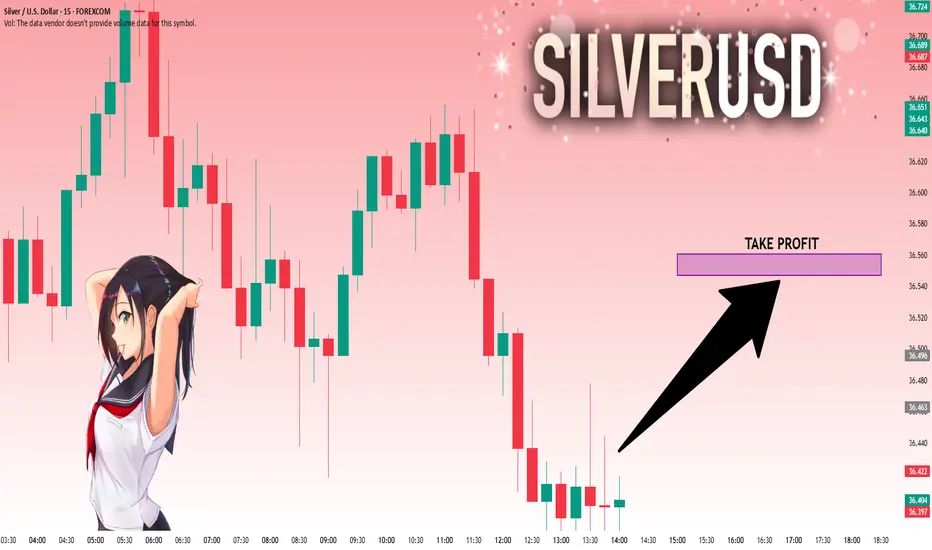
and the pair is approaching a significant decision level of 36.433 Therefore, a strong bullish reaction here could determine the next move up.We will watch for a confirmation candle, and then target the next key level of 36.547.Recommend Stop-loss is beyond the current level.
❤️Sending you lots of Love and Hugs❤️
Silver
SILVER: Local Bearish Bias! Short!
My dear friends,
Today we will analyse SILVER together☺️
The price is near a wide key level
and the pair is approaching a significant decision level of 36.435 Therefore, a strong bearish reaction here could determine the next move down.We will watch for a confirmation candle, and then target the next key level of 36.336..Recommend Stop-loss is beyond the current level.
❤️Sending you lots of Love and Hugs❤️

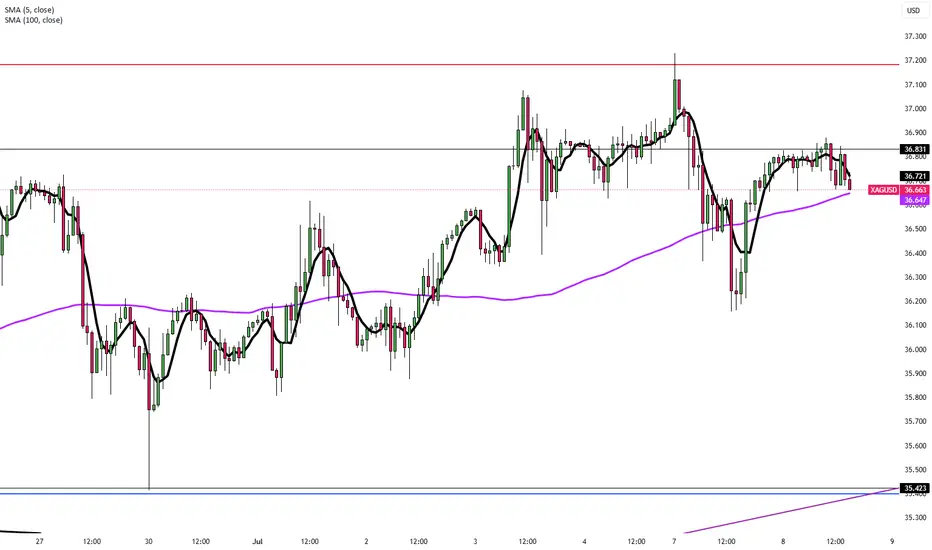
Silver Holds Near $36.80 on Tariff FearsSilver remains steady just below $37.00, hovering around $36.80 in Tuesday’s Asian session after a sharp rebound from the $36.15 level seen late Monday. The metal continues to trade in a tight range as conflicting market signals keep traders cautious.
Global trade tensions and geopolitical uncertainties, fueled by the U.S.’s upcoming tariffs on multiple countries and its hardline stance against BRICS-aligned nations, have elevated market risk perception. This has sparked a modest uptick in safe-haven demand, offering limited support to silver.
The strength of the U.S. Dollar and uncertainty surrounding future interest rate decisions are capping silver’s upside potential. Market participants remain focused on incoming economic data and central bank signals for clearer direction.
In the near term, silver is expected to stay volatile and highly reactive to geopolitical and economic headlines.
Resistance is at 37.50, while support holds at 35.40.
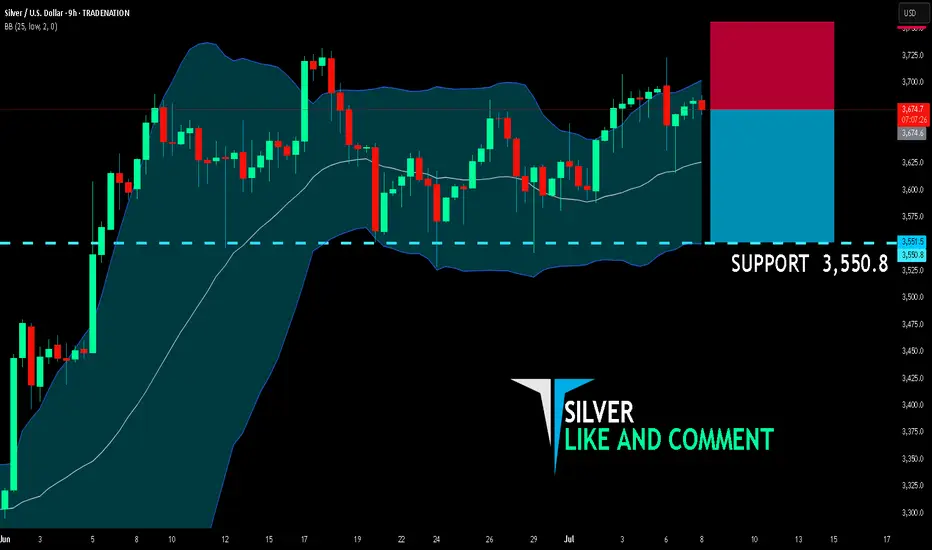
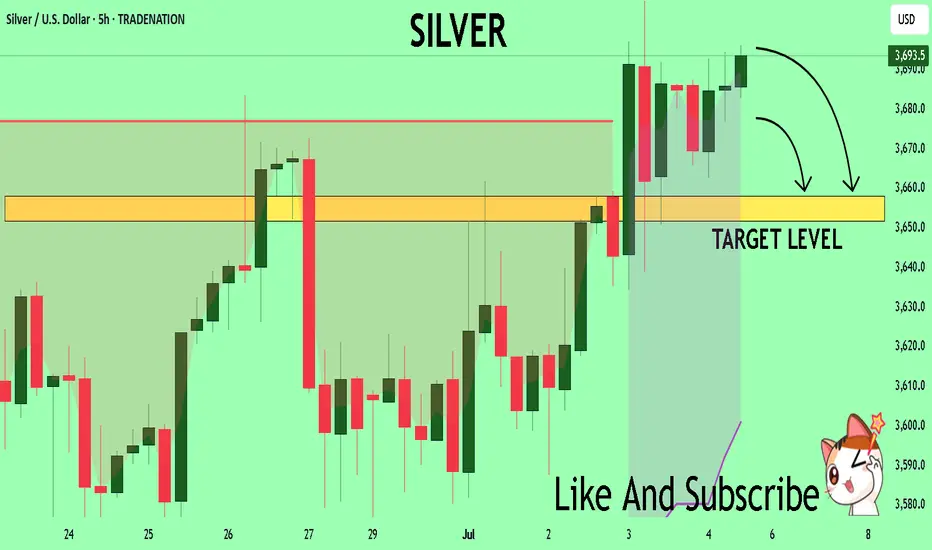
SILVER SENDS CLEAR BEARISH SIGNALS|SHORT
SILVER SIGNAL
Trade Direction: short
Entry Level: 3,674.6
Target Level: 3,550.8
Stop Loss: 3,756.2
RISK PROFILE
Risk level: medium
Suggested risk: 1%
Timeframe: 9h
Disclosure: I am part of Trade Nation's Influencer program and receive a monthly fee for using their TradingView charts in my analysis.
✅LIKE AND COMMENT MY IDEAS✅
SILVER: Will Go Up! Long!
My dear friends,
Today we will analyse SILVER together☺️
The in-trend continuation seems likely as the current long-term trend appears to be strong, and price is holding above a key level of 36.696 So a bullish continuation seems plausible, targeting the next high. We should enter on confirmation, and place a stop-loss beyond the recent swing level.
❤️Sending you lots of Love and Hugs❤️

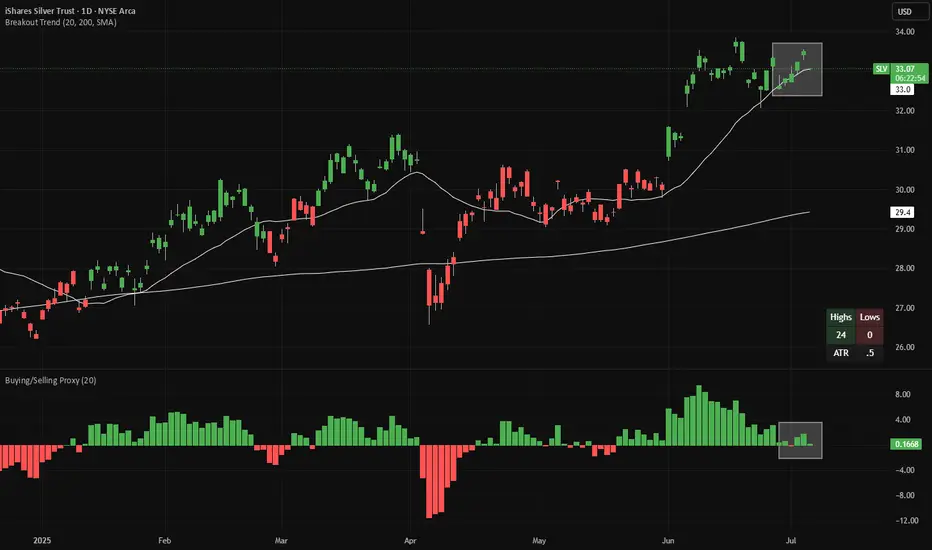
Long Silver - Buy the DipSilver is making 20-day highs (green candles in the main chart), while pulling back towards the 20D EMA line. Meanwhile, looking at a proxy of net buying/selling (bottom panel), we are almost at net selling levels.
There is good risk/reward to buy silver here, with a stop-loss if the price closes at a 20-day low. If a 20-day low is made, the candles will change color from green to red.
Both indicators (Breakout Trend and Buying/Selling Proxy) are available for free on TradingView.
Silver Holds Near 13-Year High Amid Tariff UncertaintySilver held above $36.80 Friday, near 13-year highs, as renewed trade tensions supported safe-haven demand. Markets grew cautious after Trump announced plans to send tariff letters, and as the House passed his tax and spending bill, expected to widen the deficit by over $3 trillion. Silver’s gains were capped by a surprisingly stronger June US jobs report, which eased recession fears and reduced near-term Fed rate cut pressure.
Resistance is at 37.50, while support holds at 35.40.
Silver sideways consolidation support at 3500The Silver price action continues to exhibit a bullish sentiment, underpinned by a prevailing rising trend. However, recent intraday moves indicate a corrective pullback, reflecting short-term consolidation within the broader uptrend.
Key Technical Levels:
Support:
3,500 – Primary support and previous consolidation zone; critical for maintaining bullish structure.
3,450 – Secondary support; potential downside target if 3,500 fails.
3,390 – Key lower support; aligns with a broader demand area.
Resistance:
3,720 – Immediate upside resistance; first target on a bullish bounce.
3,790 – Intermediate resistance; aligns with recent swing highs.
3,850 – Long-term resistance target; marks the upper boundary of the current bullish channel.
Scenario Analysis:
Bullish Continuation (Base Case):
A bounce from the 3,500 level would affirm the corrective pullback as temporary, with potential for a bullish continuation targeting 3,720, followed by 3,790 and 3,850 over a longer timeframe.
Bearish Reversal (Alternative Scenario):
A daily close below 3,500 would undermine the current bullish outlook and signal a deeper retracement, with downside risk toward 3,450 and potentially 3,390, where structural support may stabilize price.
Conclusion:
Silver remains structurally bullish, with the current pullback offering a potential entry point within the trend. The 3,500 level is the key pivot—holding above it supports further upside continuation, while a breakdown below would raise the risk of a deeper correction. Traders should watch for price action confirmation at this level to validate the next directional move.
This communication is for informational purposes only and should not be viewed as any form of recommendation as to a particular course of action or as investment advice. It is not intended as an offer or solicitation for the purchase or sale of any financial instrument or as an official confirmation of any transaction. Opinions, estimates and assumptions expressed herein are made as of the date of this communication and are subject to change without notice. This communication has been prepared based upon information, including market prices, data and other information, believed to be reliable; however, Trade Nation does not warrant its completeness or accuracy. All market prices and market data contained in or attached to this communication are indicative and subject to change without notice.

BRIEFING Week #27-28 : Distancing from US MarketsHere's your weekly update ! Brought to you each weekend with years of track-record history..
Don't forget to hit the like/follow button if you feel like this post deserves it ;)
That's the best way to support me and help pushing this content to other users.
Kindly,
Phil

Cheap jewellery (Silver XAG/USD)Setup
Silver is sitting just under multi-decade highs having broken above $34 resistance last month. The long term cup and handle pattern is still in place.
Signal
The price has been consolidating in what could be a bull flag pattern between 35 and 37. A breakout could trigger the next leg of the uptrend, whereas a drop below the bottom of the flag would imply a retest of 34.

SILVER Will Go Lower From Resistance! Short!
Here is our detailed technical review for SILVER.
Time Frame: 12h
Current Trend: Bearish
Sentiment: Overbought (based on 7-period RSI)
Forecast: Bearish
The market is approaching a significant resistance area 3,654.7.
Due to the fact that we see a positive bearish reaction from the underlined area, I strongly believe that sellers will manage to push the price all the way down to 3,536.0 level.
P.S
Please, note that an oversold/overbought condition can last for a long time, and therefore being oversold/overbought doesn't mean a price rally will come soon, or at all.
Disclosure: I am part of Trade Nation's Influencer program and receive a monthly fee for using their TradingView charts in my analysis.
Like and subscribe and comment my ideas if you enjoy them!

SILVER: Short Signal with Entry/SL/TP
SILVER
- Classic bearish setup
- Our team expects bearish continuation
SUGGESTED TRADE:
Swing Trade
Short SILVER
Entry Point - 36.935
Stop Loss - 37.204
Take Profit - 36.369
Our Risk - 1%
Start protection of your profits from lower levels
Disclosure: I am part of Trade Nation's Influencer program and receive a monthly fee for using their TradingView charts in my analysis.
❤️ Please, support our work with like & comment! ❤️

SILVER RESISTANCE AHEAD|SHORT|
✅SILVER has been growing recently
And the pair seems locally overbought
So as the pair is approaching a
Horizontal resistance of 3730$
Price decline is to be expected
SHORT🔥
✅Like and subscribe to never miss a new idea!✅
Disclosure: I am part of Trade Nation's Influencer program and receive a monthly fee for using their TradingView charts in my analysis.

SILVER Technical Analysis! SELL!
My dear followers,
I analysed this chart on SILVER and concluded the following:
The market is trading on 36.935 pivot level.
Bias - Bearish
Technical Indicators: Both Super Trend & Pivot HL indicate a highly probable Bearish continuation.
Target - 36.582
About Used Indicators:
A super-trend indicator is plotted on either above or below the closing price to signal a buy or sell. The indicator changes color, based on whether or not you should be buying. If the super-trend indicator moves below the closing price, the indicator turns green, and it signals an entry point or points to buy.
Disclosure: I am part of Trade Nation's Influencer program and receive a monthly fee for using their TradingView charts in my analysis.
———————————
WISH YOU ALL LUCK
SPY/QQQ Plan Your Trade End Of Week Update For 7-4Happy 4th of July
I've been very busy with projects and new tools for traders, as well as the new book I'm working on, and thought I would deliver an End Of Week update for everyone.
In this video, I cover the past Cycle Patterns and how they played out for the SPY/QQQ, Gold/Silver, and Bitcoin, as well as add some of my own insight related to the market trends.
All of my systems are still LONG and have not changed. I still believe this market is extremely overbought, and I believe it could roll over at any moment into a pullback - but we need to wait to see if/when that may/does happen.
Gold made a big move higher this week, and I believe that move could continue throughout July.
Bitcoin made a surprising Double-Top and is not rolling downward. Could be a breakdown in the markets as BTCUSD tends to lead the QQQ/NQ by about 3-5 days.
The SPY/QQQ rallied like a rocket all week. It was absolutely incredible to see the markets rally like this. But, I'm still cautious of a sudden rollover top.
I managed to catch some nice trades with options spreads this week, and my metals positions were on fire. I'm still trading from a "hedge everything" mode as I don't trust this rally, and I'm still watching for REJECTIONS near these new highs.
Stay safe and GET SOME.
DM me if you have any questions.
#trading #research #investing #tradingalgos #tradingsignals #cycles #fibonacci #elliotwave #modelingsystems #stocks #bitcoin #btcusd #cryptos #spy #gold #nq #investing #trading #spytrading #spymarket #tradingmarket #stockmarket #silver

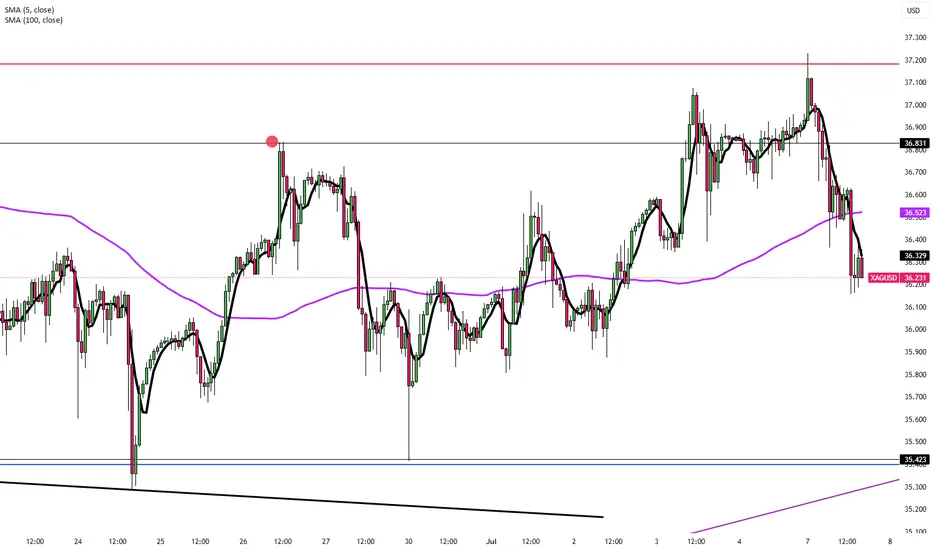
SILVER: The Market Is Looking Up! Long!
My dear friends,
Today we will analyse SILVER together☺️
The price is near a wide key level
and the pair is approaching a significant decision level of 36.830 Therefore, a strong bullish reaction here could determine the next move up.We will watch for a confirmation candle, and then target the next key level 36.903.Recommend Stop-loss is beyond the current level.
❤️Sending you lots of Love and Hugs❤️

MarketBreakdown | USDJPY, USDCAD, BITCOIN, SILVER
Here are the updates & outlook for multiple instruments in my watch list.
1️⃣ #USDJPY daily time frame 🇺🇸🇯🇵
The market nicely respected a rising trend line
and bounced from that, forming a high momentum bullish candle.
I think that the pair will continue rising and reach 145.8 level soon.
2️⃣ #USDCAD daily time frame 🇺🇸🇨🇦
The price is currently approaching an important confluence
zone based on a falling trend line and a horizontal support.
I will expect a pullback from that.
3️⃣ #BITCOIN #BTCUSD daily time frame
The price successfully violated a resistance line of a bullish
flag pattern and closed above that.
It is a critical bullish signal. I believe that the price will test
a current high then and will violate that with a high probability.
4️⃣ #SILVER #XAGUSD daily time frame 🪙
The market broke a resistance line of a bullish flag.
Uptrend is going to continue, and the price is going to reach 37,14 level soon.
Do you agree with my market breakdown?
❤️Please, support my work with like, thank you!❤️
I am part of Trade Nation's Influencer program and receive a monthly fee for using their TradingView charts in my analysis.

Resistance at $37.60. After that, look out above. This could be the next leg up to get to $40 and above. Some resistance around $37.60 to break first.
SILVER Short From Resistance! Sell!
Hello,Traders!
SILVER is trading in an
Uptrend but the price will
Soon hit a horizontal resistance
Area around 37,32$ from
Where we will be expecting
A local bearish correction
Sell!
Comment and subscribe to help us grow!
Check out other forecasts below too!
Disclosure: I am part of Trade Nation's Influencer program and receive a monthly fee for using their TradingView charts in my analysis.

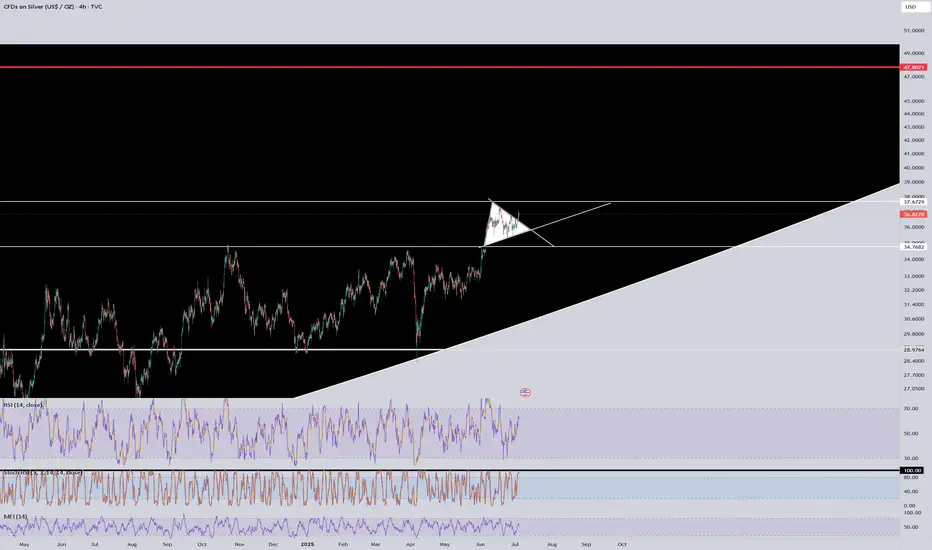
XAGUSD Strong accumulation waiting for a break-out. Silver (XAGUSD) has been trading within a 3-month Channel Up pattern and since the June 18 Higher High, it has entered a Descending Triangle.
This has previous been an Accumulation pattern, which after broken to the upside, it led to June's High. Similarly, we expect a bullish break-out once the 4H RSI breaks above its MA, and as long as the 4H MA200 (orange trend-line) holds, we expect a +15.50% minimum rise (like the first Bullish Leg of the Channel Up), with our Target se at 40.500.
-------------------------------------------------------------------------------
** Please LIKE 👍, FOLLOW ✅, SHARE 🙌 and COMMENT ✍ if you enjoy this idea! Also share your ideas and charts in the comments section below! This is best way to keep it relevant, support us, keep the content here free and allow the idea to reach as many people as possible. **
-------------------------------------------------------------------------------
💸💸💸💸💸💸
👇 👇 👇 👇 👇 👇

SILVER: Local Bearish Bias! Short!
My dear friends,
Today we will analyse SILVER together☺️
The in-trend continuation seems likely as the current long-term trend appears to be strong, and price is holding below a key level of 36.897 So a bearish continuation seems plausible, targeting the next low. We should enter on confirmation, and place a stop-loss beyond the recent swing level.
❤️Sending you lots of Love and Hugs❤️

SHORT ON SILVER XAG/USDSilver has built lots of sell side liquidity since June 10 and should now be ready to sweep it.
I will be selling silver to the next demand level.

Gold Market Update: Stuck in summer time range / SeasonalityGold is stuck so far last 4-6 weeks in tight range trading conditions
due to summer time seasonality also strong gains previously
expecting range locked conditions in July as well here's an
overview of 5 years and 10 years of seasonality data by month
until at least August expecting dead market conditions it's best
to focus on trading the range or trading with automated algo instead.
Here are the two tables showing month-over-month percent changes in gold prices (London PM fix USD/oz) for June, July, and August:
| Year | June Close | July Close | August Close | June % | July % | August % |
| ---- | ---------: | ---------: | -----------: | -----: | ------: | -------: |
| 2023 | 1,942.90 | 1,951.02 | 1,918.70 | –0.04% | +0.42% | –1.68% |
| 2022 | 1,836.57 | 1,732.74 | 1,764.56 | –5.65% | +1.80% | +1.80% |
| 2021 | 1,834.57 | 1,807.84 | 1,785.28 | –1.47% | –1.48% | –1.22% |
| 2020 | 1,761.04\* | 1,771.65\* | 1,968.16\* | +8.66% | +11.19% | +10.99% |
| 2019 | 1,342.66\* | 1,413.39\* | 1,523.00\* | +5.29% | +7.95% | +7.74% |
| 2018 | 1,270.00\* | 1,230.00\* | 1,194.00\* | –1.09% | –3.15% | –3.02% |
| 2017 | 1,257.00\* | 1,243.00\* | 1,280.00\* | +0.72% | –1.10% | +2.93% |
| 2016 | 1,255.00\* | 1,364.00\* | 1,322.00\* | +3.24% | +8.67% | –3.11% |
| 2015 | 1,180.00\* | 1,172.00\* | 1,116.00\* | –2.06% | –0.68% | –4.69% |
| 2014 | 1,320.00\* | 1,311.00\* | 1,312.00\* | –0.65% | –0.68% | +0.08% |
🔍 Summary Highlights
June has been weak more often than not—negative in 6 of the past 10 years.
July shows modest gains overall—positive in 7 of the last 10.
August is the strongest summer month—positive 6 times out of the past 10, with several double-digit y/y gains (like +10.99% in 2020).
