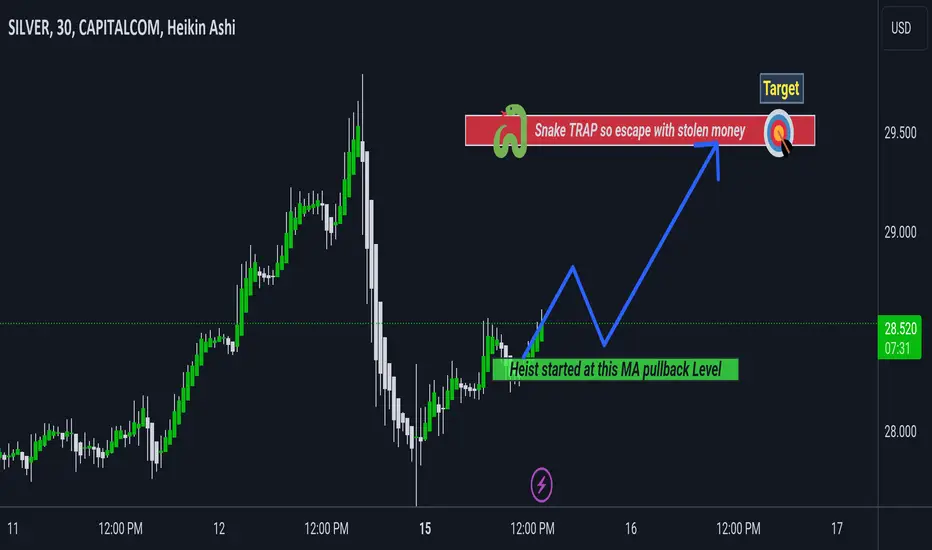
SILVER XAGUSD Bullish Robbery PlanMy Dear Silver Robbers / Traders,
This is our master plan to Heist Bullish side of SILVER MARKET based on Thief Trading style Analysis.. kindly please follow the plan i have mentioned with target in the chart focus on Long entry, Our target is Red Zone that is High risk Dangerous area market is overbought / Consolidation / Trend Reversal at the level Bearish Robbers / Traders gain the strength. Be safe and be careful and Be rich.
Loot and escape on the target 🎯 Swing Traders Plz Book the partial sum of money and wait for next breakout of dynamic resistance level, Once it is cleared we can continue our heist plan to next target.
support our robbery plan we can make money & take money 💰💵 Join your hands with US. Loot Everything in this market everyday.
Silveranalysis

Be second will be more profitable - Time for SilverAfter make 29 peak, I have been thinking of short since 28.5 and take 2 short. It can be buy on 26.2 as spot. I care about the 25.5-24.5 area as pos. The last place I would try would be the 23.3. I think it will outperform gold and give better results on the rise.
Buy more silver be result

SILVER - NEW BREAKOUT 📉Hello Traders !
The Silver Price Formed a Descending Triangle Pattern.
At The Moment, The Support Level is Broken !
So, I Expect a Bearish Move 📉
-----------
TARGET: 25.95000🎯

SILVER XAGUSD Bearish Money Heist PlanMy Dear Robbers / Traders,
This is our master plan to Heist Bearish side of Silver Jewelry based on Thief Trading style Technical Analysis.. kindly please follow the plan i have mentioned with target in the chart focus on Short entry, Our target is Red Zone that is High risk Dangerous area market is overbought / Consolidation / Trend change / Strong Pullback happens at the level Bear Robbers / Traders gain the strength. Be safe and be careful and Be rich.
Loot and escape on the target🎯.
support our robbery plan we can make money & take money 💰💵 Join your hands with US. Loot Everything in this market everyday.

Silver looks like it could take another 10% haircut before 🚀"That's a HUUUUGE wick" - Deuce Bigalow
Not uncommon for PA to come back down to touch the 20ema - which intersects a big trendline AND illustrates a backtest to the broken downward trendline. I anticipate this move happening fast, and could be combined with a minor market drop overall.
Exo-political situation that's escalating is the USDJPY - and the BOJ is taking it's good ole time with correcting its currency. When they dump treasuries I anticipate a vertical trajectory of precious metals AND miners. When that happens (not IF) that will over-ride any PA - so it might be wise to start building longer positions i.e. OTM call options slated for July expiration ( AMEX:AGQ ).
Since all Central Banks are reactionary in nature, the FED will wait till something breaks in the bond/treasury market but that can't happen until the BOJ dumps treasuries. And that can't happen until the dollar's ascent forces them to do this. So I see a higher dollar still, which will reflect the blunting of precious metals.

$SILVER is approaching the retest zoneIn my previous ideas, i highlighted that #silver #xagusd has need to retest and success to confirm the rally. Orange box is the retest zone and must not be lost.

SILVER LINING ahead.Hi, 1PERCENT here.
Silver head a "huge" weekly candle close this week with +10% which is a pretty big move for such an asset.
It broke through a resistance zone that it was unable to break since it lost the price zone in July 2021.
Now that it broke the descending trendline that started in 2011(!) & that 3 year resistance zone, I believe we are going to have some really big moves.
In a TA perspective, it would be healthier for TVC:SILVER to re-test that previous resistance zone turned support and then, continue upwards.
One possibility of this happening is the next scenario:
1) Goes up short-term until the Blue range highs $28.65, which also is a Yearly supply zone,
2) Rejection & re-test the recently broken Green zone, maybe a wick into the Blue mid-range $25.28
3) Continuation upwards, re-challenging the Yearly Supply.
However, it could also go like this:
When Silver goes, she goes hard.

Update on Silver After AB=CD CompletionYou may recall the Research Team highlighted AB=CD bullish completion at $26.79 on the H4 timeframe for spot silver (XAG/USD) last week. Subsequent to this, price action recently came within reaching distance of the 38.2% Fibonacci retracement ratio at $27.84 before rotating southbound and pencilling in a potential higher low at $26.94 earlier today.
AB=CD Bearish Completion?
The 38.2% Fibonacci retracement ratio continues to call for attention for those long the AB=CD pattern as the initial upside objective. Should silver continue to be bid from current price, the 38.2% ratio actually converges closely with a 100% projection ratio at $27.99, which represents an AB=CD bearish formation. Were further upside to be seen beyond these levels, attention will likely be drawn to the 61.8% Fibonacci retracement ratio at $28.60, a level that shares chart space with a 1.618% Fibonacci projection ratio at $28.64, an ‘alternate’ AB=CD bearish formation.

SILVER MORE BULLISH TILL 35$ IN 2024HELLO FRIENDS
As I can see silver hit all time high 30$ in this bull run and now retrace we are expecting a new ATH in Silver with the fundamental and technical views all dose Time matter Friends chart is crystal clear for entries on this pair for more info Stay tuned.
Share Ur thoughts it helps many traders.

SILVER BEST BUYING ZONE !!!!HELLO TRADERS
As I can see Silver is testing now a strong support level which is a great entry zone for buying here. Silver is still not moved as like gold and other commodities has done, we expected this pair will move till design levels and this is a best zone with a very low risk and higher rewards let's see what markets bring to us. Charts always talk......
Share Ur views with us on Silver chart it help all of us Stay Tuned for more updates.

Dive into the world of options with our latest Silver analysis!In the next two options, with expiration dates on May 28 and June 25, bullish sentiment appeared on silver. Starting on April 19, the participant collected bullish spreads with construction sites 31/31.5 and 32.5/35 in his portfolio.
Based on the delta values of these strikes, these spreads can be classified as aggressive. The following is noteworthy: The position set has a systemic character, even in a negative scenario. But We cannot claim that the participant holds these portfolios without hedging.
Further monitoring of the outflow/inflow of open interest will give a hint about the participant's actions and a sentiment for further price movement.

SILVER XAG/USD Bearish Heist plan to make money 🤑💰Dear Silver Robbers,
This is our master plan to Heist Bearish side of SILVER XAGUSD market. kindly please follow the plan i have mentioned in the chart focus on Short entry, Our target is Green Zone that is High risk Dangerous Tiger walking area. Be safe and be careful and Be rich.
Loot and escape near the target 🎯
support our robbery plan we can make money take money 💰💵 Join your hands with US. Loot Everything in this market everyday.

🚨🚨🚨Oh boy - Silver is gonna 🚀A TTM Squeeze on the Daily, Weekly and Monthly = a huge move is coming.
I believe Powell will talk about adjusting the acceptable inflation rate in his speech tomorrow from 2% to 4%. He will appear dovish and inflation will rocket in the dollar starting April when the gamma has rolled off the quarter.
I've also been noticing that precious metals are higher priced in China's SGE Exchange and rises in the morning and gets hit down during NY time. This means China is setting the prices of silver and gold and that the FED has lost control of inflation.
In June the FED will end up hiking to 8% and the markets will take a dive. Then a false flag will be used to to justify the FED lowering rates as the dollar TVC:DXY ascends to 120-160. This will explode hyperinflation after the Dollar implodes (2026-2027), just in time for the FED to roll out the CBDC's under social credit scores. Please stock up on freeze dried food, water, ammo and physical silver and gold - and stay away from the cities. There's a good possibility the election will be called off under Martial Law.
I will release a stock pick I think has some peculiarities I noticed that will exponentially skyrocket if this happens. Kinda a lottery ticket. It's not financial advice so beware - and I also will be investing in this stock as well so I'll have skin in the game.
If by any chance the market interprets what Powell says as Hawkishness, like NO interest rate cuts this year FOR SURE, and that they're still targeting 2% inflation rate than all bets are off and precious metals will sell off before some summer event that causes the FED to cut rates (the false flag attack). Either way, precious metals will be the canary in the coalmine to watch going forward.

XAGUSD Pair : XAGUSD ( Silver / U.S Dollar )
Description :
Symmetrical Triangle as an Corrective Pattern in Short Time Frame
Break of Structure
RSI - Divergence
Fibonacci Level - 61.80%
Impulse Correction

Gold Shines in Emerging Markets, While Silver Seeks RefugeThe recent economic landscape has painted a fascinating picture for precious metals. Gold has emerged as a champion for investors in economies with developing currencies, like the Turkish Lira (TRY), Indian Rupee (INR), and Chinese Yuan (CNY). Conversely, silver seems to be finding favor as a store of value in more established economies with mature currencies, like the Euro (EUR). Understanding the economic forces behind this divergence can provide valuable insights for investors.
Emerging Market Reliance on Gold
For emerging economies, gold has historically served as a hedge against inflation and currency devaluation. As these economies experience higher inflation rates and potentially weaker currencies compared to their mature counterparts, the allure of gold's perceived stability grows.
• Inflation Hedge: When inflation erodes the purchasing power of local currencies, gold's historical tendency to maintain its value becomes especially attractive. Investors in these markets can turn to gold to preserve their wealth.
• Currency Devaluation Shield: A weakening local currency can make imports more expensive and hinder economic growth. Gold, on the other hand, is often seen as a global currency, offering a sense of security against fluctuations in the domestic currency.
• Safe Haven Appeal: Emerging economies can be more prone to political and economic instability. Gold's reputation as a safe-haven asset provides a sense of security during turbulent times.
Silver's Appeal in Mature Economies
While gold thrives in emerging markets, silver seems to be resonating with investors in mature economies for different reasons:
• Industrial Applications: Silver's extensive use in industrial applications, particularly in the green energy sector with solar panels and electric vehicles, makes its price more susceptible to economic growth. As mature economies tend to be more stable and have a higher potential for sustained growth, silver can benefit from this positive economic outlook.
• Lower Barrier to Entry: Compared to gold, silver has a lower price point. This makes it a more accessible investment option for a wider range of investors in established economies, where wealth distribution may be more even.
• Hedging Against Stock Market Volatility: While not as traditional a safe haven as gold, silver can offer some protection against stock market downturns. Its price often exhibits a positive correlation with the stock market during periods of economic growth, but it can also hold its value or even rise slightly during market corrections.
The Interplay Between Currencies and Precious Metals
The strength of a country's currency can also influence investor preferences for precious metals.
• Strong Dollar, Weaker Silver: A strong U.S. dollar (USD) can make dollar-denominated assets like silver cheaper for investors holding other currencies. This can potentially lead to increased demand for silver in economies with weaker currencies.
• Euro's Stability, Silver's Holding Power: The Eurozone, though facing its own economic challenges, offers a more stable currency environment compared to some emerging markets. This stability could make silver an attractive option for investors seeking long-term value storage without the volatility associated with emerging market currencies.
Investing Considerations
Gold's recent performance in emerging markets and silver's traction in mature economies highlight the importance of considering the interplay between economic conditions, currency fluctuations, and investor preferences.
• Diversification: Including both gold and silver in a portfolio can provide diversification, offering protection against different economic scenarios.
• Long-Term Outlook: Both gold and silver have a history of holding their value over time. Investors should consider their investment horizon and risk tolerance when deciding how much of their portfolio to allocate to these precious metals.
• Economic Context: Understanding the specific economic climate, both globally and within the investor's own country, can be crucial for determining which precious metal may be a more suitable investment choice.
The ongoing dance between gold and silver in the context of emerging and mature markets presents a dynamic and ever-evolving investment landscape. By staying informed about economic trends and understanding the drivers behind investor preferences, individuals can make informed decisions about incorporating these precious metals into their portfolios.

Up to 207% gains in SilverSilver has given a strong impulsive break out from the long term trendline resistance after long accumulation phase.
Big volume candles since July 2023 confirm healthy accumulation by strong hands.
Currently price is in Primary Wave 3 which can end somewhere near 66 level. A potential gain of 135% by end of this year.
Wave 5 target is around 87-88 levels which can be achieved by the end of 2026. Around 207% gains from CMP within 3 years.
Do your own due diligence before taking any action.
Peace!!

SILVER BEST BUY 24$ LEVEL SHORT SILVE NOW ALL trading ideas have entry point + stop loss + take profit + Risk level.
hello Traders, here is the full analysis for this pair, let me know in the comment section below if you have any questions, the entry will be taken only if all rules of the strategies will be satisfied. I suggest you keep this pair on your watchlist and see if the rules of your strategy are satisfied. Please also refer to the Important Risk Notice linked below.
Disclaimer

Silver XAGUSD bullish Robbery Plan to make money 💰Dear Robbers,
This is our Scalping plan to Heist Bearish side of SILVER. Be safe and Be rich. Loot and escape near the target 🎯
Note: You should compare your own analysis once and then take a trade.
USAS is currently in an accumulation area between $0.20-0.25Below 0.20 is a danger zone, so I wll be having stop loss at $0.19 and keep buying at $0.20-$0.25. And looking to sell half at $0.45.
Long-term, we are looking at a $0.88 sell level.

SILVER Seeks Support at $22.00 Amidst Rate Cut ExpectationsOn Monday, silver experienced a sharp downturn, revisiting the $22.00 mark, reflecting a more than 2.5% decrease from its previous close. Market participants swiftly adjusted their expectations of early rate cuts by the Federal Reserve (Fed), leading to a substantial sell-off in the white metal.
Technical Analysis:
From a technical standpoint, the current price is positioned in a crucial support area around $22.00. This zone is fortified by a dynamic trendline, historically supportive of price rebounds. Additionally, the 78.6% Fibonacci level acts as a potential discount area, offering a foundation for the price to find support. The Stochastic indicator remains in oversold conditions, signaling the potential for a rebound. Anticipating a recovery, our outlook targets a return to $24.50 and $26.00 in extension.
Economic Landscape:
Turning to economic news, the CME Fedwatch tool suggests that investors are now eyeing a potential interest rate cut in May. This shift in sentiment is attributed to persistent price pressures driven by robust household spending and favorable labor market conditions. The upcoming focus of the week will be on the release of United States Q4 Gross Domestic Product (GDP) data scheduled for Thursday. A positive GDP reading would reinforce the narrative of 'higher interest rates,' aligning with the Fed's cautious approach towards premature rate cuts.
Outlook:
As silver grapples with the $22.00 support, the interplay of technical factors and market sentiment becomes crucial. The dynamic trendline and Fibonacci support offer a potential springboard for a price rebound. However, the economic landscape, particularly the GDP data release, will significantly influence the metal's trajectory. Traders are advised to closely monitor developments to navigate potential price fluctuations in the coming days.
Conclusion:
The silver market finds itself at a critical juncture, seeking support at $22.00 amid shifting expectations of Fed rate cuts. Technical indicators suggest the potential for a rebound, yet the economic data release later in the week will undoubtedly play a pivotal role in determining silver's path. Traders should exercise caution, staying adaptable to evolving market dynamics as they unfold throughout the week.
Our preference
Long positions Above Support Area $20 with targets at 24.50 & 26 in extension.

Silver is looking like danger!!I assume we will see an overthrow of the highs in a scam wick to close the shorts and then the fall will start.
Everyone thinks we are in risk on??? Have you seen the volume profiles in the legs down?
I have remover 80% of my money from the exchanges.
I sold my paper silver.
Any ideas on rotations???
NOT FINANCIAL ADVICE!!!!!

Gold, How High Can it Go?Gold (June) / Silver (May)
Gold, yesterday’s close: Settled at 2351.0, up 5.6
Silver, yesterday’s close: Settled at 27.807, up 0.304
Gold futures have now set a fresh record high for the eighth straight session. Although Silver is well below its 1980 and 2011 record highs of $50, the underlying strength exuded in recent sessions is certainly nothing to ignore. The first task for Silver is clearing and holding above what has become a psychological barrier at $30. Days like yesterday, where what feels like a precipitous drop is quickly reversed back into positive territory, are likely going to become more of the norm, but with wider ranges, and doing so is an exhibition of such underlying strength. Still, risk management is key and that is why our trade desk is here to help, always feel free to reach out.
Gold is in unchartered territory, therefore, we are using extension levels from multiple historical ranges, and it is trading into a sticky spot redefined by 2366.1-2372.5 as today’s pivot and point of balance and 2380.2-2384.5 as major three-star resistance. With Silver, continued resilience above a new handle (28 versus 27) should pave the way for a test of major three-star resistance at 28.52-28.57 on the session. From there, we brace for tomorrow’s CPI data.
Bias: Bullish
Resistance: 2380.2-2384.5***, 2400**, 2466.5***, 2539.3-2560.1****
Pivot: 2366.1-2372.5
Support: 2348.1-2351***, 2344.3-2345.4***, 2321.7-2325.3***, 2315.7**, 2298.7-2299.6***, 2285.7-2286.2***, 2279-2281.8***
Silver (May)
Resistance: 28.20**, 28.52-28.57***, 28.71-28.90**, 29.22***, 29.88-30.35***
Pivot: 27.99-28.01
Support: 27.80-27.87**, 27.34-27.51***, 26.93-26.97***, 26.40-26.48***
CME Real-time Market Data help identify trading set-ups and express my market views. If you have futures in your trading portfolio, you can check out on CME Group data plans available that suit your trading needs www.tradingview.com
*Trade ideas cited above are for illustration only, as an integral part of a case study to demonstrate the fundamental concepts in risk management under the market scenarios being discussed. They shall not be construed as investment recommendations or advice. Nor are they used to promote any specific products, or services.
Futures trading involves substantial risk of loss and may not be suitable for all investors. Trading advice is based on information taken from trade and statistical services and other sources Blue Line Futures, LLC believes are reliable. We do not guarantee that such information is accurate or complete and it should not be relied upon as such. Trading advice reflects our good faith judgment at a specific time and is subject to change without notice. There is no guarantee that the advice we give will result in profitable trades. All trading decisions will be made by the account holder. Past performance is not necessarily indicative of future results.

Silver, the most undervalued asset on earth. As you can see, this train is about to leave. There's still time to get on board. Probably the easiest trade you'll ever make.
