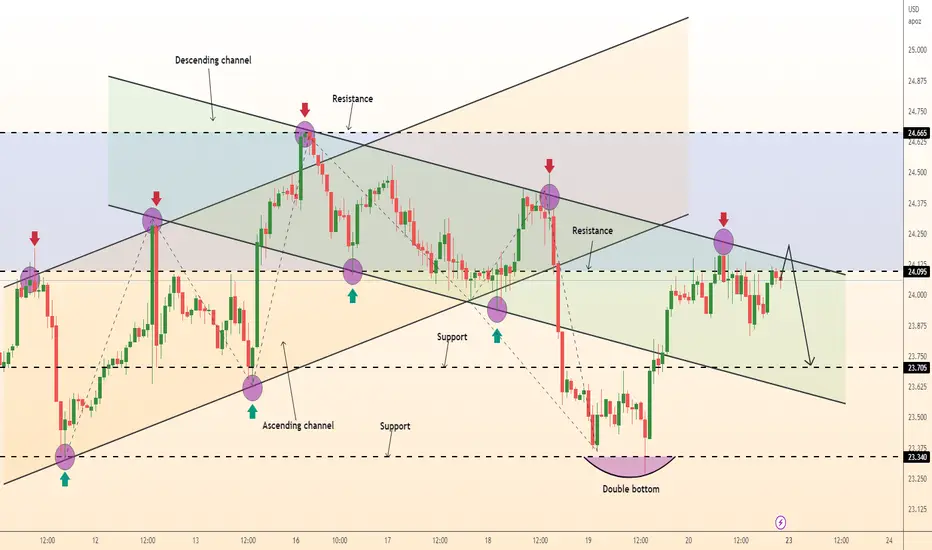
DeGRAM | SILVER downward channelSilver is consolidating at resistance on the higher timeframes.
Price action is moving in a downward channel .
If the market fails to break through the resistance level , we can look for selling opportunities.
We anticipate a short-term pullback.
-------------------
Share your opinion in the comments and support the idea with like. Thanks for your support!
Silveranalysis

Silver has started a new, major impulsive wave 3.The silver market began the initial subwave of a new, major impulsive wave, marked as the third in a sequence. This cyclical pattern can be traced back to the year 1932, with the completion of wave one in 1968, the corrective wave two in 1971, the impulsive wave three in January 1980, the corrective wave four in 1991, and ultimately, a truncated fifth wave that reached its peak in April of 2011. This entire sequence can be considered as the first impulsive wave in an even higher degree. The second corrective wave ended in March of 2020, with support being found at the 0.236 Fibonacci level. Currently, silver is preparing for what is expected to be the most explosive and unpredictable impulsive wave three in a very long-term scale.
Resistance points include:
- $24.69 (0.382 Fibonacci extension level)
- $26.55 (0.238 Fibonacci retracement level)
- $45.29 (0.382 Fibonacci extension level)
- $49.83 (all-time high)
- $83.11 (0.618 Fibonacci; golden ratio)

XAGUSDSILVER touched top line of important correction. I think silver is looking GOLD and DOLLAR INDEX. DXY is really important for this chart, if DOLLAR takes power, SILVER can have good correction.

Silver more precious than goldSilver performed better than Gold in percentage term during each crisis.
We will study into the history of Silver and Gold. And during each crisis, Gold and Silver always performed exceptionally well compare to many other markets.
Content:
. Its price behavioural leading to each peak
Price behavioural studies provide us a fundamental reason for every price movement. Especially the significant ones.
Micro Silver Futures
Minimum fluctuation
0.001 = $1
0.005 = $5
0.01 = $10
0.1 = $100
1 = $1,000
Disclaimer:
• What presented here is not a recommendation, please consult your licensed broker.
• Our mission is to create lateral thinking skills for every investor and trader, knowing when to take a calculated risk with market uncertainty and a bolder risk when opportunity arises.
CME Real-time Market Data help identify trading set-ups in real-time and express my market views. If you have futures in your trading portfolio, you can check out on CME Group data plans available that suit your trading needs www.tradingview.com

No breakout for Silver yetXagUsd is struggling to breakout. Look like it is making a U-turn. In that case I expect it to drop to 22. Overall I am bullish on Silver this year and long term. One day XAG will breakout $50 level up to $90-$100.

SILVER (XAGUSD): Key Levels to Watch 🪙
Here is my latest structure analysis for Silver.
Resistance 1: 24.27 - 24.55 area
Resistance 2: 25.86 - 26.2 area
Support 1: 23.1 - 23.23 area
Support 2: 22.55 -22.6 area
Support 3: 22.00 - 22.20 area
Consider these structures for pullback/breakout trading.
❤️If you have any questions, please, ask me in the comment section.
Please, support my work with like, thank you!❤️

Silver rally is just getting started.1. Silver will remain in a supply deficit in 2023.
2. The US dollar index is plunging. Moved from $115 to $102.
3. Silver is in high demand as China reopens.
4. Silver is already in a bull run having jumped by 38% from its 2023 lows.

DeGRAM | SILVER descending channel testSilver is consolidating at resistance on the 4H, but it has recently dropped below it.
Price action returned to resistance and dynamic resistance.
If the market fails to break through the resistance level , we can sell from the confluence level.
We anticipate a short-term pullback and a retest of the channel.
-------------------
Share your opinion in the comments and support the idea with like. Thanks for your support!
Silver Uptrend MoveIn the silver chart on the daily timeframe, our trend following level is $23.50, but we can expect a drop to $22.10 at the daily close below this level. As long as it stays on the trend, the $25.50 target will hold.

Silver price needs more positive momentum - AnalysisSilver price hovers around the EMA50, and didn’t show any strong move since yesterday, to keep our positive overview for the upcoming period, which depends on the price stability above 23.05, waiting to visit 24.20 followed by 25.00 levels as next main targets.
We should note that breaking 23.05 will stop the suggested rise and press on the price to achieve additional bearish correction.

Fibonacci Retracement on SilverTVC:SILVER
Fibonacci Retracement applied on daily timeframe of TVC:SILVER suggests that support at current levels will help it test around 24.3 & 24.9 yet not sustain it; but ultimately it will bounce back from weekly price level of 24.03.

All silver traders need to watch these six data points It's important to stay informed about the market and various data reports that can affect silver prices. Here are some key data reports that traders should watch when trading silver:
1-Gold-silver ratio: The gold-silver ratio is the number of ounces of silver that are needed to purchase one ounce of gold. A high ratio indicates that silver is relatively cheaper compared to gold, while a low ratio means that silver is relatively more expensive. Traders can use this ratio to assess the relative value of silver and make informed buying and selling decisions.
2-Industrial demand: A significant portion of silver is used in industrial applications, such as electrical conductors, batteries, and medical equipment. Therefore, changes in industrial demand can have a significant impact on silver prices. Traders should watch for data on industrial production and manufacturing activity, as well as any news that could affect the demand for silver in these industries.
3-Investment demand: Silver is also used as a safe haven asset and can be bought and sold as a form of investment. Changes in investor sentiment and demand for silver as an investment can have a significant impact on prices. Traders should watch for data on investment demand, such as the level of silver holdings in exchange-traded funds (ETFs) and the level of silver bullion held by central banks.
4-US dollar strength: Silver prices are often inversely correlated with the strength of the US dollar. When the dollar is strong, silver prices tend to be weaker, and vice versa. This is because a stronger dollar makes silver more expensive for buyers using other currencies, which can decrease demand and lower prices. Conversely, a weaker dollar can increase demand for silver and push prices higher. Traders should watch for data on the value of the dollar, such as the US Dollar Index, to assess the strength of the currency and its potential impact on silver prices.
5-Inflation expectations: Silver is often seen as a hedge against inflation, as its value can potentially increase as the purchasing power of money decreases. Therefore, changes in inflation expectations can affect silver prices. Traders should watch for data on inflation, such as the Consumer Price Index (CPI), to assess the likelihood of future price increases and their potential impact on silver.
6-Interest rates: Changes in interest rates can also affect silver prices, as higher interest rates can make it more expensive for traders to hold silver and other commodities. This can decrease demand for silver and put downward pressure on prices. Conversely, lower interest rates can make it cheaper to hold silver and increase demand, potentially pushing prices higher. Traders should watch for data on interest rates, such as the Federal Reserve's benchmark rate, to assess the impact on silver prices.

Bearish Candlesticks Pattern on SilverTVC:SILVER
Bearish Candlesticks identified on Daily timeframe of TVC:SILVER chart.

Silver (XAGUSD): Bearish Outlook Explained 🪙
Hey traders,
At the end of December, Silver reached a solid weekly structure resistance.
The market was nicely rejected from that.
Analyzing a daily time frame, I spotted a confirmed breakout of a support line of a rising wedge pattern.
It confirms the strength of the underlined zone.
I expect a bearish move to 22.84 / 22.2
❤️If you have any questions, please, ask me in the comment section.
Please, support my work with like, thank you!❤️

XAG/USD Silver is ready to massive run buy nowSilver both technical and fundamentally is undervalued
We are seen a nice continuation of structure to upside, price is re-tracing to test the support area.
very nice risk to reward and confluence with fib level 50%
Follow me for more break downs

Silver hit our target and ready for the next rally to $27.00 in 2022, Silver hit our target price of $24 this was due to a break up and out of a Triple Bottom (3 Rounding Bottoms).
Now we see a new Bullish Diamond formation on Silver.
We just need to wait for breakout
Target $27.00
Fundamentals:
Analysts predict that gold and silver will perform well in the new year as the Federal Reserve is expected to cut interest rates in the second half of 2023. This is due to the belief that a recession is imminent, which will reduce inflationary pressures and lead to falling interest rates. Chief North America economist Paul Ashworth of Capital Economics stated that despite the Fed's current hawkish stance, they still expect interest rates to decline by the end of 2023.

Basics : Silver Daily Timeframe TVC:SILVER
By applying #Dow theory, following observations are noted
Downtrend : From Mar22 till Aug22; almost 34% profit if short position is considered.
Uptrend : From Sep22 till date; almost 32% profit if long position is considered.

SILVER, Failed Breakout.Price was unable to keep the momentum pushing any higher instead we had a strong reversal which we had a nice pull back for a sell opportunity.
More bearish price action expected.
Thanks
Trade Safe

DeGRAM | Silver shortSilver dropped from the resistance and broke the lower border of the channel.
Price action pulled back to resistance and the trendline.
If the market fails to break through the resistance level , we can sell from the confluence level.
We anticipate a short-term pullback and breakout the channel.
-------------------
Share your opinion in the comments and support the idea with like. Thanks for your support!

HUGE multi-decade cup & handle pattern on Silver?I have to admit, the possibility is compelling. A 43-year pattern nearing completion and leading to a $600+ target. What do y'all think? Do you currently hold silver? Does this possibility make you more interested in holding some/more?
p.s. Had to reproduce this chart because the other one was taken down by Tradingview since I posted my company info on the chart. Absolute dumbest damn rule, especially when applied against the very people who pay them so much money every year. You pay them a ton of money and then are forced to promote your business how they say, which is far from optimal. Absolutely stupid and alienating. Thankfully there are MANY other competing platforms out there that understand they are just a tool in your business, so they don't attempt to control how you use their platform to promote your business. This allows us to utilize them in the most beneficial manner possible which increases the likelihood we will remain with them.

$XAG - Now we wait for the NFP!$XAG - Now we wait for the NFP!
Today we got NFP - exp 200k anywhere above is good number expect then silver to decline 22 handle. However if it's a miss expect silver to climb above towards 23/24 handle
A break to either direction!
Trade safe!
Trade Journal

SILVER (XAGUSD) Bearish Outlook🥈
Silver reached an important horizontal weekly structure.
The price formed a triple top on that on a daily time frame.
Its neckline breakout confirms a highly probable bearish continuation.
Goals: 22.6 / 22.2
❤️If you have any questions, please, ask me in the comment section.
Please, support my work with like, thank you!❤️

Silver could drop 2k pipsSince the low back in June 2022, Silver has traded in a range and although there were 4 attempts for a break under 18usd figure and even a false break at the beginning of September, bulls held strong and finally won the battle.
XagUsd started to rise in October and broke above the resistance of the 6 months range in November. A nice rise followed and the precious metal has gained more than 6k pips in 3 months if we count from the bottom to the top.
However, at this point, Silver looks like it wants to correct and the first and the second trading days of the year are Pin Bars.
The ascending trendline is also broken to the downside and these could be signs of an imminent drop.
My strategy is to sell rallies against 22.80 with a target at the 22 zone. Also, a deeper correction could drive the price even at 21 important support.
