MarketBreakdown | EURUSD, Bitcoin, Silver, AUDNZD
Hey traders,
here is a brief technical outlook of 4 peculiar instruments on my watch list.
1️⃣ EURUSD - Daily time frame 🇪🇺🇺🇸
Yesterday the price broke the last higher low level to the downside setting a lower low.
It is a very strong bearish clue and now the pair may drop lower.
Directional bias is bearish now.
2️⃣ Bitcoin (BTCUSD) - 3 days time frame
After a confirmed bullish breakout of a major supply cluster,
Bitcoin is consolidating.
The market is trading within a narrow horizontal trading range.
I believe that soon a strong bullish rally will initiate.
3️⃣ Silver (XAGUSD) - Weekly time frame 🪙
After a bullish breakout of a major falling trend line,
the price is approaching that again.
Wait for one more test of that trend line and wait for a confirmation to buy.
4️⃣ AUDNZD - Monthly time frame 🇦🇺 🇳🇿
The market is approaching a major monthly falling trend line.
I will expect a correctional movement from that.
Wait for confirmation on lower time frames to short.
❤️Please, support this idea with a like and comment!❤️
Silveranalysis

Silver/EUR Long Setupnice falling wedge setup after breaking out from bigger pennant, Signaling a continuation break out. Looking for price to get tight above capitulation wick into a a final squeeze then breakout. Could be a trade to push since the the target from initial breakout is much higher. Pattern to trigger bigger pattern.

SILVER | BUY ON SUPPORTSILVER - XAGUSD has been trading in decending traingle after making a high of 27. We are still bullish in the shining commodity. A long position can be taken here with calculated risk below the support level.
A break above the falling trendline will call for more agressive attack from bulls.
Trade your levels accordingly.

SILVER JUPITER/SATURN RELATIONSHIPS15 / 30 / 60 degrees relationship of Jupiter / Saturn cycle on SILVER Weekly chart.
Seems that it is bullish untill reaching a top around mid Jun 2023...

SILVER (XAGUSD) Price Action Analysis & Trading Plan 🥈
Price action analysis on Silver.
Daily time frame analysis.
Directional bias.
❤️Please, support this video with like and comment!❤️

Silver on the loop!Looks like silver gonna hit 26 again! my guess is it will continue channeling for the coming week!

XAGUSD SHORT 17TH MARCH 2022 ( SILVER )HELLO! Guys US30 is still playing out massively
So Silver has been very bullish in the past weeks and currently we can see supply pushing price into a bearish character from one of the weekly supply zones now currently we are looking for short positions for silver till the supply zone is broken.

SILVERXAGUSD has a great chart pattern to continue the bearish trend, with a great R/R of 1:5 . lets us consider further candle confirmations in 15 m and 1 hr time frames. #hotlist #watchlist

SILVER (XAGUSD) | The safest target to climb🎯Hello traders, Silver in daily timeframe , this analysis has been prepared in daily timeframe but has been published for a better view in 2 day timeframe.
The counting shows that in general a forward motion has been formed which may be for wave 1 or a and wave 2 or b, and now we have entered a new phase by breaking the channel related to the term.
This trend may be for wave 3 or c. However, we assume that these waves are related to wave-1, and that this wave 1 has completed its 1, 2, and 3 microwaves, and now that it is in the range of 26,500, it can be said that this prz range is a harmonic pattern. It has formed its 4th wave, this 4th wave is probably formed in the form of a zigzag and this zigzag breaks the black channel downwards and moves up to half of the blue channel and then prepares to form the 5th wave.
This analysis is just a possibility and has no validity.
🙏If you have an idea that helps me provide a better analysis, I will be happy to write in the comments🙏
❤️Please, support this idea with a like and comment!❤️

XAGUSD LONG - Buy Entry - D1 ChartXAGUSD LONG - Buy Entry - D1 Chart
Buy @ Market
Symbol: XAGUSD Silver
Timeframe: D1
Type: BUY
Entry Price: Buy @ Market
TP - Resistance @ 26.678
Resistance @ 25.539
PP Y1 - Pivot Point Yearly @ 24.9373
Support @ 24.581
✅ If you liked this analysis, please consider Following and giving it a Thumbs Up 👍
✅ If you have any feedback or questions, please leave a comment below as I answer each comment 💬
✅ Wishing you enjoyable successful trading 🙏


SILVER PUMP INCOMING?! TARGETS!Hey everyone
Today i show you my SILVER Weekly chart analysis and idea.
Silver broke out of the downtrend and currently is retesting the breakout. If this confirms with a weekly close i expect a big rise!
How much can SILVER go up?
- I think SILVER can go up to 30$ and after that even 35$
Can you trade this idea?
- Yes. I also longed SILVER during last days and you still can while this is retesting.
I hope you guys like this idea

$XAGUSD - Silver could drop to 24Hello everyone!
Silver is testing an important dynamic support. If closes below this support, will drop to 24.

Silver: Down, Boy!Silver is being a bit stubborn these days. After finishing wave (x) in blue at the lower edge of the orange zone between $27.39 and $28.66, it has generally been moving downwards. However, this movement has time and again been interspersed with upwards twitches, which have lately returned it to the mark at $25.49. Nevertheless, we still expect silver to continue its descent and to head for the support at $21.41 in the long run.

SILVER (XAGUSD) Price Action Analysis & Trading Plan 🥈
Structure and price action analysis on Silver.
Potential buy zone explained.
Trading recommendations given.
❤️Please, support this idea with like and comment!❤️

long SILVERSimilar pattern to the analysis just drafted on GOLD, applies to SILVER, where we have seen chart patterns being highly correlated to xau movements, combined to a significant increase of physical delivery between the major players.
We will play on silver with same logic: very tight stop, in correspondence of today lows and TP level at 28. SL will be moved higher to protect profits.
We will obviously take in consideration FED pressconference, if the trade is still open, to manage the risk during news time.

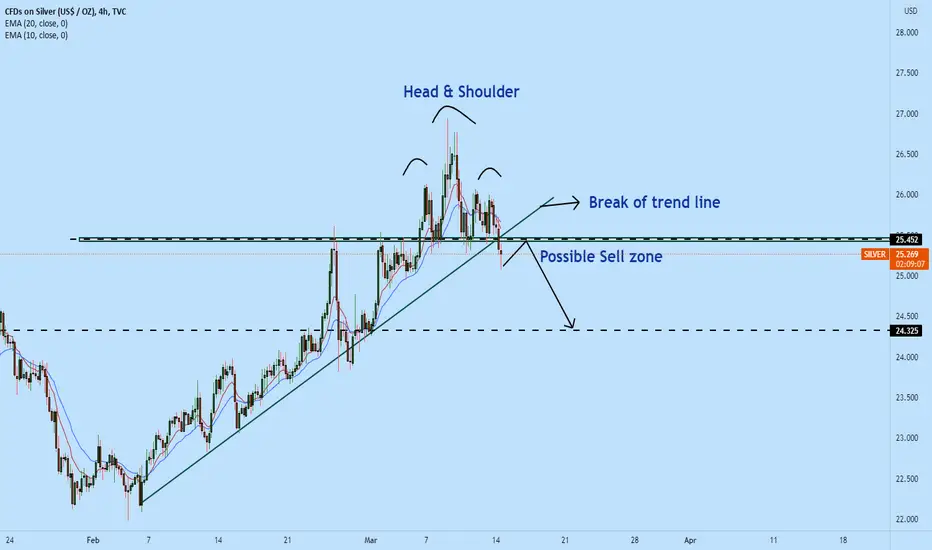
Silver has broken local trend lineSilver has broken the short-term trend line and is likely to drop as it is highly likely that this instrument will retest the weekly support before making any move to the upside.
Currently, 25.45 could give us a selling opportunity with a target @24.32
If you find value in this analysis give a thumbs up and also share it with friends.
Are we being fooled? Silver too WTF!After finding Wyckoff reaccumulation zones on Ethereum AND Bitcoin. Now I see it on silver too. Please leave me your thoughts and feedback.

SILVER ShortHey traders, in today's trading session we are monitoring Silver for a selling opportunity around 26 zone, once we will receive any bearish confirmation the trade will be executed.
Trade safe, Joe.

TRADE OF THE WEEK | Classic Trend Line Breakout Trade💰
Hey traders,
For a quite long period of time, Silver was nicely respecting a major falling trend line on a daily.
The price perfectly set lowers highs approaching that.
The war brought anxiety into the market making the investors rebalance their portfolios.
It triggered a strong bullish reaction and the market violated the trend line to the upside.
On a retest, I was looking for buying opportunities.
My confirmation was a double bottom formation on intraday time frames.
I bought the market on a retest of a broken neckline.
My target was a local structure high.
Great winner and nice profit!
❤️Please, support this idea with like and comment!❤️

Silver High R:R (scale in orders)A high R:R setup, scaling orders when it reaches high of consolidation to get max R:R.

SILVER (XAGUSD) | The safest target to climb🎯Hello traders, Silver in daily timeframe , this analysis has been prepared in daily timeframe but has been published for a better view in 2 day timeframe.
In the count we had at higher times, we came to the conclusion that we will have an upward trend.
This trend may be for wave 3 from the lead or for wave c from the correction.
At this time, a wave has formed in a leading form, which we have labeled as the main wave 1, and now we doubt the beginning of wave 3 or still in the correction process for wave 2.
For this purpose, we considered several ranges, the first range is the breaking of the canal roof, which is a confirmation of the beginning of wave 3 and the uptrend.
The next price range will be 21000, which is a downtrend if this range is completely broken.
The channel ceiling is broken upwards and this wave is probably related to wave 1 of iii and in the next stage wave 2 starts and this wave completes after the pullback to the broken channel.
🙏If you have an idea that helps me provide a better analysis, I will be happy to write in the comments🙏
❤️Please, support this idea with a like and comment!❤️

SILVERThis area is really important for silver. there is double bottom and the channel show show us target. before that probably it will have a another correction to get power for break out.
