SILVER (XAGUSD) - Weekly Technical Analysis UpdateMidterm forecast:
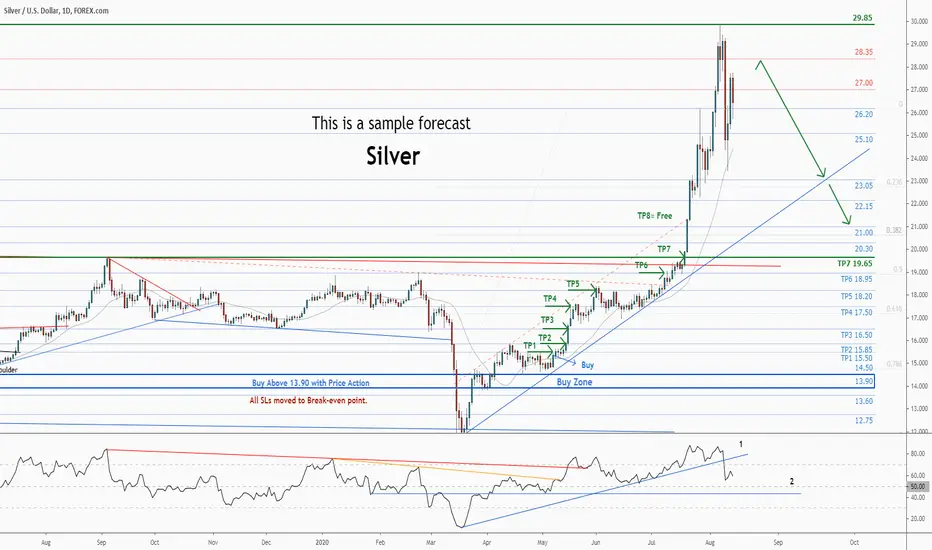
. While the price is below the resistance 29.85, beginning of downtrend is expected.
. We make sure when the support at 19.65 breaks.
. If the resistance at 29.85 is broken, the short-term forecast -beginning of downtrend- will be invalid.
T echnical analysis:
. The RSI uptrend #1 is broken, so the probability of beginning of downtrend is increased.
. While the RSI support #2 at 45 is not broken, the probability of price decrease would be too low.
. A trough is formed in daily chart at 26.00 on 08/21/2020, so more gains to resistance(s) 28.35 and maximum to Major Resistance (29.85) is expected.
. Price is above WEMA21, if price drops more, this line can act as dynamic support against more losses.
. Relative strength index (RSI) is 60.
❤️ If you find this helpful and want more FREE forecasts in TradingView
. . . . . Please show your support back,
. . . . . . . . Hit the 👍 LIKE button,
. . . . . . . . . . Drop some feedback below in the comment!
❤️ Your Support is very much 🙏 appreciated! ❤️
💎 Want us to help you become a better Forex trader ?
Now, It's your turn !
Be sure to leave a comment let us know how do you see this opportunity and forecast.
Trade well, ❤️
ForecastCity English Support Team ❤️
Silverdollar

SILVER (XAGUSD) - Weekly Technical Analysis UpdateMidterm forecast:
. While the price is below the resistance 29.85, beginning of downtrend is expected.
. We make sure when the support at 19.65 breaks.
. If the resistance at 29.85 is broken, the short-term forecast -beginning of downtrend- will be invalid.
T echnical analysis:
. The RSI uptrend #1 is broken, so the probability of beginning of downtrend is increased.
. While the RSI support #2 at 45 is not broken, the probability of price decrease would be too low.
. A trough is formed in daily chart at 26.00 on 08/21/2020, so more gains to resistance(s) 28.35 and maximum to Major Resistance (29.85) is expected.
. Price is above WEMA21, if price drops more, this line can act as dynamic support against more losses.
. Relative strength index (RSI) is 60.
❤️ If you find this helpful and want more FREE forecasts in TradingView
. . . . . Please show your support back,
. . . . . . . . Hit the 👍 LIKE button,
. . . . . . . . . . Drop some feedback below in the comment!
❤️ Your Support is very much 🙏 appreciated! ❤️
💎 Want us to help you become a better Forex trader ?
Now, It's your turn !
Be sure to leave a comment let us know how do you see this opportunity and forecast.
Trade well, ❤️
ForecastCity English Support Team ❤️

SILVER is ready for another BIG BULLISH TRIANGLE breakout!SILVER is ready for another BIG BULLISH TRIANGLE breakout!
That's a big bullish triangle, let's smoke some hopium and pray it breaks up! 65% Chance it breaks up, 35% chance it breaks down.
Trade safe my friends...
TVC:SILVER

SILVER Weekly Technical Analysis UpdateMidterm forecast:
While the price is below the resistance 29.85, beginning of downtrend is expected.
We make sure when the support at 19.65 breaks.
If the resistance at 29.85 is broken, the short-term forecast -beginning of downtrend- will be invalid.
Technical analysis:
The RSI uptrend #1 is broken, so the probability of beginning of downtrend is increased.
While the RSI support #2 at 45 is not broken, the probability of price decrease would be too low.
A trough is formed in daily chart at 23.39 on 08/11/2020, so more gains to resistance(s) 27.00, 28.35 and maximum to Major Resistance (29.85) is expected.
Price is above WEMA21, if price drops more, this line can act as dynamic support against more losses.
Relative strength index (RSI) is 59.
❤️ If you find this helpful and want more FREE forecasts in TradingView
. . . . . Please show your support back,
. . . . . . . . Hit the 👍 LIKE button,
. . . . . . . . . . . Drop some feedback below in the comment!
❤️ Your Support is very much 🙏 appreciated!❤️
💎 Want us to help you become a better Forex trader?
Now, It's your turn!
Be sure to leave a comment let us know how do you see this opportunity and forecast.
Trade well, ❤️
ForecastCity English Support Team ❤️

Why was silver going up again?The 1980 bullrun wasn't the same as the 2011 bullrun. Because Fiat decreased in value. The current bullrun isn't the same as 2011 and certainly not 1980. What I do say is new high in real value. Which means we have a long long way to go. Everything below 3 digits is cheap.
Search for value not fiat. Stocks are crashing for years already.

SILVER Weekly Technical Analysis UpdateMidterm forecast:
18.95 is a major support, while this level is not broken, the Midterm wave will be uptrend.
We will close our open trades, if the Midterm level 18.95 is broken.
Technical analysis:
While the RSI uptrend #1 is not broken, bullish wave in price would continue.
A trough is formed in daily chart at 17.35 on 06/24/2020, so more gains to resistance(s) 25.10, 26.20, 27.00 and more heights is expected.
Price is above WEMA21, if price drops more, this line can act as dynamic support against more losses.
Relative strength index (RSI) is 77.
❤️ If you find this helpful and want more FREE forecasts in TradingView
. . . . . Please show your support back,
. . . . . . . . Hit the 👍 LIKE button,
. . . . . . . . . . Drop some feedback below in the comment!
❤️ Your Support is very much 🙏 appreciated! ❤️
💎 Want us to help you become a better Forex trader ?
Now, It's your turn !
Be sure to leave a comment let us know how do you see this opportunity and forecast.
Trade well, ❤️
ForecastCity English Support Team ❤️

SILVER Potential 10% Short term !Hello fellow traders!
As you can see today we have a current opportunity in our prospects. However we patiently wait with our orders untill it will be filled at the right time in order to catch the breakout!
Right now gold/silver ratio is decreasing also creating momentum on the silver side.
Let me know if you have any ideas or like the contont, it would be highly appreciated

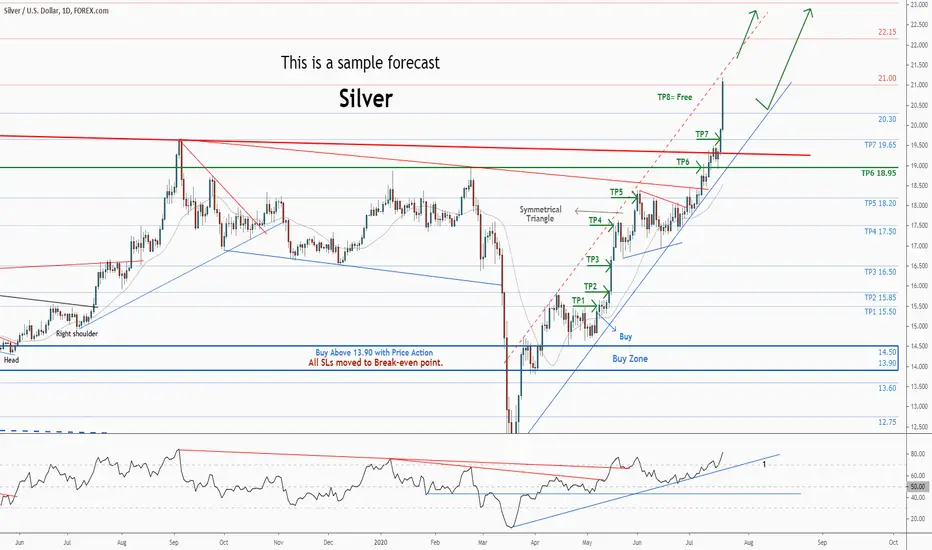
SILVER Technical Analysis UpdateMidterm forecast:
. 18.95 is a major support, while this level is not broken, the Midterm wave will be uptrend.
. We will close our open trades, if the Midterm level 18.95 is broken.
Technical analysis:
. While the RSI uptrend #1 is not broken, bullish wave in price would continue.
. A trough is formed in daily chart at 17.35 on 06/24/2020, so more gains to resistance(s) 22.15, 23.05, 25.10 and more heights is expected.
. Price is above WEMA21, if price drops more, this line can act as dynamic support against more losses.
. Relative strength index (RSI) is 83.
❤️ If you find this helpful and want more FREE forecasts in TradingView
. . . . . Please show your support back,
. . . . . . . . Hit the 👍 LIKE button,
. . . . . . . . . . Drop some feedback below in the comment!
❤️ Your Support is very much 🙏 appreciated! ❤️
💎 Want us to help you become a better Forex trader ?
Now, It's your turn !
Be sure to leave a comment let us know how do you see this opportunity and forecast.
Trade well, ❤️
ForecastCity English Support Team ❤️
SILVER Technical Analysis UpdateMidterm forecast:
18.95 is a major support, while this level is not broken, the Midterm wave will be uptrend.
We will close our open trades, if the Midterm level 18.95 is broken.
Technical analysis:
While the RSI uptrend #1 is not broken, bullish wave in price would continue.
A trough is formed in daily chart at 17.35 on 06/24/2020, so more gains to resistance(s) 22.15, 23.05, 25.10 and more heights is expected.
Price is above WEMA21, if price drops more, this line can act as dynamic support against more losses.
Relative strength index (RSI) is 83.
❤️ If you find this helpful and want more FREE forecasts in TradingView
. . . . . Please show your support back,
. . . . . . . . Hit the 👍 LIKE button,
. . . . . . . . . . Drop some feedback below in the comment!
❤️ Your Support is very much 🙏 appreciated! ❤️
💎 Want us to help you become a better Forex trader ?
Now, It's your turn !
Be sure to leave a comment let us know how do you see this opportunity and forecast.
Trade well, ❤️
ForecastCity English Support Team ❤️

SILVER Weekly Technical Analysis UpdateMidterm forecast:
. While the price is above the support 16.50, resumption of uptrend is expected.
. We make sure when the resistance at 18.95 breaks.
. If the support at 16.50 is broken, the short-term forecast -resumption of uptrend- will be invalid.
. We will close our open trades, if the Midterm level 16.50 is broken.
Technical analysis:
. While the RSI support #1 at 45 is not broken, the probability of price decrease would be too low.
. A trough is formed in daily chart at 17.35 on 06/24/2020, so more gains maximum to Major Resistance (18.95) is expected.
. Price is above WEMA21, if price drops more, this line can act as dynamic support against more losses.
. Relative strength index ( RSI ) is 67.

SILVER Weekly Technical Analysis UpdateMidterm forecast:
. While the price is above the support 16.50, resumption of uptrend is expected.
. We make sure when the resistance at 18.95 breaks.
. If the support at 16.50 is broken, the short-term forecast -resumption of uptrend- will be invalid.
. We will close our open trades, if the Midterm level 16.50 is broken.
Technical analysis:
. While the RSI support #1 at 45 is not broken, the probability of price decrease would be too low.
. A trough is formed in daily chart at 17.35 on 06/24/2020, so more gains maximum to Major Resistance (18.95) is expected.
. Price is above WEMA21, if price drops more, this line can act as dynamic support against more losses.
. Relative strength index (RSI) is 67.


A Second Chance to Buy in XAGUSD …New trading suggestion:
* The price is in a range bound and we forecast the uptrend would resume.
* There is still a possibility of temporary retracement to suggested support line (16.50). if so, traders can set orders based on Price Action and expect to reach short-term targets.
* If you missed our first HUNT, you have a second chance to buy above the suggested support line (16.50).
Midterm forecast:
. While the price is above the support 16.50, resumption of uptrend is expected.
. We make sure when the resistance at 18.35 breaks.
. If the support at 16.50 is broken, the short-term forecast -resumption of uptrend- will be invalid.
. We will close our open trades, if the Midterm level 16.50 is broken.
Technical analysis:
. The symmetrical triangle taking shape and as a continuation pattern suggests we will soon see another leg higher if price breaks and closes above the downtrend line of the triangle.
. While the RSI support #1 at 45 is not broken, the probability of price decrease would be too low.
. A peak is formed in daily chart at 18.35 on 06/01/2020, so more losses to support(s) 17.50, 16.50 and minimum to Major Support (16.50) is expected.
. Price is above WEMA21, if price drops more, this line can act as dynamic support against more losses.
. Relative strength index ( RSI ) is 58.

A Second Chance to Buy in XAGUSD ...New trading suggestion:
* The price is in a range bound and we forecast the uptrend would resume.
* There is still a possibility of temporary retracement to suggested support line (16.50). if so, traders can set orders based on Price Action and expect to reach short-term targets.
* If you missed our first HUNT, you have a second chance to buy above the suggested support line (16.50).
Midterm forecast:
. While the price is above the support 16.50, resumption of uptrend is expected.
. We make sure when the resistance at 18.35 breaks.
. If the support at 16.50 is broken, the short-term forecast -resumption of uptrend- will be invalid.
. We will close our open trades, if the Midterm level 16.50 is broken.
Technical analysis:
. The symmetrical triangle taking shape and as a continuation pattern suggests we will soon see another leg higher if price breaks and closes above the downtrend line of the triangle.
. While the RSI support #1 at 45 is not broken, the probability of price decrease would be too low.
. A peak is formed in daily chart at 18.35 on 06/01/2020, so more losses to support(s) 17.50, 16.50 and minimum to Major Support (16.50) is expected.
. Price is above WEMA21, if price drops more, this line can act as dynamic support against more losses.
. Relative strength index ( RSI ) is 58.

A second Chance to Buy in XAGUSD...New trading suggestion:
* The price is in a range bound and we forecast the uptrend would resume.
* There is still a possibility of temporary retracement to suggested support line (15.85). if so, traders can set orders based on Price Action and expect to reach short-term targets.
* If you missed our first HUNT, you have a second chance to buy above the suggested support line (15.85).
Midterm forecast:
. While the price is above the support 15.85, resumption of uptrend is expected.
. We make sure when the resistance at 18.35 breaks.
. If the support at 15.85 is broken, the short-term forecast -resumption of uptrend- will be invalid.
. We will close our open trades, if the Midterm level 15.85 is broken.
Technical analysis:
. The symmetrical triangle taking shape and as a continuation pattern suggests we will soon see another leg higher if price breaks and closes above the downtrend line of the triangle.
. While the RSI support #1 at 45 is not broken, the probability of price decrease would be too low.
. A peak is formed in daily chart at 18.35 on 06/01/2020, so more losses to support(s) 17.50, 16.50 and minimum to Major Support (15.85) is expected.
. Price is above WEMA21, if price drops more, this line can act as dynamic support against more losses.
. Relative strength index (RSI) is 57.

Don't miss the great buy opportunity in XAGUSDTrading suggestion:
. There is a possibility of temporary retracement to suggested support line (17.87). if so, traders can set orders based on Price Action and expect to reach short-term targets.
Technical analysis:
. SILVER/U.S. DOLLAR is in a range bound and the resumption of uptrend is expected.
.The price is above the 21-Day WEMA which acts as a dynamic support.
. The RSI is at 59.
Take Profits:
TP1= @ 18.33
TP2= @ 18.73
TP3= @ 19.65
SL= Break below S2

XAGUSD | Fake BreakoutPlease support this idea with LIKE if you find it useful.
Reason for a Short Position: Price made a breakout of the Channel, but was rejected by R1. That signal's the price won't fix above resistance level.
Thank you for reading this idea! Hope it's been useful to you and some of us will turn it into profitable.
Remember this analysis is not 100% accurate. No single analysis is. To make a decision follow your own thoughts.
The information given is not a Financial Advice.

XAGUSD | Supported on Strong HorizontalPlease support this idea with LIKE if you find it useful.
Initiate Long.
Entry - 18.073
TP - 19.450
SL - 17.701
Reason: The price was supported on strong horizontal zone. RSI have a space for this trade.
Thank you for reading this idea! Hope it's been useful to you and some of us will turn it into profitable.
Remember this analysis is not 100% accurate. No single analysis is. To make a decision follow your own thoughts.
The information given is not a Financial Advise.


A second Chance to Buy in SilverMidterm forecast:
16.55 is a major support, while this level is not broken, the Midterm wave will be uptrend.
Technical analysis:
While the RSI support #1 at 48 is not broken, the probability of price decrease would be too low.
A trough is formed in daily chart at 15.95 on 08/01/2019, so more gains to resistance(s) 17.20, 18.10 and more heights is expected.
Price is above WEMA21, if price drops more, this line can act as dynamic support against more losses.
Relative strength index (RSI) is 69.
New trading suggestion:
*There is still a possibility of temporary retracement to suggested support line (16.55). if so, traders can set orders based on Price Action and expect to reach short-term targets.
* If you missed our first HUNT , you have a second chance to buy above the suggested support line (16.55).
Entry signal:
Signal to enter the market occurs when the price comes to " Buy zone " then forms one of the reversal patterns, whether " Bullish Engulfing ", " Hammer " or " Valley " in other words, NO entry signal when the price comes to the zone BUT after any of reversal patterns is formed in the zone. To learn more about " Entry signal " and the special version of our " Price Action " strategy FOLLOW our lessons :
Trade Setup:
We opened 6 BUY trade(s) @ 15.21 based on 'Valley' entry method at 2019.07.10.
Total Profit: 686 pip
Closed trade(s): 342 pip Profit
Open trade(s): 344 pip Profit
Closed Profit:
TP1 @ 15.30 touched at 2019.07.11 with 8 pip Profit.
TP2 @ 15.60 touched at 2019.07.16 with 38 pip Profit.
TP3 @ 16.20 touched at 2019.07.18 with 98 pip Profit.
TP4 @ 17.20 touched at 2019.08.07 with 198 pip Profit.
8 + 38 + 98 + 198 = 342 pip
Open Profit:
Profit for one trade is 16.94(current price) - 15.21(open price) = 172 pip
2 trade(s) still open, therefore total profit for open trade(s) is 172 x 2 = 344 pip
All SLs moved to Break-even point.
Take Profits:
TP5= @ 18.10
TP6= Free
