Waiting for SilverIf you like this idea, don't forget to support it clicking the Like Button!
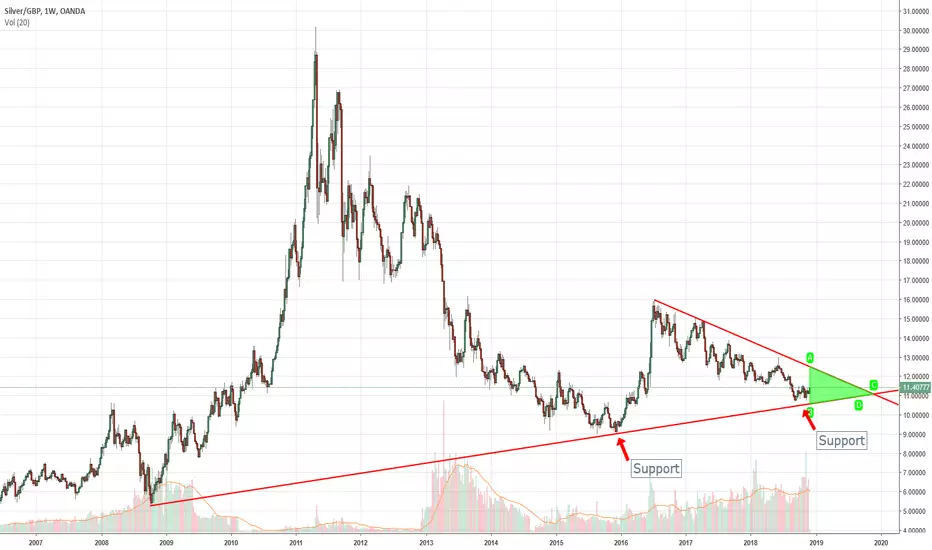
Hi guys. This idea is a long term analysis of the Silver bullish trend (probably bullish).
My tactic for silver is to wait until the point (C) is reached and to expect for candle confirmation of bullish trend continuation.
If you are looking for a short-term trade on Elliott corrective waves, I suggest you look to the related copper idea.
Disclosure: My ideas contain statements and projections based on assumptions on capital markets, and therefore inherently subject to numerous risks and uncertainties.
Before buying or selling any stock you should do your own research and reach your own conclusion or consult a financial advisor. Investing includes risks, including loss of principal.
I am not a financial advisor.
Silverforecast

Trade idea for XAGUSD SILVER, The major run is getting preparedXAGUSD broke the trendline, retested it and continuing for a rally
its a long term hold
Also it has retested the weekly 200ema so beautifully
I have put the aggressive stoploss you can adjust it according to previous swing low according to you

LONG Don't miss the great buy opportunity in XAGUSDTrading suggestion:
. There is a possibility of temporary retracement to suggested support line (17.44). if so, traders can set orders based on Price Action and expect to reach short-term targets.
Technical analysis:
. XAGUSD is in a range bound and the beginning of uptrend is expected.
.The price is above the 21-Day WEMA which acts as a dynamic support.
. The RSI is at 70.
Take Profits:
TP1= @ 18.16
TP2= @ 18.70
TP3= @ 19.629
SL= Break below S2

Don't miss the great buy opportunity in XAGUSDTrading suggestion:
. There is a possibility of temporary retracement to suggested support line (17.44). if so, traders can set orders based on Price Action and expect to reach short-term targets.
Technical analysis:
. XAGUSD is in a range bound and the beginning of uptrend is expected.
.The price is above the 21-Day WEMA which acts as a dynamic support.
. The RSI is at 70.
Take Profits:
TP1= @ 18.16
TP2= @ 18.70
TP3= @ 19.629
SL= Break below S2

SILVER long term bullish trend confirmedLong term multi month breakout confirmed, we broke above the green line with a healthy retest. It is now confirmed as support. Likewise the 200 EMA on the monthly basis is holding each time it was tested since 2015. Resistance was at $17.40 on a monthly basis and that has been eclipsed. $22 is my target for 2020. Look for Silver to outperform Gold in Jan and Feb 2020. The weekly time frame is likewise very bullish

Silver Prediction for Spring 2020My prediction for silver is a rally which will last until Spring 2020 where it will hit the early $20's/oz. This is based on the pretty perfect technical breakout we saw a month back, which has now back tested and is preparing for the next leg higher. This is all happened while the gold/silver ratio is weakening quite dramatically relative to gold.

XAGUSD: Price Approaching Critical Zone. Watch for ReversalHi Traders,
Silver has yielded a textbook double-three expanding flat. The key fibonacci levels for wave X (1.05 - 1.38) have been respected and I'm therefore expecting price to reverse from within the golden zone (0.50 - 0.618). The golden zone in this case will be the zone where wave B retraces wave A. As such such, what we're looking to trade is wave C and the target is within the blue box between 15.60 and 14.93.
Regards
Wave Theorist


Don't miss the great buy opportunity in XAGUSDTrading suggestion:
. There is a possibility of temporary retracement to suggested support line (17.80). if so, traders can set orders based on Price Action and expect to reach short-term targets.
Technical analysis:
. XAGUSD is in a range bound and the beginning of uptrend is expected.
.The price is above the 21-Day WEMA which acts as a dynamic support.
. The RSI is at 62.
Take Profits:
TP1= @ 18.32
TP2= @ 18.72
TP3= @ 19.63
SL= Break below S2

Silver Breaks A Daily Downtrend Line And Ascending TriangleSilver prices recently broke out of a daily ascending triangle as well as a downtrend line. I believe that as long as Silver stays above the lower
trend line in the ascending triangle, it could move higher.

Silver Losing Momentum In silver, we had a strong move upwards from the $17/oz range to a high of roughly $19.755/oz. Recently, however, the price has failed to maintain momentum to regain those highs and has steadily pushed lower in an evident regression trend on the daily chart from 05 Sep 2019 to the present. I believe that silver will retest the $17/oz range, and from there, we will have a stronger confirmation on the short term direction of silver's price. As well the gold to silver ratio rebounded from a yearly low of roughly 1XAU:79.38XAG to currently 1XAU:84.89XAG. In the meantime, I believe silver to be a short trade. However, in the long run, silver seems to be bullish as the gold to silver ratio is at historical peak levels.

$21 / oz silver by mid year 2020This is a real possibility now that the downtrend for the last month or so is about to break. We are also seeing great weakness in the gold/silver ratio which means we should see silver outperform gold in the coming months. Therefore $21/oz is possible should the gold/silver ratio drop to around 70-77 depending on the price of gold. Watch the breakout.

Silver SLV XAG - Silver's up! Buy the dip. Buy physical silver!Silver looking good. Gold looking good. Bitcoin looking good. Litecoin looking good. I'm bullish on all of them.
I'd be stocking up on all of these, and get the real thing. Get the physical metal that you can hold in your possession. For cryptocurrency make sure you have your private keys.

SLV XAG Silver - Stop loss update, long the dipI'm playing silver in a bullish macro trend, so I'm still long. However we could see a significant pullback, shaking out weak hands and traders before a higher high. Short traders could be right depending on the degree of retracement.
However I'm not looking to short. I'm looking to long the pullback.

Is SILVER run over? It appears that we are still in a massive bear channel and this was a bear market rally. Both TVC:GOLD and TVC:SILVER appear to be overbought. Silver is showing a massive weekly shooting star. Might see another leg up (within the channel)but then a decline to find another bottom. Looks like it got all the FOMOs out there. Unless we break out of this bear channel staying bearish.


Silver long term bullishOANDA:XAGUSD
Chart is self explanatory. Great setup with massive potential. Leave your thoughts below.

Silver in British Pounds has a major turning point ahead!Hard-Brexit and the upper trendline will be broken.
Soft-Brexit and the lower trendline will be hit again but due to strong support at this level I feel it is unlikely to be broken.
A second Chance to Buy in SilverMidterm forecast:
15.60 is a major support, while this level is not broken, the Midterm wave will be uptrend.
Technical analysis:
The RSI bounced from the support #1 at 48 and it prevented price from more losses.
A trough is formed in daily chart at 14.89 on 07/05/2019, so more gains to resistance(s) 16.20, 17.20, 18.10 and more heights is expected.
Price is above WEMA21, if price drops more, this line can act as dynamic support against more losses.
Relative strength index (RSI) is 73.
New trading suggestion:
*There is still a possibility of temporary retracement to suggested support line (15.60). if so, traders can set orders based on Price Action and expect to reach short-term targets.
* If you missed our first HUNT , you have a second chance to buy above the suggested support line (15.60).
Entry signal:
Signal to enter the market occurs when the price comes to " Buy zone " then forms one of the reversal patterns, whether " Bullish Engulfing ", " Hammer " or " Valley " in other words, NO entry signal when the price comes to the zone BUT after any of reversal patterns is formed in the zone. To learn more about " Entry signal " and the special version of our " Price Action " strategy FOLLOW our lessons :
Trade Setup:
We opened 6 BUY trade(s) @ 15.21 based on 'Valley' entry method at 2019.07.10.
Total Profit: 438 pip
Closed trade(s): 144 pip Profit
Open trade(s): 294 pip Profit
Closed Profit:
TP1 @ 15.30 touched at 2019.07.11 with 8 pip Profit.
TP2 @ 15.60 touched at 2019.07.16 with 38 pip Profit.
TP3 @ 16.20 touched at 2019.07.18 with 98 pip Profit.
8 + 38 + 98 = 144 pip
Open Profit:
Profit for one trade is 16.20(current price) - 15.21(open price) = 98 pip
3 trade(s) still open, therefore total profit for open trade(s) is 98 x 3 = 294 pip
All SLs moved to Break-even point.
Take Profits:
TP4= @ 17.20
TP5= @ 18.10
TP6= Free
