SILVER Volatility Forecast 7-11 November 2022 SILVER Volatility Forecast 7-11 November 2022
We can see that this week our volatility is at 4.08% which declined from 4.55% last week.
Currently according to ATR we are on 26th percentile, and according to SILVER IV we are on 42th percentile, indicating in both cases, that we are currently is stable market.
Now, based on the implied volatility data that we have for this week, lets look into further details.
We can see that currently there is 32.3% chance, that our candle is going to close at the end of the week either above/below the next channel
TOP: 21.8
BOT: 19.9
This can also be translated as a 67.7% chance that the market is going to move within this established range.
At the same, looking at the previous high/low values of the candle, and taking into account the entire history available of data, we can expect that there is going to be a
70% chance that we are going to touch the previous high of 20.9
30% chance that we are going to touch the previous low of 18.8
Silverforecast

SilverBlue line where ill buy
I think a little bounce again to red line
Its showing strength
19 is a good buy to me
GOOD LUCK

20 REASON FOR BUY SILVER 1 Structure analysis time frame DAILY
2 target time frame :DAILY
3 Current Move :IMPULSE
4 Entry Time Frame : H4
4.1 Entry TF Structure: BULLISH
4.2 entry move : CORRECTIVE
5 Suppot resistence base :H4 FAIR VALUE GAP
6 FIB: DISCIUNTED AREA FILLED
7 candle Pattern: PANIC BOTTOM
8 Chart Pattern: LOWER HIGH
9 Volume : AVERAGE
10 Momentum UNCONVENTIONAL Rsi: SIDEWAYS
11 Volatility measure bollinger bands: LOWER BAND FAKE BREAKOUT BULLISH
12 strength ADX: SIDWWAYS
13 Sentiment ROC: BULLISH
14 final comment : LONG
15 : decision : BUY
16 Entry: 19.178
17 Stop losel: 18.968
18 Take profit: 20.950
19 Risk to reward Ratio: 1:10
Excepted Duration : 5 DAYS

Silver weekly update Its clear that silver firming lower high……… lower low
Is coming next week
Not only that , previously showed my followers in the hourly firming triple top pattern that will take us to 19.2
Now my target is 18.2 in next week
That can also depend on the daily update
Keep on touch
GOOD LUCK

Silver analysis: How far the bear market rally might go?Silver is in the midst of a bear market rally, up 8% in the last two weeks and 13% since the end-of-August lows.
Although silver prices are still 23% below the peak reached in March, recent price movements suggest that silver is attempting to make a trend reversal at these levels.
Slowing market pricing for Fed interest rates next year has prompted the rally in silver prices over the past weeks. Investors reduced their forecasts for interest rates in the second half of 2023, and in the last week they priced in a first drop of 25 basis points after Fed funds are expected to reach a high of 4.9% in the first quarter of 2023.
An asset like silver that is extremely vulnerable to US interest rates has been granted some breathing room by both the decrease in Treasury yields – the US 10y yield has dropped by 30 basis points in the past week – and the weakening of the US dollar – with the DXY index falling below 110. Silver has been strongly and inversely correlated with the US dollar performance throughout the year.
The Federal Reserve meeting next week poses a concern because it could reignite hawkish arguments about the need to curb inflationary increases, which might halt the silver's rally. However, understanding how likely the Fed views a recession in 2023 will be critical, given the market builds many of its expectations for the conclusion of the hiking cycle next year on this matter.
A new attempt to break the 23.6% Fibonacci retracement level (2022 max-min range) can be seen on the daily silver technical chart. Sellers fought back hard at this level in September, pushing prices below the $19.7–20 zone. This level was breached in early October, causing prices to rise to $21.1-21.2 (38.2% Fibonacci).
Momentum indicators indicate that bullishness is gaining traction. The 14-day RSI surpassed 50 days once more, and the MACD indicates a bullish crossover close to the zero line.
If silver is successful in breaking over $19.8, a new overshoot toward $21.1 or $21.6 (200-day moving average) is possible. At that point, sellers might resume offering fierce pushback. Next Wednesday, a very hawkish Federal Reserve could return to exert downward pressure, leading to a retest of the 18.2 support level.
Idea written by Piero Cingari, forex and commodity analyst at Capital.com

░🔮░SILVER FORECAST | 1W ░🔮░COMEX:SI1!
Eve is out sick right now (I temporarily broke her during an update). So I am posting solo no Eve, no Gordon.
I placed layed this forecast out in May when I posted this 30 day forecast. That played out here:
So far this one is looking good and very accurate.
What do you think? Will this forecast play out? Will we see (around) double the price in Oct 2023?

Silver view Silver will go down sooner or later (Fact)
First , dollar still not finished it run .
Second , false candle in monthly , weekly ,daily (mentioned above )
Third , raising rate and rightening .
Forth , chart pattern shows we must retrace the same percentage of consolidation
Any ways if we dont cross 21 $ dollars we will come back easily to 18 $
Thats my over all view
GOOG LUCK

Silver Has Not Bottomed YetThere is a probability silver might test the green box. Thats below 17. There I can be sure XagUsd has bottomed. Overall I’m bullish silver. It will be $90-$100 in 2020s.

Silver Next week So bad week for silver
We may see lower prices
Moving averages about to cross and print down word movement
Selling in next week is profitable
Be careful any pull back is to sell not to buy
Ill update you next week
GOOD LUCK

Silver: TightIt’s getting tight! Silver hasn’t all that much room left to finish wave 4 in green… We expect it to make it in time, though, and to go for the resistance at $20.87 afterwards. Once above this mark, silver should push off into the orange zone between $22.11 and $23.72 to complete wave 5 in green as well as wave iii in orange, before starting a countermovement. However, there is a 45% chance that silver could fail to get its act together early enough and could thus drop below the support at $18.96, which would then trigger further descent below the next marks at $17.89 and $17.40.

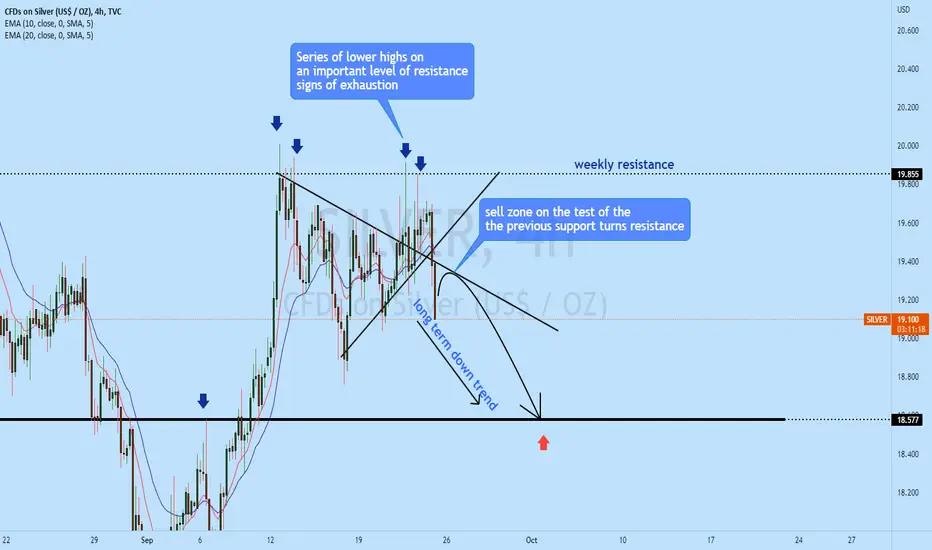
SILVER possible sell zone!!SILVER 4h has been rejected from the weekly resistance creating a series of lower highs with multiple rejections. As the long-term trend is down, GOLD silver has broken out of the local structure and the highly likely price will continue to drop. On the retest of the previous support as resistance, as sell trade is high probable.
Press the like button if you enjoy this content :)
Silver: Keep the Pot Boiling 🫕Quite peppily, silver has vaulted upwards, only to stop short in front of its next destination. Now, it should keep the pot boiling and take up speed anew to make it into the upper green zone between $20.12 and $20.70, where it should finish wave 3 in green. After a short counter movement into the lower green zone between $19.56 and $18.93, silver should continue to climb northwards. There is a 40% chance, though, that silver might need a break and could drop below the support at $17.40. In that case, it should take a detour through the magenta colored zone between $17.23 and $14.14 first before rising effectively.

Silver | Price Is Close To a Breaking PointSilver | Price Is Close To a Breaking Point
After the price tested a strong support area close to 17.5 we can
see it rising again.
Actually, the price is within a very large corrective pattern and now it is
close to critical.
It can be called a breaking point because the actual pattern support
the bullish and the bearish movement at the same time.
If the price will find the power to bounce above $20.20
we can see it rising further up to $22.40, otherwise the price can move down
again following the red scenario.
Thank you and Good Luck!

DeGRAM | Silver shortSilver is clear in the bearish trend .
Price action made a complex pullback.
IF the market make a false break the resistance level then we can sell it from confluence level.
A false break is a great signal and opportunity for a trend continuation trade.
-------------------
Share your opinion in the comments and support the idea with like. Thanks for your support!

SILVER (XAGUSD) Important Breakout & Bearish Continuation 🪙
Hey traders,
Silver remains under a strong bearish pressure:
the price broke and closed below a key daily structure support cluster this week.
The next support that is spotted is 17.0.
I believe it is the next goal for sellers.
I will be waiting for an occasional retest of a broken structure to short from there.
❤️If you have any questions, please, ask me in the comment section.
Please, support my work with like, thank you!❤️

Silver MI’m bullish on silver. In 3-4 years we will see XagUsd above $100. Buy silver, silver stocks.

SILVER top-down analysisHello traders, this is the full breakdown of this pair. We will take this trade if all the conditions are satisfied as discussed in the analysis. Smash the like button if you find value in this analysis and drop a comment if you have any questions or let me know which pair to cover in my next analysis.

Silver: I Like to Move It, Move It!I like to move it, move it,
I like to move it, move it,
I like to move it, move it,
We like to move it !
You were bouncing along – admit it! Silver, at any rate, is shaking its booty to the beat, while continuing to move upwards. It should keep up the party mood and hop above the resistance at $20.84 to enter the upper turquoise zone between $20.94 and $22.42, where it should finish wave v in turquoise as well as wave 3 in green. After the subsequent countermovement in the course of wave 4 in green, silver should resume the overarching ascent.
However, there still is a 40% chance that silver could lose its rhythm and drop below the support at $18.88, which would then result in a detour below the next support at $18.01 and through the orange zone between $17.46 and $15.33.

DeGRAM | Silver shortSilver price went down and tested a major support zone .
Price action is likely to consolidate at resistance level.
-------------------
Share your opinion in the comments and support the idea with like. Thanks for your support!

SILVER, possible reversal?Silver(4h) has formed a double top after breaking the monthly doji. Today, after opening, the price has formed a bearish price action, with a gap opening. It is likely that the price is likely to drop to the monthly level of support.
If you enjoy this content, press the like button :)

Silver analysis: bear market rally and what lies aheadSilver has risen by 11% in the last two weeks. This performance comes after losing about 30% since March 8, indicating a so-called bear-market rally.
The main macro driver behind the silver price recovery has been a sharp drop in US bond yields, with the 1 0-year yield falling to 3-month lows at 2.6%, its lowest level since April, as the market now expects the Fed to be more dovish because of the recession.
From a technical standpoint, silver is approaching an important area of technical resistance in the $20.5-20.6 range, which includes the 50-day moving average, which has been trading above the metal's prices for more than three months. This area was also the support level in May, which was then breached in late June, resulting in a sharp selloff.
The significant rebound from the lower line of the major descending channel indicates a positive short-term price momentum for silver , with the RSI breaking above 50 for the first time since April 20th.
An overshoot above $20.7, and then above the psychological level of $21, would provide the bulls with additional confidence. Then, $22-22.3 (May/June resistance & February-April support) provides an important resistance area, where some stronger seller pressure could appear.
However, as long as prices do not decisively exceed the 50% Fibonacci retracement level at $22.6 and the 200-dma at $22.9, the broader silver's picture remains tilted to the bearish side.
Looking ahead, silver's strong correlation with safe-haven gold – which is currently close to one – is a positive factor if recession fears continue to fuel speculation on a dovish Fed. In contrast, if the Fed continues to tighten monetary policy despite the recession, this might keep silver prices relatively contained (below $22.5) for longer.
Analysis by Capital.com's forex and metals analyst Piero Cingari

SILVER-XAGUSDThe price of the trend line has broken, and according to my analysis, the price will have a correction from this price range, and then we will see an increase in the price again.

Silver: Last Stop !Before we head further down south, the silver price should recover more clearly and rise in the green target zone between $18.94 - $19.99. From there, we expect the last bearish push into the orange zone below.
