Silver XAGUSD analysisThis is how I see silver playing out over the next several hours
Long and then going short back with the market sentiment
Silverforecast

Silver: Into the Green 🌱 🌿Silver needs to relax a bit and as its last foray into the green was too short to enjoy, it has treated itself with another trip. We expect silver to extend the stay until the upper edge of the green zone between $23.69 and $24.43, where it should finish wave 2 in green. Then, it should turn around and leave the green zone to go down below the support at $21.94 and afterwards even further below $21.41.
Still, there is a 38% chance that silver could surmount the green zone and rise above the resistance at $24.75. If it makes it even above $25.49 afterwards, it should continue the ascent.

SILVER top-down analysisHello traders, this is the full breakdown of this pair. We will take this trade if all the conditions are satisfied as discussed in the analysis. Smash the like button if you find value in this analysis and drop a comment if you have any questions or let me know which pair to cover in my next analysis.

Silver: No Dormancy 🐻 🐻 🐻 Usually, at this time of year, bears would be snuggled up in a cozy cave or den for their annual dormancy. However, at the silver market, they are full of beans and hold onto the price fast.
After agonizing about it for a while, the silver price has finally fallen below the resistance at $23.48. Thus, we consider the downward trend we predicted affirmed. If the bears can keep the price below $23.48, we expect it to go even lower and break through the next marks at $21.94 and $21.41.
Still, there remains a 30% chance that the bulls could interfere and cause a change of direction. If they prevail and bring the price back above $23.48, they could even manage to shove it above the resistance at $25.49.

Silver can roll back to supportSilver has had a very good start of the year, with the precious metal gaining more than 10% in only 3 weeks.
From a technical perspective, the price has started to drop from an important confluence resistance given by the falling trend line and horizontal support and we can have a continuation to the downside in the next days/weeks.
23.50 is now support followed by 21.50 very important one which can also be bears target.
A new high above 24.50 would negate this scenario

Silver: supported by a rising trend lineEven though a continuation of the consolidation cannot be ruled out, its extent should be limited.
Our preference: Long positions above 22.60 with targets at 22.85 & 23.00 in extension.
Alternative scenario: Below 22.60 look for further downside with 22.45 & 22.32 as targets.

Silver is approaching short term resistanceAfter making an instraday low just under 22 figure on Monday, Silver has started to recover and now is trading at 22.55.
However, the rise from the low looks corrective and is overlapping and now the price is also facing 22.60-22.80 strong resistance zone.
My opinion doesn't changed and I 'm still bearish Silver but at this moment I wait for more confirmations.
A daily close under 22.40 would bring this needed confirmation and price can drop to 21.40-21.50 after such a daily close

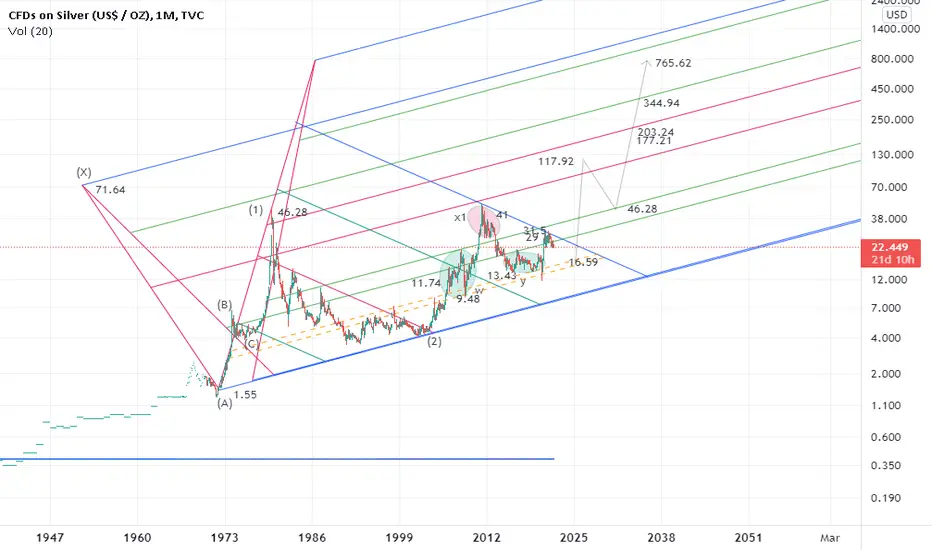
the 3rd wave will continue from $16.59?crab harmonic pattern:
X=$71.64
A=$1.55
AB=0.38 XA
BC=0.38 AB
1.6 BC=$9.48
2 BC=$11.74
2.24 BC=$13.43
2.6 BC=$16.59
3.6 BC=$29
0.78 XA=$31.54
4.23 BC=$41
0.88 XA=$46.28
1.13 XA=$117.92
6.85 BC=$177.21
1.27 XA=$203.24
1.41 XA=$344.94
1.6 XA=$765.62
Silver (XAGUSD) Analysis 04/03/2021this is a 2 Day Candle Chart
as we can see the Price is up Ranging in a Yellow Ascending Parallel Channel where currently it is trying to break the lower bond.
there exist a Fibonacci golden zone of the smaller impulsive wave, which can show Support and if the price bounces from it then we can target the 1TP, which is Fibonacci Expansion -27% level of the main Bullish Wave.
the Red Box (Fib Confluences Level IMPORTANT) is the confluences of the 76.4% Fib Retracement of Smaller Impulsive wave and 38.2% Fib Retracement of the main bullish wave, where if the price falls and it stands as a support and bounces the price, then we can target the 2TP, which is the -61.8% Fibonacci Expansion Level of the main Bullish Wave.
there are 2 Vertical Lines which Shows the Speculated Dates for Achieving the Specified Targets, they are specified by Trend-Base Fibonacci Time,
there are total of 2 TPs Specified
1TP=35$
2TP=41$
please comment your Opinions...

Silver is soooo looowLast time I saw silver this low I bought A LOT.
Silver has been doing exactly as it should be doing and it only took gold becoming a tier one asset. 23 as of right now with material sector of S&P looking great both short and long term and miners not being too affected by inflation.
Shortages of metals are still there however and it looks like the premiums are here to stay, a year later. With Evergrand in the gutter, Chinese people are finding it hard to obtain their fiat notes. THIS is the exact reason why I stack. I pray we dont see a bank run but if we do us stackers should be ready, provided you know what to do with your metals.
I feel in this environment Silver is in the perfect situation, if FED raises rates.

XAGUSD Buy Silver price is $23 For today. Inflation rate is too high in global economy, technical analysis also gives bullish signals on Gold and Silver charts. S/L is under $20 T/P $40. Good luck!

Silver- Best place to sell for a 4k pips profitAfter reaching 21.50 support, Silver has started to rebound and is trading now 1k pips up from this support.
However, after the false break above H&S s neckline, in my opinion, XagUsd is in a downtrend and will soon resume its trajectory to the downside.
The best place to sell it is just under 23 resistance, and such a trade can have a 4k pips profit if we target 19 support

Silver: A long road ahead!We have come so far already, but there is much more to do! In our primary scenario, we expect the course to further drop and fall under the support at $21.41. After reaching these levels, the final stage of falling below $20 can be tackled. A temporary countermovement has a probability of 25% and can only be realized with an increase over $25.88.
Keep waiting!

Silver long entry at handSilver is now at the edge for a step higher towards 23.7, perhaps one more test to the downside, but the probabilities with lower $dxy into end of the year are quite good for silver-earnings...

Silver weekly analysis As you can see in the chart Silver is making lower high on weekly time frame and after 3 weeks of down fall we can expect a bounce back from next week.
21.50 is very important support area, if closes below the level will attract heavy selling.
Let it consolidate for 1 or 2 days then buy above recent high.
We can head back to 23.50
Closing above 22.50 will confirm up move.

XAG/USD (SILVER) GOING UP FOR A SHORT TERM RECOVERYXAG/USD (SILVER) is going up-side for a short-term recovery for wave b of the 5th wave as an ending diagonal (wedge pattern) on the 2nd wave. If the scenario is right we can go around $23 then we will go below the recent low of $21.79 ( if the 5th wave doesn't truncate).
Wave be must probably go as a zigzag (5-3-5) patter but it is not necessary it can make a complex correction, flat or a triangle as well so need to be very careful on price action.
DISCLOSURE - Please be informed that the information I provide is not a trading recommendation or investment advice. All of my work is for educational purposes only.
All labeling and wave count have been done by me manually and I will keep changing according to the LIVE MARKET PRICE ACTION. So don't bias, hope on my trade plans. Try to learn Elliott Wave or other strategies and make your own strategy. Following is not that much easy. I am not responsible for any losses if u took the trade according to my trade plans.
#XAG/USD #SILVER #ELLIOTTWAVE

Will Silver drop to 19 zone(3000 pips drop)?Since August, Silver is trading in a 10-12% range, with a low just above 22 and a high in 24.50 zone.
At the beginning of November, we have a false break above resistance and a quick drop to support afterward.
Usually, false breaks lead to strong moves in the other direction and I don't expect this time to be different.
In conclusion, in my opinion this support will fall, and XagUsd has a clear road to the next important support at 19 zone (a more than 3000 pips drop)
I will remain extremely bearish Silver as long as the price is under 23.50 and traders should look to sell rallies towards that zone.
Best of luck!
Mihai Iacob
P.S: Write your comment or share your chart and analysis in the comment section. Also "Likes" are much appreciated

SILVER top-down analysisHello traders, this is the full breakdown of this pair. We will take this trade if all the conditions are satisfied as discussed in the analysis. Smash the like button if you find value in this analysis and drop a comment if you have any questions or let me know which pair to cover in my next analysis

bullish cypher forming on silver by the ADlook for a retest of B leg, if support holds and remain strong. I see a potential cup and handle forming off the D leg which will lead to a breakout and retest of B leg

XAG/USD (SILVER) WILL PUSH LOWER BELOW $22.6XAG/USD (SILVER) will push lower to make a new low below $22.6 and after that, it can push a little bit higher, but not above $23.7. Then it will go for one deep correction as a continuation of wave (2). In the alternative scenario (marked by red alpha numerals), we have already finished wave (2) @ $21.4. So right now, it's running expanded flat, and will soon rise for minor wave 3.
#XAG/USD #SILVER #ELLIOTTWAVE

SILVER...A BULLISH GOLDMINELooks like we can see another bullish run from silver and here is why
the pair has been making strong bearish moves to the support zone and touching the bullish trend line.
the bearish fullback has managed to touch the 61.8% pull back of the fib
the RSI has made a is indicating that the market is well oversold so bulls will start making there moves on moday
fundamentals
MONDAY, NOVEMBER 29
17:00
USD Pending Home Sales (MoM)(Oct)
22:05
USD Fed's Chair Powell speech
TUESDAY, NOVEMBER 3016:00
USD Housing Price Index (MoM)(Sep)
USD S&P /Case-Shiller Home Price Indices (YoY)(Sep)
16:45
USD Chicago Purchasing Managers' Index(Nov)
17:00
USD Consumer Confidence(Nov)
USD Fed's Chair Powell speech
18:30
USD 52-Week Bill Auction
20:00
USD Fed's Clarida speech
more news on fxstreet

SILVER top-down analysisHello traders, this is the full breakdown of this pair. We will take this trade if all the conditions are satisfied as discussed in the analysis. Smash the like button if you find value in this analysis and drop a comment if you have any questions or let me know which pair to cover in my next analysis.

WHY SOULD I SILVER ??TECHNICALS
A great bullish swing move will soon begin for the following reasons.
- price has come to retest support
- price has come to retest the bullish trendline
- the bearish movement has pushed the price down to the 61.8 pullback
- RSI is indicating that the pair has been oversold which means a strong buy may come in play soon
FUNDAMENTALS TO LOOK OUT FOR
TUESDAY, NOVEMBER 23
14:45
USD Markit Manufacturing PMI(Nov) PREL
USD Markit Services PMI(Nov) PREL
USD Markit PMI Composite(Nov) PREL
USD President Biden speech
WEDNESDAY, NOVEMBER 24
13:30
USD Durable Goods Orders ex Transportation(Oct)
USD Durable Goods Orders ex Defense(Oct)
USD Durable Goods Orders(Oct)
USD Initial Jobless Claims(Nov 19)
USD Nondefense Capital Goods Orders ex Aircraft(Oct)
USD Initial Jobless Claims 4-week average(Nov 19)
USD Gross Domestic Product Annualized(Q3) PREL
15:00
USD Personal Consumption Expenditures - Price Index (YoY)(Oct)
USD Core Personal Consumption Expenditures (QoQ)(Q3) PREL
USD Core Personal Consumption Expenditures - Price Index (MoM)(Oct)
USD Michigan Consumer Sentiment Index(Nov)
USD Personal Income (MoM)(Oct)
USD Gross Domestic Product Price Index(Q3) PREL
USD Personal Consumption Expenditures - Price Index (MoM)(Oct)
USD Personal Consumption Expenditures Prices (QoQ)(Q3) PREL
Home Sales (MoM)(Oct)
USD New Home Sales Change (MoM)(Oct)
USD Core Personal Consumption Expenditures - Price Index (YoY)(Oct)
more news on fx street.
