SILVER is ready for another BIG BULLISH TRIANGLE breakout!SILVER is ready for another BIG BULLISH TRIANGLE breakout!
That's a big bullish triangle, let's smoke some hopium and pray it breaks up! 65% Chance it breaks up, 35% chance it breaks down.
Trade safe my friends...
TVC:SILVER
Silvertrade

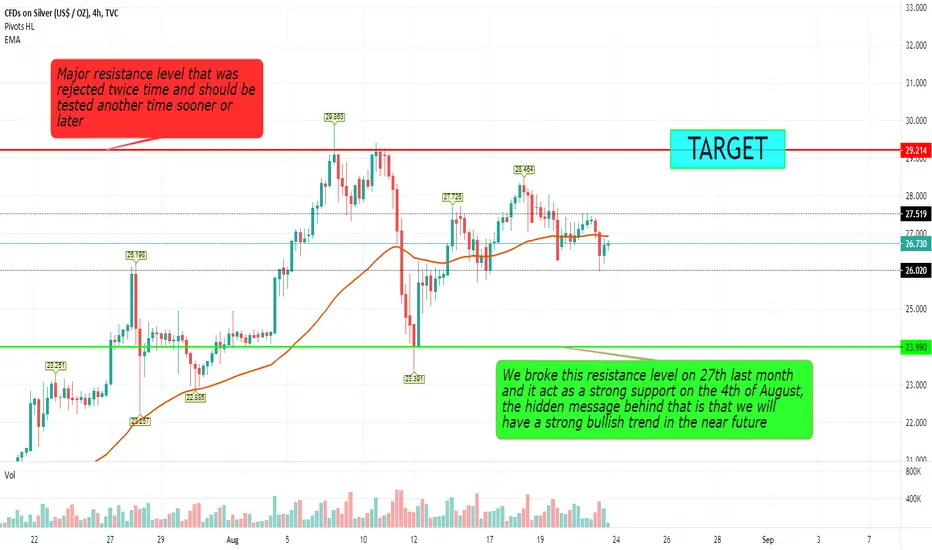
SILVER ANALYSIS AND FORECAST FOR NEXT WEEK UNTIL 28th OF AUGUST Please share with me your thoughts,
Regards

XAG/USD: LONG trade setupit is about to turn extremely volatile. but the destiny to take this one uP


SILVER is in a BULLISH FLAG !SILVER is in a BULLISH FLAG !
Extracted two measurements for two possible pole measurements..
TVC:SILVER


Massive Green Engulfing! (SILVER)Green arrow points to where your signal was to go long on silver.
This one was analyzed around mid $14 for a buy entry on a long term move.
The 3day is a beautiful green impulse.
Now we are creating distance from the initial buy, more space = better trade.
No stress with this one as I will hold for a long term hold.
Will update this if I see any key signs for any reversal.
For now, we are solid. ✌😁🥇

Keep Breaking Levels. (SILVER)Current channel proceeding with no slowing down after breaking up for the high highs.
This position is going well. Love this price movement as the candles fire green!
Let's keep it running bulls!
Have an awesome day 😁


What You Think? (SILVER) Triple bottom for a sideways break to the upside?
You like these prices or think she going to RIP south?
I'm adding long term.
HODL

Looks Juicy!!! (Silver)50% fib retracement triple hit for support.
Starting to compress in sideways pennant.
Red circles represent a key level that I'm watching.
Think I will begin to accumulate silver for a very long term hold around these prices.
If broke 13.67 than I'd be concerned.

SILVER (US$ / OZ) Monthly, Weekly, & DailyDates in the future with the greatest probability for a price high or price low.
The Djinn Predictive Indicators are simple mathematical equations. Once an equation is given to Siri the algorithm provides the future price swing date. Djinn Indicators work on all charts, for any asset category and in all time frames. Occasionally a Djinn Predictive Indicator will miss its prediction date by one candlestick. If multiple Djinn prediction dates are missed and are plowed through by same color Henikin Ashi candles the asset is being "reset". The "reset" is complete when Henikin Ashi candles are back in sync with Djinn price high or low prediction dates.
One way the Djinn Indicator is used to enter and exit trades:
For best results trade in the direction of the trend.
The Linear Regression channel is used to determine trend direction. The Linear Regression is set at 2 -2 30.
When a green Henikin Ashi candle intersects with the linear regression upper deviation line (green line) and both indicators intersect with a Djinn prediction date a sell is triggered.
When a red Henikin Ashi candle intersects with the linear regression lower deviation line (red line) and both indicators intersect with a Djinn prediction date a buy is triggered.
This trading strategy works on daily, weekly and Monthly Djinn Predictive charts.
Trades made when the monthly, weekly and daily arrows are pointing in the same direction are the most profitable.
This is not trading advice. Trade at your own risk.

SilverIdea for XAGUSD
Top can be seen to be suggested perfectly by the Fibonacci spiral
price can be seen to trade along the 1 fib level within the Fibonacci circle
The bullish divergence might provide enough momentum for a bounce up to the level indicated however i think the spiral indicated will be the bottom.
Currently under the 200MA also.
The transition between fib rings within the circle may create some volatility.

XAG/USD moving back to resistance Fib Silver putting in a solid move back to resistance - target is the 61.8 Fib zone - would watch what for the MA Squeeze for any pullback

XAGUSD. The price of Silver has gained stability.Hi subscribers!
The price of Silver will grow because the key level has maintained
and strengthened the price at a stable level.
The price will rise up to the target.
If you liked this idea, please like and subscribe to my profile.
This idea does not provide the financial advice.

SILVER (US$ / OZ) DailyDates in the future with the highest probability for price direction reversals

SILVER Intraday BullflagSilver has formed a bullflag on the 1H chart, this will lead to fresh gains. It can be seen that the price is sitting above the immedaite trend line resistance.
XAGUSD: Short Trade SetupLike Gold, Silver is still in the midst of a down trend. We've had a 3 wave pullback in the past couple of sessions and price seems to have setup for a short trade. There's always the possibility that this corrective structure may form into a double correction. Wait for clear confirmation before looking for any sell opportunities.


Is SILVER run over? It appears that we are still in a massive bear channel and this was a bear market rally. Both TVC:GOLD and TVC:SILVER appear to be overbought. Silver is showing a massive weekly shooting star. Might see another leg up (within the channel)but then a decline to find another bottom. Looks like it got all the FOMOs out there. Unless we break out of this bear channel staying bearish.
