Silver-Correct analysisTrue analysis. Tast's an update. Based on my analysis for XAGUSD on Jul 27 & Aug 1.
Observe the money management and the stop loss, to know about analysis, follow me and contact me if you have any comments or questions. (I will answer whenever I have time).
Silverusd

Is Silver preparing for long bull run?Comparing the last 50 years of the Silver chart along with the 80's market top along with the 2011 market top. We can see a clear cup and handle 42 years in the making.
Price action is laid over 2 indicators
The Extended Golden Ratio Multiplier
The CM Ultimate MA MTF
The focus of this chart is the pink fib line of the Multiplier and the green & red CM Ultimate MA. I have the focus area circled with what seems to be the interesting point of the chart and indicators. In 1987 the price of silver tired to push back through the MA lines but was rejected and in 89 the pink line followed and kept falling. in 2019 and 2020 try's the same move but this time price action pops through then corrects and so far seems to have found support on the MA lines. At the same time the pink line is crossing the now red CM Ultimate line which historically has happen every time price action has made moves up for months and months afterwards.
We also cannot skip or not touch upon the Dragonfly doji caused in the first half of 2020. This too is usually a very indicator that price action could be moving up over the next few candles and beyond.
Although Gold to me is showing some signs of weakness, Silver to me at least from this chart looks like a very bullish for possibly next few years. Let me Know what you think down below.
Thanks for looking
WeAreSat0shi
Stay Blessed!

Silver quick lookTechnically, silver will test strong support, as what it breached, we may see it again at 22 levels.
The four golden rules of trading
1 Don't be greedy
2 Always use stop loss
3 Never add other positions to the losing positions
4 Use a suitable lot for your account
❤️Please, support our work with like & comment!❤️

20 REASON FOR BUY SILVER 1 Structure analysis time frame DAILY
2 target time frame :DAILY
3 Current Move :IMPULSE
4 Entry Time Frame : H4
4.1 Entry TF Structure: BULLISH
4.2 entry move : CORRECTIVE
5 Suppot resistence base :H4 FAIR VALUE GAP
6 FIB: DISCIUNTED AREA FILLED
7 candle Pattern: PANIC BOTTOM
8 Chart Pattern: LOWER HIGH
9 Volume : AVERAGE
10 Momentum UNCONVENTIONAL Rsi: SIDEWAYS
11 Volatility measure bollinger bands: LOWER BAND FAKE BREAKOUT BULLISH
12 strength ADX: SIDWWAYS
13 Sentiment ROC: BULLISH
14 final comment : LONG
15 : decision : BUY
16 Entry: 19.178
17 Stop losel: 18.968
18 Take profit: 20.950
19 Risk to reward Ratio: 1:10
Excepted Duration : 5 DAYS

Silver analysis: How far the bear market rally might go?Silver is in the midst of a bear market rally, up 8% in the last two weeks and 13% since the end-of-August lows.
Although silver prices are still 23% below the peak reached in March, recent price movements suggest that silver is attempting to make a trend reversal at these levels.
Slowing market pricing for Fed interest rates next year has prompted the rally in silver prices over the past weeks. Investors reduced their forecasts for interest rates in the second half of 2023, and in the last week they priced in a first drop of 25 basis points after Fed funds are expected to reach a high of 4.9% in the first quarter of 2023.
An asset like silver that is extremely vulnerable to US interest rates has been granted some breathing room by both the decrease in Treasury yields – the US 10y yield has dropped by 30 basis points in the past week – and the weakening of the US dollar – with the DXY index falling below 110. Silver has been strongly and inversely correlated with the US dollar performance throughout the year.
The Federal Reserve meeting next week poses a concern because it could reignite hawkish arguments about the need to curb inflationary increases, which might halt the silver's rally. However, understanding how likely the Fed views a recession in 2023 will be critical, given the market builds many of its expectations for the conclusion of the hiking cycle next year on this matter.
A new attempt to break the 23.6% Fibonacci retracement level (2022 max-min range) can be seen on the daily silver technical chart. Sellers fought back hard at this level in September, pushing prices below the $19.7–20 zone. This level was breached in early October, causing prices to rise to $21.1-21.2 (38.2% Fibonacci).
Momentum indicators indicate that bullishness is gaining traction. The 14-day RSI surpassed 50 days once more, and the MACD indicates a bullish crossover close to the zero line.
If silver is successful in breaking over $19.8, a new overshoot toward $21.1 or $21.6 (200-day moving average) is possible. At that point, sellers might resume offering fierce pushback. Next Wednesday, a very hawkish Federal Reserve could return to exert downward pressure, leading to a retest of the 18.2 support level.
Idea written by Piero Cingari, forex and commodity analyst at Capital.com

Long Term VWAP trend has turned bullish for Silver after 11 yrsAtfter 11 years of bearish VWAP trends in silver... it has turned bullish and is testing. Silver is interesting as we sit in this "inflationary" environment. I say "inflationary" with quotes as we have a CRB index rising WITH the DXY. This hasn't occurred since the early 1970's and points more towards a supply issue vs. a monetary problem. Hence we see things like food and oil scream higher while metals have been lagging. This bullish turn on the VWAP in silver could be pointing a change in the metals' action in the medium term though. A confirmation would require a break and hold above the highest VWAP, which failed and failed hard in April.
I was much more confident in a break out where we failed and was wrong... yet this setup still has strength behind it. If price gets back above the upper VWAP I will be keeping a close eye on metals into the fall.

My Two Best Friends. Gold and .....Silver will turn in the beginning of december at about a price of 15 and a half dollar. Will be the precious metal buy of the holiday season. Load of because it's going to 68.1.

$SILVER bouncing from 2 year downtrend channel supportDowntrending channels are powerful
indicators. Watch silver to see if this pattern continues.
$SILVER will probably bounce back towards middle of channel
(dashed line) 21.40

SILVER POSSIBLE BULLISH MOVE Hello traders , today i share my silver analysis with you .
i think that silver may be bullish very soon and here is why :
- We Have Weekly Candle Closed As A Hammer on a key support level
- Bullish Rsi Divergence (Lower lows on price higher lows on Rsi )
- We Have an Inversed Head and shoulders in the making
But We have a Trendline that must be broken for this analysis to be Valid.

Silver breaks both the 50-day MA and the bearish trend lineWhat a day for silver !
Spot silver went up more than 5% to $19.7 per troy ounce in one of the best sessions this year, hitting the highest levels since August 18.
Silver's daily price action broke through both the 50-day moving average and the 2022 bearish trend line connecting the lower highs of April and August.
Momentum indicators show the daily RSI spiking above 50 and the MACD providing a bullish crossover last Friday. The latter has been a reliable bullish technical signal. The May 19 MACD bullish crossover led to a 5.7% rally until June. The July 21 MACD bullish crossover sparked a 12.1% rally to mid-August.
The following key resistance levels to keep an eye on are: 20.00 (psychological), 20.8 (August highs), and 21.15 (38.2% Fibonacci of 2022 low to high). The 50-dma at 19.23 now represents the immediate support level on the downside.
Idea written by Piero Cingari, forex and commodity analyst at Capital.com

XAG / USD SILVER - Gonna Go PRABOLICWith the economic turmoil people hedge with commodities and silver is due for a parabolic mega move aaaaaahyeeeeee

SILVER (XAGUSD) Important Breakout & Bearish Continuation 🪙
Hey traders,
Silver remains under a strong bearish pressure:
the price broke and closed below a key daily structure support cluster this week.
The next support that is spotted is 17.0.
I believe it is the next goal for sellers.
I will be waiting for an occasional retest of a broken structure to short from there.
❤️If you have any questions, please, ask me in the comment section.
Please, support my work with like, thank you!❤️

SILVER RESISTANCE RESISTANCE RESISTANCE... NOW SUPPORT?Looking back at silver over the last decade reveals a very significant trend. Note the resistance peaks and where silver crawled around in the dirt for years and years. In 2020-21 silver broke out of that trend only to come all the way back down the touch the trend.. right now. Is the old ceiling the new floor? It very well could be. It is my opinion that silver will more than 10x over the next 6-10 years. However, we are in strange times and things are accelerating. It is possible that this 6-10 year forecast is too small-minded and things happen much sooner. I am very interested in silver, gold, and the miners moving forward and I believe this could be a bottom.

Medium term bias remains bearish on SilverSilver - Intraday - We look to Sell at 19.5400 (stop at 19.7539)
The medium term bias remains bearish. We have a 38.2% Fibonacci pullback level of 19.5428 from 18.7205 to 20.8732. There is scope for mild buying at the open but gains should be limited. Preferred trade is to sell into rallies.
Our profit targets will be 18.7206 and 18.5000
Resistance: 19.4035 / 19.5428 / 19.9370
Support: 19.1078 / 18.9555 / 18.7981
Risk Disclaimer
The trade ideas beyond this page are for informational purposes only and do not constitute investment advice or a solicitation to trade. This information is provided by Signal Centre, a third-party unaffiliated with OANDA, and is intended for general circulation only. OANDA does not guarantee the accuracy of this information and assumes no responsibilities for the information provided by the third party. The information does not take into account the specific investment objectives, financial situation, or particular needs of any particular person. You should take into account your specific investment objectives, financial situation, and particular needs before making a commitment to trade, including seeking advice from an independent financial adviser regarding the suitability of the investment, under a separate engagement, as you deem fit.
You accept that you assume all risks in independently viewing the contents and selecting a chosen strategy.
Where the research is distributed in Singapore to a person who is not an Accredited Investor, Expert Investor or an Institutional Investor, Oanda Asia Pacific Pte Ltd (“OAP“) accepts legal responsibility for the contents of the report to such persons only to the extent required by law. Singapore customers should contact OAP at 6579 8289 for matters arising from, or in connection with, the information/research distributed.'

SILVER (XAGUSD) Your Detailed Trading Plan 🪙
Multiple time frame analysis on Silver.
Learn how to short wisely with confirmation.
❤️Please, support this video with like and comment!❤️

xagusd to $70?is xagusd going to find support here on the 6 month chart?
- mid bollinger band
- corrective poc from ATH to 2020 low
- golden pocket retrace of the move up
- candle apporaching fibo circle
- diagonal breakout retest

Precious metals about to jumpI think we're already in recession, it won't take long before regular people and precious metals investors to realize that. Expecting a 🚀 trend for precious metals.

SILVER top-down analysisHello traders, this is the full breakdown of this pair. We will take this trade if all the conditions are satisfied as discussed in the analysis. Smash the like button if you find value in this analysis and drop a comment if you have any questions or let me know which pair to cover in my next analysis.

Silver-XAGUSDThe price breaks the trend, and according to my analysis, the price will have a correction, then we will see a position to sell.

SILVER-XAGUSDThe price of the trend line has broken, and according to my analysis, the price will have a correction from this price range, and then we will see an increase in the price again.

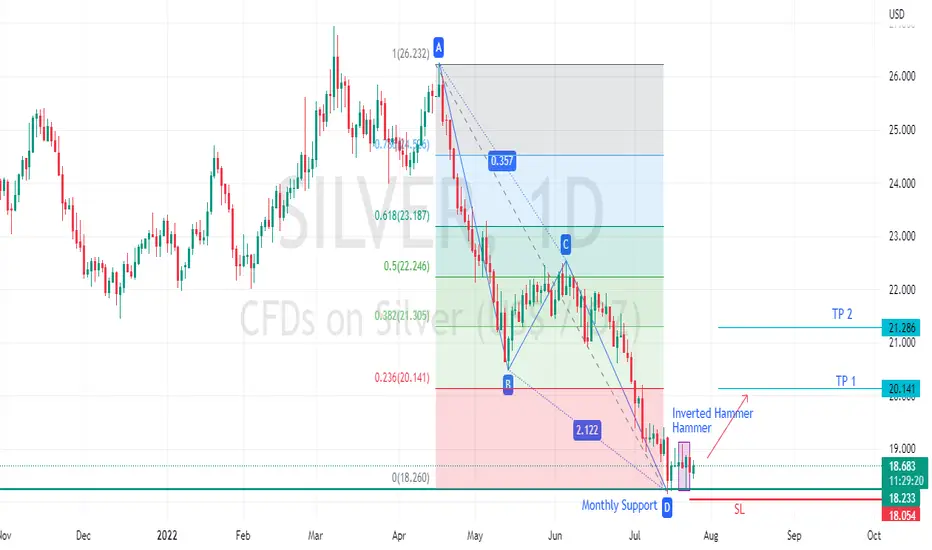
SILVER Bullish PotentialABCD Bullish reversal pattern
Monthly support rejects the price and appears two Bullish Hammer and Inverted Hammer
Here This level is three Bullish Signal maybe this point is trend Reversal
Stop Loss: 18.04
Big Moment For SilverHi, this is my new update for Silver. Silver has lost 32% of its value since March 2022 and I expect we have reached the bottom. If we look at the purple rectangles we see that the area between $18 - 19.50 always acted like support and resistance level in different periods. In July 2020 we broke the multi year resistance level (2014-2020) and we never backtested. I think now we have finally backtested it like a support level and at the same time we have reached a 61.8% FIB retracement level. We also have an oversold RSI level and I expect we are going to make a double bottom in the RSI like I drew and that will give us a bullish momentum. In the short term I expect we are going from $18 - 20.50 to backtest the 200 weeks moving average and I will update you guys in the near future.

Silver under pressure and further downside is expectedSilver - Intraday - We look to Sell at 18.85 (stop at 19.09)
The medium term bias remains bearish. Previous support level of 18.74 broken. A weaker opening is expected to challenge bullish resolve. Bespoke resistance is located at 18.85. Further downside is expected although we prefer to set shorts at our bespoke resistance levels at 18.85, resulting in improved risk/reward.
Our profit targets will be 18.14 and 17.90
Resistance: 18.74 / 18.85 / 19.41
Support: 18.14 / 18.00 / 17.90
Risk Disclaimer
The trade ideas beyond this page are for informational purposes only and do not constitute investment advice or a solicitation to trade. This information is provided by Signal Centre, a third-party unaffiliated with OANDA, and is intended for general circulation only. OANDA does not guarantee the accuracy of this information and assumes no responsibilities for the information provided by the third party. The information does not take into account the specific investment objectives, financial situation, or particular needs of any particular person. You should take into account your specific investment objectives, financial situation, and particular needs before making a commitment to trade, including seeking advice from an independent financial adviser regarding the suitability of the investment, under a separate engagement, as you deem fit.
You accept that you assume all risks in independently viewing the contents and selecting a chosen strategy.
Where the research is distributed in Singapore to a person who is not an Accredited Investor, Expert Investor or an Institutional Investor, Oanda Asia Pacific Pte Ltd (“OAP“) accepts legal responsibility for the contents of the report to such persons only to the extent required by law. Singapore customers should contact OAP at 6579 8289 for matters arising from, or in connection with, the information/research distributed.'
