I think GBPCAD has been bought enough for some possible shortsGBPCAD has been bullish for some time, now I think its almost ready for some possible short.
it was over bought so many time on the RSI.
lets see if it can break the 1.75464 support level for some short or return to its initial trend after breaking the 1.77963 resistance to continue its rally
It's just my Idea not a financial advice
what do you think ?
Sine Wave

I think EURUSD Is due for a short EURUSD has just broken the parallel trend channel
and I think it will be ready for a few some shorts once it breaks the 1.20239 support
Just my Idea
what do you think


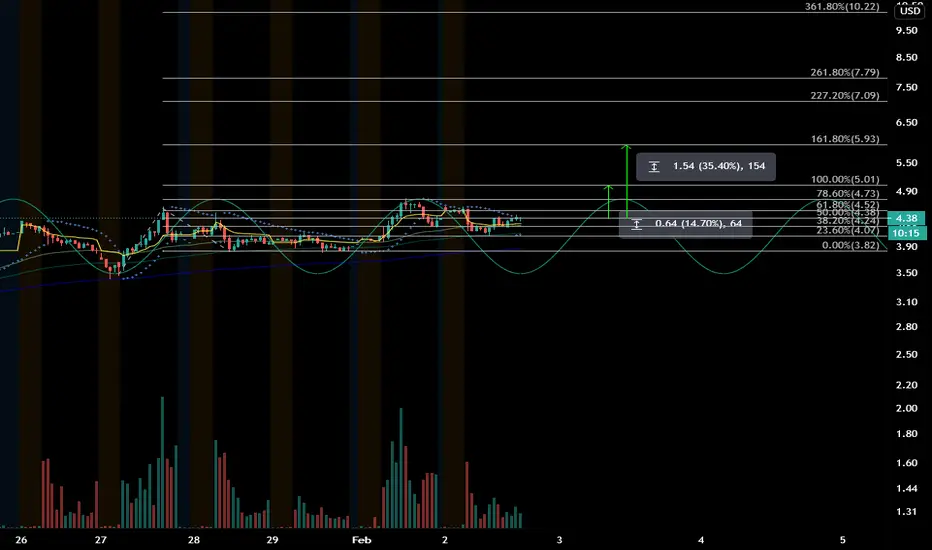
IDEX smooth rise towards previous highs with 35% short term gainIDEX seems like it's moving in a good pattern and hitting fib lines on the way to previous highs. It should at least hit the 100% line, and if it does, it may get excited and shoot for previous highs at the 1.618 line ($5.93) = 35% gains.
SWI possibly $19 by 5FebSWI could reach $19 by 5Feb if it stays in this current channel and timing. I wouldn't expected any huge moves since it's recovering from bad news a while ago.

BTCUSDT Potential direction (Estimate next peak in April)My very novice TA.
I suspected that 42k (8th Jan) was the peak of that cycle & it would dip from there probably to 28-25k over a week or so, say by the 18th feb. That process held off for about a week but is now in full swing. I estimate that it could go to as low as 22 & then pop back up, & follow more or less within the range (Yellow plot), more or less a in fluctuating sideways direction, then gradually start coming back up again. With the next peak sometime in April, probably not drastically higher, but probably about 47k to 52k.
Just an idea, not financial advice. I am short-term bearish as the December wave was far too frothy & clearly broke at 42k, and now that wave is still coming down, getting ready for the next set. If I look at the fib circles & sine waves, or atleast just visually with my very basic understanding, & then look at the MACD, there is still some more room to come down before it plateaus out. Then as I say I think it will go sideways, then gradually back up. There's so much institutional investment money pumped into it, but in every cycle, there's a dip, as sell orders get triggered & people cash out, before buy orders get triggered & people buy more.
So that's my very novice TA.. Definitely not financial advice, I'm a construction worker, not a financial analyst lol. Just an idea & trying to see if i can map out the potential direction moving forward. Give it a like or some constructive criticism if you like. Look after yourselves, & buy the dip.. Peace :)

CEY - Centamin - Poised to close the gap?Could this be the next fractal developing? Would be a beautiful way to close that gap! Touched the 62% retracement today, with some nice momentum divergence on show over the past few weeks.

CRON A historical cycle back ? CRON This cycle forecast, this cannabis stock is 100% cyclical, do you have any ideas?
#CycleStocks.


Sell Signal: 0.6907Ingenuity Trading Model-
Geometric Markov Model : In probability theory, a Markov model is a stochastic model used to predict randomly changing systems. Markov Models are used in all aspects of life from Google search to daily weather forecast. The randomly changing systems we focus on are the equity, futures, and forex markets. The geometric element of the model is the fractal wave structure you can find on any chart you look at across any market and across all time dimensions.
Our model focuses on the current wave formation (current state)- geometric price formation along with its volume and volatility over a given time period and using that information to predict the future state- future price movement.

Reversing Long to Short at: 1.3232Ingenuity Trading Model-
Geometric Markov Model : In probability theory, a Markov model is a stochastic model used to predict randomly changing systems. Markov Models are used in all aspects of life from Google search to daily weather forecast. The randomly changing systems we focus on are the equity, futures, and forex markets. The geometric element of the model is the fractal wave structure you can find on any chart you look at across any market and across all time dimensions.
Our model focuses on the current wave formation (current state)- geometric price formation along with its volume and volatility over a given time period and using that information to predict the future state- future price movement.

Sell Signal: 77.39Ingenuity Trading Model-
Geometric Markov Model : In probability theory, a Markov model is a stochastic model used to predict randomly changing systems. Markov Models are used in all aspects of life from Google search to daily weather forecast. The randomly changing systems we focus on are the equity, futures, and forex markets. The geometric element of the model is the fractal wave structure you can find on any chart you look at across any market and across all time dimensions.
Our model focuses on the current wave formation (current state)- geometric price formation along with its volume and volatility over a given time period and using that information to predict the future state- future price movement.

Trade Update: Sell 25-50% and move stop to breakeven #crypto Ingenuity Trading Model-
Geometric Markov Model : In probability theory, a Markov model is a stochastic model used to predict randomly changing systems. Markov Models are used in all aspects of life from Google search to daily weather forecast. The randomly changing systems we focus on are the equity, futures, and forex markets. The geometric element of the model is the fractal wave structure you can find on any chart you look at across any market and across all time dimensions.
Our model focuses on the current wave formation (current state)- geometric price formation along with its volume and volatility over a given time period and using that information to predict the future state- future price movement.

Buy Signal: 1664.7 #goldIngenuity Trading Model-
Geometric Markov Model : In probability theory, a Markov model is a stochastic model used to predict randomly changing systems. Markov Models are used in all aspects of life from Google search to daily weather forecast. The randomly changing systems we focus on are the equity, futures, and forex markets. The geometric element of the model is the fractal wave structure you can find on any chart you look at across any market and across all time dimensions.
Our model focuses on the current wave formation (current state)- geometric price formation along with its volume and volatility over a given time period and using that information to predict the future state- future price movement.

Buy Signal: 36.21 #stocksIngenuity trading Model-
Geometric Markov Model : In probability theory, a Markov model is a stochastic model used to predict randomly changing systems. Markov Models are used in all aspects of life from Google search to daily weather forecast. The randomly changing systems we focus on are the equity, futures, and forex markets. The geometric element of the model is the fractal wave structure you can find on any chart you look at across any market and across all time dimensions.
Our model focuses on the current wave formation (current state)- geometric price formation along with its volume and volatility over a given time period and using that information to predict the future state- future price movement.

Reversing Long to Short at: 0.6291 #forexIngenuity Trading Model-
Geometric Markov Model : In probability theory, a Markov model is a stochastic model used to predict randomly changing systems. Markov Models are used in all aspects of life from Google search to daily weather forecast. The randomly changing systems we focus on are the equity, futures, and forex markets. The geometric element of the model is the fractal wave structure you can find on any chart you look at across any market and across all time dimensions.
Our model focuses on the current wave formation (current state)- geometric price formation along with its volume and volatility over a given time period and using that information to predict the future state- future price movement.

Reversing Short to Long: 1.6303 #forexIngenuity Trading Model
Geometric Markov Model : In probability theory, a Markov model is a stochastic model used to predict randomly changing systems. Markov Models are used in all aspects of life from Google search to daily weather forecast. The randomly changing systems we focus on are the equity, futures, and forex markets. The geometric element of the model is the fractal wave structure you can find on any chart you look at across any market and across all time dimensions.
Our model focuses on the current wave formation (current state)- geometric price formation along with its volume and volatility over a given time period and using that information to predict the future state- future price movement.

Buy Signal: 187.07 #stocksIngenuity Trading Model
Geometric Markov Model : In probability theory, a Markov model is a stochastic model used to predict randomly changing systems. Markov Models are used in all aspects of life from Google search to daily weather forecast. The randomly changing systems we focus on are the equity, futures, and forex markets. The geometric element of the model is the fractal wave structure you can find on any chart you look at across any market and across all time dimensions.
Our model focuses on the current wave formation (current state)- geometric price formation along with its volume and volatility over a given time period and using that information to predict the future state- future price movement.

Sell: 117.25Ingenuity Trading Club-
Geometric Markov Model : In probability theory, a Markov model is a stochastic model used to predict randomly changing systems. Markov Models are used in all aspects of life from Google search to daily weather forecast. The randomly changing systems we focus on are the equity, futures, and forex markets. The geometric element of the model is the fractal wave structure you can find on any chart you look at across any market and across all time dimensions.
Our model focuses on the current wave formation (current state)- geometric price formation along with its volume and volatility over a given time period and using that information to predict the future state- future price movement.


DJI:Short, Historic "sine"More of an idea which progressed into a timeline of the market in respect to DJI. Historic indicators showing sell indicated by the trough and peak of the sine wave overlay. Historically interesting where we find the horizon or 0 point of the wave. Major transitions overlay this period as we can see the massive accumulation of debt begins to inflate the market. This economic transition is marked by the launch of Sputnik, our landing on the moon, adoption of FIAT. Many significant economic events cement the future during this time period. Coupled with the rapid growth of the FIAT backed market there is a direct correlation with the 10 year bond yield which indicates the devaluation of this standard of currency backed by speculation and debt.
The scale was personally staggering when observing as both a timeline and as an indication of market movement on massive scale.

