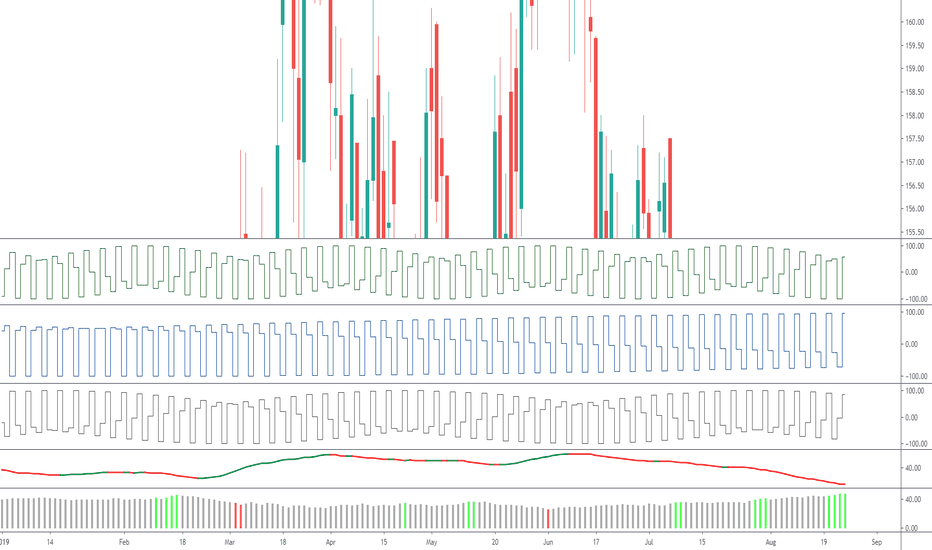
Sine Wave
VISTA OUTDOORS INC (VSTO) WeeklyDates in the future with the greatest probability for a price high or price low
Bitcoin SV - Still the same picture.Quick BSV update.
Im still expecting the move up to break 328 before we drop to the 235 (maybe below) level. Nothing has changed just the current smaller corrective pattern.
It actually looks a little clearer now. I am also doing video updates on Streamanity. but I need to check with the TV guys if I can post.
GBPUSD Bearish Phase Point Towards The 1.3100 Price Range.Technical Analysis:
GBPUSD price retracement priced at 1.33/35 level, a Short entry range.
GBPUSD immediate short phase target priced at 1.318 in subsequent trading days.
GBPUSD price successfully breached the 1.338 yearly resistance to test the 1.35 higher high last week.
GBPUSD MACD indicator signals a diminishing bull volumes as price bull momentum slows in pace.
Lemon Drops. Testing the CLAM IndicatorThis Candle Length Average Multi-timeframe (CLAM) indicator started as an experiment to try to filter out market noise and spot signals others are missing. Understanding exactly what it is showing is a work in progress.
The histogram is plotting a fast trend of candle lengths, positive or negative.
It is an average of open-close cross using the triple-ema (TEMA) weighted against higher timeframes.
The calculation is similar to Know Sure Thing (KST), only using open-close (candle length).
Histogram below the centerline means candles are mostly down candles.
Histogram often stays below centerline for 4-5 down spikes, then it makes its way back up through.
Before each downtrend starts, there are these spikes (highlighted in yellow).
In an uptrend, the last spike up appears to be the highest. Count them.
In a downtrend, the first spike up is probably the highest.
Bottoms will also show up the same way.
Confirm using other indicators and price history.
Another TEMA average of the histogram produces a line that changes color from lime to grape.
When the line is lime, and the price is not going up much (divergence), it indicates resistance.
Conversely, when the line is grape, and the price is not going down much, it's a signal of support.
A break or bounce off of support or resistance tends to follow the current longer-term trend, up or down.
The line color does not mean the price will go up or down. It merely shows the candle length trend.
Trends in candle length do seem to reveal or serve as a reminder of potential trend direction changes.
During a flat or ranging trend, the line and price track each other well.
During steep trends, up or down, the signals are not as reliable, but could be useful to spot weakness.
Facing Reality. Bitcoin's long-term, seasonal sine wave.Something in the chart has been signaling that BTC is going down in spite of the hype. It seemed reasonable that it might bounce back, at least to 9K. Now the outlook doesn't even look that good. On the one hand, it would be nice for the promoters to exit on a bounce. To go short from higher up. But there is no need to mislead everyone.
Halving, news, indicators, the seasonal variation, as smooth as a deep ocean wave. It's all priced in. Efficient market hypothesis. Overanticipated. Overhyped. And ultimately overpriced.
The curve is so smooth and natural. It's surprising how it escaped being noticed for such an extended duration.
Do you think BTC will break a year-long curved trend just for us? Today?


