SLB: Schlumberger updateIt seems SLB is at good valuation now, but a risk in dropping international revenue still need to be figured out.
if this can be solved, then SLB is good to go.
Disclaimer: This content is NOT a financial advise, it is for educational purpose only.
SLB

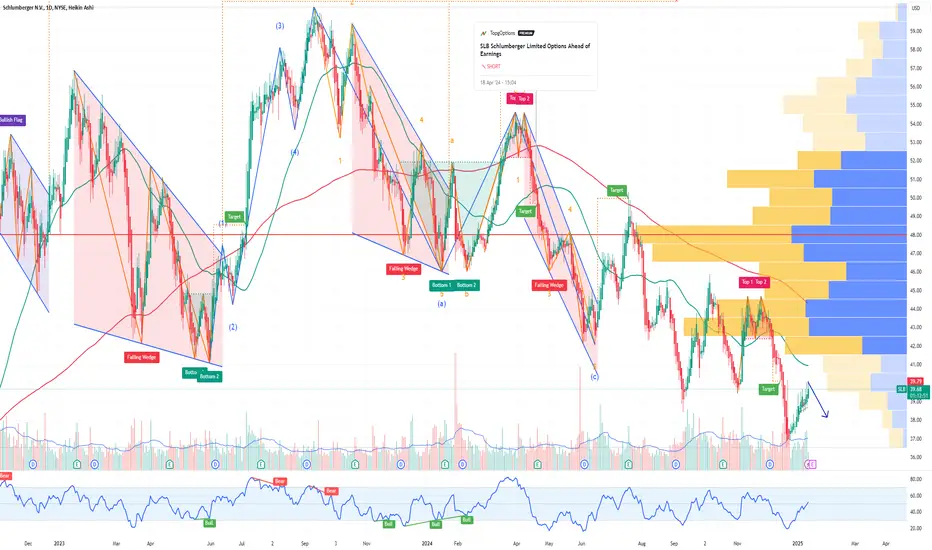
SLB Schlumberger Limited Options Ahead of EarningsIf you haven`t sold SLB before the previous earnings:
Now analyzing the options chain and the chart patterns of SLB Schlumberger Limited prior to the earnings report this week,
I would consider purchasing the 27.50usd strike price Puts with
an expiration date of 2026-3-20,
for a premium of approximately $2.01.
If these options prove to be profitable prior to the earnings release, I would sell at least half of them.

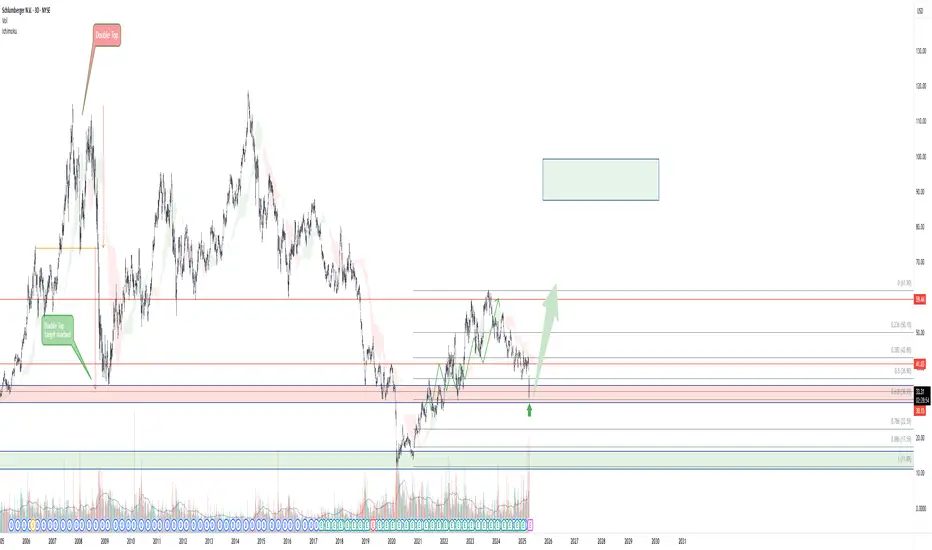
SLB: Bounce Loading or Basement Dive?After tagging my target around $60, SLB (Schlumberger) has been chillin’ in consolidation mode for a while now. We’re sitting on a solid support zone, and honestly, the odds of a bounce look better than a full-on dump here. Textbook vibes too—Fibo 0.618 lands right around $31, which lines up perfectly if this is where it decides to base out.
If we do get the bounce, next stop could be in the $90–$95 range. 🚀 On the flip side though… if this thing keeps bleeding, we might not see a floor until the $20–$22 area.
I’ve got a position, so here’s to hoping we take the high road! 🤞Good luck out there!
SLB Schlumberger Limited Options Ahead of EarningsIf you haven`t sold the Double Top on SLB:
Now analyzing the options chain and the chart patterns of SLB Schlumberger prior to the earnings report this week,
I would consider purchasing the 40usd strike price Puts with
an expiration date of 2025-6-20,
for a premium of approximately $3.17.
If these options prove to be profitable prior to the earnings release, I would sell at least half of them.
SLB 5M Daytrade Long Aggressive CounterTrend tradeAggressive CounterTrend trade
- short impulse
+ support level
- unvolumed T1 level
+ volumed 2Sp-
- weak test closed below T1
+ first bullish bar closed entry
- target beyond 5M / 1H range
Calculated affordable stop limit
1 to 2 R/R take profit expandable to swing / investment trade
1 Hour CounterTrend
"- short balance
+ expanding ICE
+ support level
+ biggest volume manipulation"
1 Day Trend
"+ long impulse
+ SOS test level
+ support level
+ 1/2 correction"
1 Month Trend
"+ long balance
+ expanding ICE level
+ support level
+ 1/2 correction
+ volumed manipulation"
Sell SLB Limit 44.54, GTC
Sell SLB Stop 42.29 LMT 43.06, GTC

SLB 5M DayTrade Long Aggressive CounterTrend tradeAggressive CounterTrend trade
- short impulse
- unvolumed T1 level
+ volumed Sp?
+ support level
+ weak test
+ first bullish bar closed entry
Calculated affordable stop limit
1 to 2 R/R take profit
Hourly context
"- short impulse
+ volumed T1 level
+ support level
+ 1/2 correction"
Daily context
"+ long impulse
+ above JOC SOS level?
+ support level
+ 1/2 correction"
Monthly context
"+ long balance
+ expanding ICE level
+ support level
+ 1/2 correction
+ volumed Sp"
SLB @NYSE
Sell Limit 48.70, GTC
Sell Stop 47.68 LMT 48.03, GTC

SLB Schlumberger Limited Options Ahead of EarningsAnalyzing the options chain and the chart patterns of SLB Schlumberger Limited prior to the earnings report this week,
I would consider purchasing the 54usd strike price in the money Puts with
an expiration date of 2024-4-19,
for a premium of approximately $3.10.
If these options prove to be profitable prior to the earnings release, I would sell at least half of them.

SLB Set To Acquire ChampionX, Return $7 Bln To ShareholdersNYSE:SLB , formerly known as Schlumberger, has announced plans to acquire ChampionX ( NASDAQ:CHX ), a leading provider of chemistry solutions and drilling technology. The acquisition, coupled with a substantial $7 billion shareholder return plan, signals SLB's commitment to driving growth and delivering value to its investors in the years to come.
The all-stock transaction, unanimously approved by ChampionX's board of directors, will see ChampionX shareholders receiving 0.735 shares of NYSE:SLB common stock for each NASDAQ:CHX share they own. Upon completion of the deal, ChampionX shareholders will own approximately 9% of SLB's outstanding common stock, underscoring the scale and significance of the acquisition.
Houston-based SLB anticipates significant synergies from the merger, with annual pretax benefits of approximately $400 million expected in the first three years post-closing. These benefits will be derived from a combination of revenue growth and cost savings, further enhancing SLB's competitive position in the market.
The transaction is subject to regulatory approval and the green light from ChampionX shareholders, with NYSE:SLB aiming to finalize the deal before the end of 2024. Additionally, SLB has announced plans to return $7 billion to shareholders over the next two years, reaffirming its commitment to maximizing shareholder value and enhancing returns.
Goldman Sachs has expressed confidence in SLB's prospects, adding the stock to its Conviction List and maintaining a buy rating. This move reflects the firm's bullish outlook on SLB's growth trajectory and strategic initiatives.
The acquisition of ChampionX follows SLB's recent agreement to purchase a majority stake in Aker Carbon Capture, further expanding its portfolio and strengthening its position in the energy sector. With ACC set to own 20% of the combined entity, SLB's acquisition strategy is aimed at bolstering its capabilities and diversifying its offerings to meet the evolving needs of the industry.
On the stock front, NYSE:SLB saw a slight easing of 1% following the announcement, while ChampionX shares surged by 10.4%. Both companies have been consolidating since early 2023, with SLB's stock showing a promising trajectory towards a potential breakout point. With West Texas Intermediate oil prices trading above $85 for the first time since October, the industry outlook appears favorable, providing a tailwind for SLB's growth prospects.
As NYSE:SLB embarks on this transformative journey, the acquisition of ChampionX and the robust shareholder return plan underscore the company's vision and commitment to driving sustainable value creation. With a solid foundation and a strategic focus on innovation and efficiency, SLB is well-positioned to capitalize on emerging opportunities and deliver long-term value for its shareholders.

Shlumberger - SLB LongA failed dragon turned into a beautiful falling 3 drives pattern with bullish divergence all happening at a long respected demand line.
Easy trade to size up risk on, again never know what will happen.
Unfortunately this is one again that we took and posted in the community two weeks ago. It would be equitable now if you played it to the high or third target.

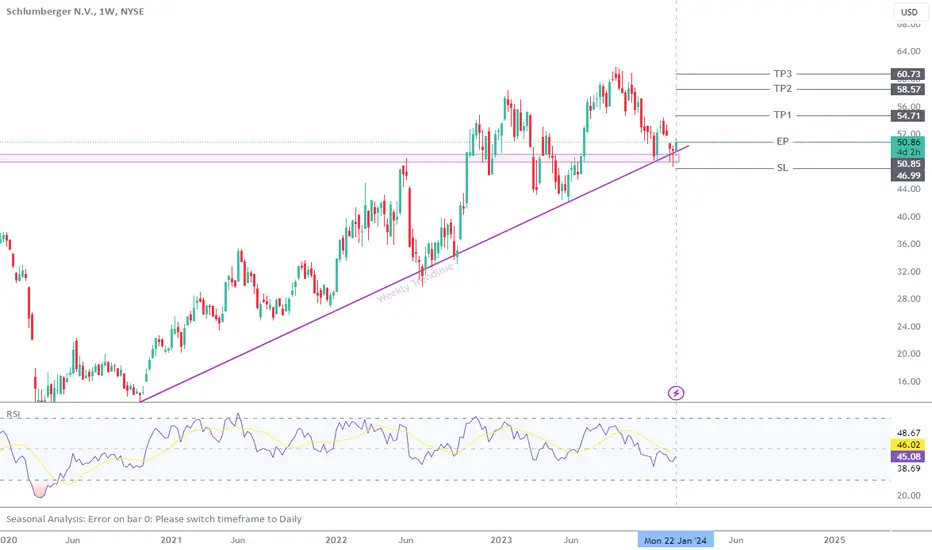
SLB Potential Buy setupReasons for bullish bias:
- Price respected strong trendline
- Hammer candle formation on the support
Entry Level: 50.85
Stop Loss Level: 46.99
Take Profit Level 1: 54.71
Take Profit Level 2: 58.57
Take Profit Level 3: 60.73
Schlumberger's Stellar Performance in 2023: Key Highlights
Schlumberger Limited (NYSE: NYSE:SLB ), a world-renowned oilfield services provider, has concluded a remarkable year, surpassing analysts' estimates for quarterly profit and showcasing robust growth in its international business. Despite geopolitical uncertainties and regional tensions, NYSE:SLB 's CEO, Olivier Le Peuch, remains optimistic about the company's future prospects. Let's delve into the key highlights of SLB's impressive fourth-quarter and full-year performance.
Global Expansion and International Growth:
Schlumberger's success in recent years can be attributed to the rising demand for its oilfield services and equipment, particularly in international markets. The company has experienced substantial growth in regions such as the Middle East, Angola, and Central and East Africa, driven by increased oil exploration and production activities.
In the face of geopolitical challenges, including the conflict in Gaza and attacks on ships in the Red Sea, NYSE:SLB has demonstrated resilience. The company reassures investors that it does not anticipate a significant impact on its Middle East business, emphasizing its commitment to sustained growth in the region.
Record Investment Levels and Geographic Opportunities:
NYSE:SLB anticipates record investment levels in the Middle East extending beyond 2025, underlining the company's strategic focus on this vital market. Additionally, opportunities for continued offshore activity are identified in key regions such as Brazil, West Africa, the Eastern Mediterranean, the Middle East, and Southeast Asia. Le Peuch's optimistic outlook positions Schlumberger as a global leader with a proactive approach to capitalizing on emerging opportunities.
Financial Highlights:
Schlumberger reported robust financials for the fourth quarter and the full year of 2023. Quarterly revenue increased by 8% sequentially and 14% year on year, reaching $8.99 billion. Full-year revenue showed a remarkable 18% year-on-year growth, totaling $33.14 billion. Notably, the acquisition of a subsea equipment business contributed significantly to the quarter's sequential revenue gain.
The company's CEO highlighted the impressive growth in earnings per share (EPS), excluding charges and credits, which increased by 10% sequentially and 21% year on year, reaching $0.86 in the fourth quarter. Adjusted EBITDA margins also achieved another cycle high, showcasing the company's operational efficiency.
Strategic Moves and Shareholder Returns:
In a move that demonstrates confidence in its financial position, Schlumberger announced a 10% increase in its quarterly cash dividend, now standing at $0.275 per share. The company also plans to boost share repurchases in 2024, signaling its commitment to delivering value to shareholders.
Conclusion:
Schlumberger's exceptional performance in 2023 solidifies its position as a resilient and forward-thinking player in the oilfield services sector. Despite challenges in the global landscape, the company's strategic initiatives, robust financial results, and optimistic outlook on key markets position it for continued success in the years to come.

SLB Schlumberger Limited Options Ahead of EarningsAnalyzing the options chain and the chart patterns of SLB Schlumberger Limited prior to the earnings report this week,
I would consider purchasing the 61usd strike price Calls with
an expiration date of 2023-11-3,
for a premium of approximately $1.69.
If these options prove to be profitable prior to the earnings release, I would sell at least half of them.
Looking forward to read your opinion about it.

SLB ShortThis trade has a pattern on M15 and is with the trend, there is a lot of resistance for this short and the stop loss should be above 60.5. There are multiple tops on M15 and M30 with divergence.

$SLB : outperforming stock in strong sectorSLB consolidating inside an ascending triangle with possible breakout to ATH (all time high) levels above $56
Shrinking Volumes with price in consolidation showing base formation for breakout to higher levels
SLB is an outperforming stock in a strong sector $SPN

Oil & Gas Services is the leading industry $XESWho else is waiting for this breakout to happen?
If it does, a good target would be $125 and I like the odds.
Just look at NYSE:SLB , NYSE:RIG & NYSE:HAL , they have already broke out from there bases.
Look for other stocks within this ETF and you will find good set ups. I'm doing it.
NYSE:WHD & NYSE:NOV are near pivot points.

Going long in Schlumberger SLBHello Traders
Schlumberger SLB - NYSE.
Broadening Wedges Ascending
Trend : Upward.
Formation : Broadening Wedges Formation (In Progress)
Possibility : Bullish continuation
Probability to hit tragedy: 69.00%
Trade Plan.
Long / Buy Trade.
Entry Level above the red support line @ 46.17
Take Profit - Below the 4 hour support zone @ 61.50
Stop Loss at the support level red line @ 41.80
Trail Stop loss on support level as trade progresses.
TP = Total PIPS in gain = 15.33 Profit 33.37%
Total PIPS in Stop loss = 4.37 Loss 10.94%
Regaards,

10/30/22 SLBSchlumberger N.V. ( NYSE:SLB )
Sector: Industrial Services (Oilfield Services/Equipment)
Market Capitalization: 71.538B
Current Price: $50.45
Breakout price trigger: $52.50
Buy Zone (Top/Bottom Range): $51.00-$47.40
Price Target: $61.20-$62.40
Estimated Duration to Target: 56-60d
Contract of Interest: $SLB 12/16/22 55c
Trade price as of publish date: $1.63/contract


$SLB Swing TradeSLB Swing Trade - Grade A
Strategy Description
• Solid earnings + Reaction
• In a very strong sector (XLE)
• Huge daily level with not much resistance until higher up
Market Big Picture
• SPX favors the upside until we break below 3638.
• Energy plays tend to diverge from SPX, so this is a comfortable swing even if the market is dying and breaks below 3638.
Intraday Fundamentals
• SLB Earnings were rock solid and the stock was up 2.7% premarket + 8% on the day
Long Term Technicals
• SLB is approaching a massive daily level at 49.83 which if broken successfully with the earnings tailwind, can see 52.94, 59.25, 63.31
⚒️ Instrument ⚒️
SLB 12/26/22 - 50C @ 3.3
🎯Targets: 52.94, 59.25, 63.31
🩸Stop: Close below 46.69 on the daily

#SLB Base and undercut formingObserving that #SLB is forming a base and with an undercut with quick recovery. Noted that similar happened before,

$DBX $LIT $AMD $SLB I OptionsSwing WatchlistDBX 1D I DBX is breaking out from a possible bull flag on the daily after rumors that it was approached a month ago in attempts to be acquired by another company.
LIT 1D I Energy stocks and lithium stocks in general have been overperforming the market for the past two weeks. Watching for a breakout from this downtrend.
AMD 1D I AMD is forming a possible bear flag on the daily time frame. We have resistance near $110 and support close to $106. AMD is breaking out from a downtrend.
SLB 1D I SLB has been holding $46. Energy stocks keep on outperforming the market, and I've seen bullish trades on some energy stocks like SLB MRO among others.

SLB Cycle Reset, Recovery Within ChannelAn idea for SLB that shows three areas in red, green, yellow (3,2,1 Respectively)
We are currently experiencing a situation that is very similar to the area in red.
A recovery back into the channel and further upwards is possible if this pattern continues to repeat itself.

exposure to higher oil prices..!Entry: the opening price
Stop loss: closing below 36.6
Reward/Risk:
Target range: 48-50
Time Frame: 4-12wks
Possible gain: 25-30%
Possible loss: 5-7%
Position size: 5 % of trading capital
You can see the most important support(green line) and resistance (red line) levels.
Best,
Dr. Moshkelgosha M.D
DISCLAIMER
I’m not a certified financial planner/advisor, a certified financial analyst, an economist, a CPA, an accountant, or a lawyer. I’m not a finance professional through formal education. The contents on this site are for informational purposes only and do not constitute financial, accounting, or legal advice. I can’t promise that the information shared on my posts is appropriate for you or anyone else. By using this site, you agree to hold me harmless from any ramifications, financial or otherwise, that occur to you as a result of acting on information found on this site.
