$SLB — ShortEnergy has been on an absolute tear lately but it can't rise to the sky.
It is very overbought according to the oscillators and RSI.
I also am eyeing that open gap which lines up right with the 0.50 fib channel retracement level.
SLB

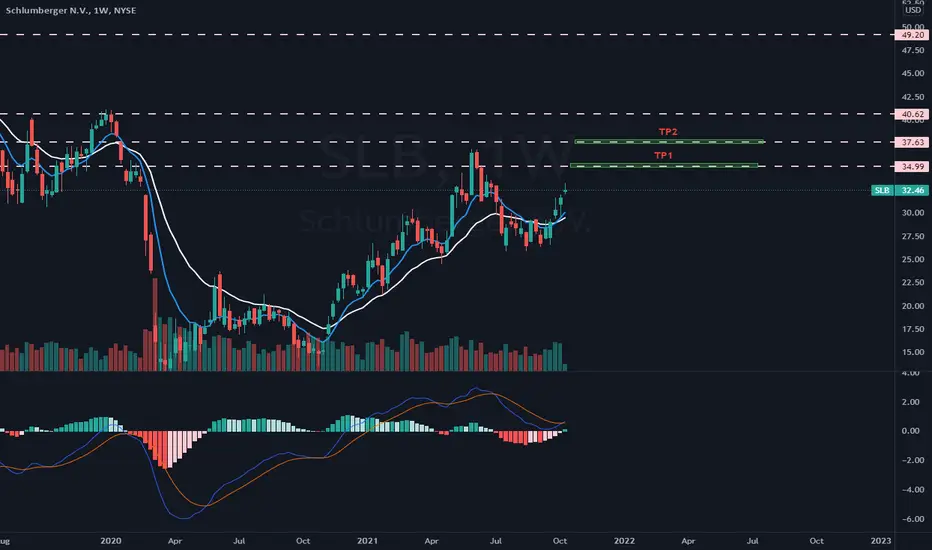
SLB Oil Double Top forming? The red line shows a lower high followed by a subsequent decline which is approaching the neckline of a double bottom formation.
If the neckline (dotted yellow) breaks then the theory goes that the decline should be equal to the distance between the peak and trough of the high and the neckline, as labelled on the chart by the profit target.
The decline could go on for a while but this price is closely tied to the price of oil so expect volatility, and in particular watch out for the earnings call - as a rule I do not want to be short during earnings call because the possible gap ups the next day can be devastating and take you way past your stop loss.
I'd enter my short at option 1 (diagonal neckline) or more conservatively option 2 across the horizontal break, and ideally only when the close is below the neckline, but its a matter of preference, some people prefer to trade the wick and short as soon as price crosses. I've been burned a fair few times on those false crosses so prefer to trade the close these days.
If the neckline doesn't break, well start looking for long entries...

Post 10/22 Q3 FY21' Earnings Analysis$AXP, $SAM, $HCA, $RF, $HON, $SLB
All major averages finished last week in the green to post a third straight week of gains - Dow closing at an ATH - Big name earnings reports continue to drive markets
$AXP - American Express - reported Q3 FY21' earnings of $2.27/share - beat estimates by 27.5%, bottom line increased 74.6% YoY - driven by growing revenues & strong segmental performances - partly offset by increasing costs
$SAM - Boston Beer - reported Q3 FY21' earnings of $2.97/share - missing estimates of $4.04 per share - compares to earnings of $6.10 per share a year ago - this quarterly report represents an earnings surprise of (26.49%)
A quarter ago, it was expected that this brewer would post earnings of $7 per share when it actually produced earnings of $4.72 - delivering a surprise of (32.57%) - over the last four quarters the company has beat EPS estimates just once
$HCA - HCA Healthcare - reported Q3 FY21' earnings of $4.57/share - beat estimates of $4.10/share - compares to earnings of $1.92 per share a year ago - this quarterly report represents earnings surprise of 11.46%
$RF - Regions Financial - reported Q3 FY21' earnings of $0.66/share - beat estimates of $0.53/share - the bottom line compares favorably with the prior-year quarter’s $0.49 - results were driven by a strong capital position, & a rise in deposit balances provided some respite - benefit from credit losses was a tailwind - lower revenues & rising expenses were major drags
$HON - Honeywell International - earnings were $2.02/share - beat estimates of $2.01/share - bottom line soared 29.5% YoY - revenues were $8,473 million - missing the consensus estimate of $8,708M - top line increased 9% YoYr on a reported basis - rise was driven by strength in warehouse & workflow solutions, productivity solutions & services, & gas analysis businesses along with strong demand for building products as well as process solutions services and thermal solutions - also supported by a recovery in commercial aftermarket demand & solid growth in business & general aviation original equipment demand
$SLB - Schlumberger - announced Q3 FY21' earnings of $0.36/share - in line with estimates - bottom line increased significantly from the year-ago quarter’s profit of $0.16 - total revenues of $5,847M - missed estimates of $5,940M but improved 11% from the year-ago quarter’s $5,258M - earnings were aided by a surge in stimulation activity in Argentina, stronger North American rig activity along with ramped up drilling operations at offshore & onshore international resources - this was offset by lower contributions related to Digital & Integration from Europe/Africa

Long | SLBNYSE:SLB
Possible Scenario: LONG
Evidence: Price Action. fill the gap
TP1: 35$
TP2: 37.5$
Call options, Strike 35$, 01/21/2022
*This is my idea and could be wrong 100%
SLB Technical Analysis SLB could have possibly went through ABC correction and now has potential for the upside. Indicators looking good and also It has broke through the resistance trend line, however, it could possibly retest it. Watch out for $30 price break.


Black Gold is not doneBlack Gold finally broke out from the 3 month cup handle pattern as mentioned last week! Although weekly chart was showing bearish, it was a bullish flag because the lows never broke. This week the momentum continues upward possibly in a big way. Extremely Bullish! Once it breaks 56.75, 59 will be the next target. XOM, SLB, NOV are yummy plays.

go long OIHAfter almost 7 years of bearish price action, oil services will be essential in the transition to electric vehicles and clean energy. Most automakers are shooting for 2025 to have an entire EV fleet or mostly EV fleet. That's a 4-7 year runway for a bull run; assuming that it will take time to transition and for all automakers to be on the same page. Freight and travel will only increase with time further improving demand for oil and oil services.
Tom Lee from Fundstrat gave this oil services ETF a price target of $740 if oil hits $80 a barrel which seems extremely likely with the macroenvironment. Playing this trend through an ETF is the safest way to play it because you are taking out the idiosyncratic risk of being tied solely to a single company.
The top ten holdings of OIH are:
SLB: 22.46%
HAL: 13.21%
BKR: 5.84%
FTI: 5.22%
CHX: 4.97%
TS: 4.63%
LBRT: 4.57%
NOV: 4.37%
HP: 4.13%
RIG: 4.00%
Weekly Chart:
Daily Chart with Golden Cross:

Keep on Watchlist.Please note this is only an idea, invest at your own risk.
Currently sitting/fighting a key level of resistance/support at around 31/32.
I would like to see it form a good base and stabilize around this level.
If it surpasses next resistance of previous swing high, at around 34, then I would consider it a good entry point up until 40.
The opening of the economy and summer might have a positive influence on it, so expect moves around these key levels within the next few weeks.
Happy to get feedback on my idea.

I believe that Gold is gonna blow off then jump down.This is an early development but, I believe that since GOLD is in a downward trend in the short term, a breakout will occur but then once it reaches to 1950s, then I expect a drop-down or a continued up. Just a theory. The RSI is in the normal territory, which does not signal it is a blow-off or a blowdown but check the coming days and then see if an up is made or a down is amde. Warning! I am not a financial adviser and take this with a grain of salt. Happy trading!

Earnings spike: SLBThe volatile spike on earnings at a key retracement level on NYSE:SLB triggered a long setup to retest the high.


SCHLUMBERGER Rare Investment Opportunity.SCHLUMBERGER, monthly timeframe: Mirror level + Harami + Side of Bollinger bands + Oversold + Divergence + Great discount

THE WEEK AHEAD: UAL, DAL, SLB, WBA EARNINGS; XOP, SLV, QQQEARNINGS:
There are four options highly liquid underlyings that pop up on my screener for next week with 30-day implied of >50%: UAL (23/88/22.6%)* (on Wednesday after market close); DAL (13/74/19.1%) (Tuesday before market open); SLV (18/59/16.4%) (Friday, before market open), and WBA (43/54/12.2%) (Thursday, before market open).
Pictured here is a directionally neutral 29/50 short strangle in the November monthly with the options camped out at the 16 delta, yielding a 2 x expected move break even on the put side and > 2 x expected move on the call. Delta/theta -.41/6.00; paying 1.87 at the mid price as of Friday close (.94 at 50% max).
The DAL November 20th, 16 delta 27/42 short strangle was paying 1.83 at the mid price as of Friday close; delta/theta 1.48/4.39.
SLB is small enough to short straddle, but would go "skinny," as the November only has 2.5 wides to play with. The November 20th 15/17.5 was paying 1.48 as of Friday close, but treating it as a short straddle and taking profit at 25% max (.37) isn't particularly compelling, so would probably pass on the play and deploy buying power elsewhere.
WBA suffers from a similar affliction (2.5 wides out in November), but the 32.5/40 is paying 1.54 there, albeit with break evens greater than the expected move, but not quite 2 x.
EXCHANGE-TRADED FUNDS RANKED BY PERCENTAGE OF STOCK PRICE THE NOVEMBER AT-THE-MONEY SHORT STRADDLE IS PAYING AND SCREENED FOR THOSE PAYING >10%:
XOP (15/56/14.5%)
SLV (45/51/13.1%)
GDXJ (15/49/12.9%)
EWA (15/42/11.6%)
XLE (27/43/11.2%)
GDX (15/40/10.7%)
XBI (29/43/10.3%)
USO (4/43/10.1%)
BROAD MARKET RANKED BY PERCENTAGE OF STOCK PRICE THE NOVEMBER AT-THE-MONEY SHORT STRADDLE IS PAYING:
QQQ (28/33/8.2%)
IWM (25/32/7.6%)
SPY (19/25/5.9%)
EFA (13/20/4.8%)
DIVIDEND PAYERS RANKED BY PERCENTAGE OF STOCK PRICE THE NOVEMBER AT-THE-MONEY SHORT STRADDLE IS PAYING AND SCREENED FOR THOSE PAYING >10%:
KRE (25/44/11.7%)
EWZ (15/42/11.6%)
XLE (27/43/11.2%)
GENERAL MUSINGS:
I already have a UAL covered call on, so am unlikely to partake in that underlying further here. Moreover, in the IRA/retirement account, I'm already deployed in everything at the top of the heap from an implied volatility standpoint, although I may carry on with my standard weekly 16-delta short put in the broad market instrument with the highest implied volatility, which would be QQQ. Alternatively, I'll do a QQQ 10-percenter (See Post Below) instead, as NDX isn't fantastically liquid, and a November 27th (currently, 48 days until expiry) will be available. To emulate a 50-wide, however, in NDX, I'll have to go 10-wide with 5 contracts or 5 wide with 10, etc. For example, the November 27th 240/245 is paying .50, and I'd have to sell 10 of those to emulate the NDX November 27th 9925/9975, paying 5.04. I would naturally prefer just selling one NDX spread, since it means fewer fees, but if the bid/ask is grotesque, I'll just have to go with QQQ or a RUT 50 wide. (The RUT November 27th 1385/1435 was paying 5.04 at the mid as of Friday close).
* -- The first metric is the implied volatility rank (where implied volatility is currently relative to where it's been over the last 52 weeks); the second, 30-day implied volatility; and the third, what the November at-the-money short straddle is paying as a percentage of stock price.


Who Passed The Gas ?winter coming up, Natural Gas spot has already broken out - NGS appears to be lagging, presents a good long opportunity
low liquidity/ low market cap adds to the risk reward balance
The guys on TIP The Investor's Podcast typically have good calls, look at the BBBY returns (from $9.00)


Long at 32-33Not confirmed abt 45+ long term but 40+ sure confirmed game. Let RSI move down lit bit more and touch yellow line. Then go long


OIH about to lift off SLB and HAL 2 examples of top holdings. It's time for the down trend pressure to end for now. This is a slow moving sector and most all stocks in this space gaped lower after last earnings. Time to create a shopping list if dip buyers show up.
