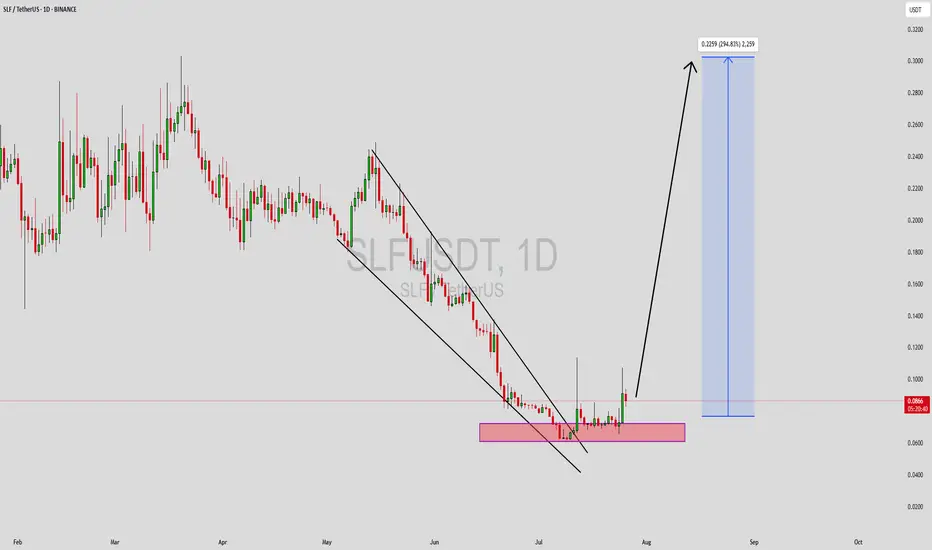
SLFUSDT Forming Falling WedgeSLFUSDT is currently exhibiting a classic falling wedge pattern, a bullish formation that typically signals a potential trend reversal. The narrowing of the wedge, combined with consistent price compression and higher lows, indicates that sellers are losing control while buyers begin to step in. This pattern often results in a strong breakout to the upside, and given the current structure, SLF is poised for a potential explosive move.
Volume levels remain healthy, which reinforces the likelihood of an impending breakout. Increased trading activity at support zones shows that investors are accumulating, anticipating a shift in momentum. Historically, falling wedges with strong volume confirmation have led to aggressive rallies, and in SLF’s case, analysts are expecting gains in the range of 190% to 200%+. This aligns well with both technical and psychological targets on the chart.
The market sentiment around SLFUSDT is turning increasingly positive as the project garners more attention in crypto communities. With on-chain metrics improving and social mentions growing, SLF is being recognized as a potential breakout play. If the price breaks out of the wedge and flips resistance into support, a sharp rally could follow—making it one of the high-reward setups currently in the altcoin market.
Traders should watch for a decisive breakout candle backed by rising volume, which could be the key confirmation to enter this trade. The structure is well-formed, investor interest is rising, and all technical indicators point toward an upcoming bullish move.
✅ Show your support by hitting the like button and
✅ Leaving a comment below! (What is You opinion about this Coin)
Your feedback and engagement keep me inspired to share more insightful market analysis with you!
SLFUSDT
FLS (SPOT)BINANCE:SLFUSDT
#SLF/ USDT
Entry (0.080 - 0.088)
SL 4H close below 0.0756
T1 0.100
T2 0.120
T3 0.147
Extra Target
T4 0.165
_______________________________________________________
Golden Advices.
********************
* collect the coin slowly in the entry range.
* Please calculate your losses before the entry.
* Do not enter any trade you find it not suitable for you.
* No FOMO - No Rush , it is a long journey.

SLFUSDT Forming Falling WedgeSLFUSDT is showing an impressive technical setup that’s catching the attention of traders and investors alike. The crypto pair has formed a clear falling wedge pattern, which is known to be a bullish reversal pattern in technical analysis. This suggests that a breakout to the upside could be imminent, opening the door for a potential gain of 240% to 250%+. With volume looking strong and steady, this pattern gains even more significance, indicating that a major shift in market sentiment could be underway.
Many traders look for falling wedge patterns because they often signal the end of a downtrend and the beginning of a new bullish phase. SLFUSDT’s price action aligning with this pattern makes it a high-probability setup for swing traders and long-term holders who want to position themselves early. The crypto market’s current momentum adds further confidence that once the breakout confirms, a powerful price rally could take shape, rewarding patient investors.
It’s worth noting that investor interest in this project is growing, with more eyes turning towards SLFUSDT as it holds a promising use case and potential for future development. A breakout from this falling wedge could also attract new capital inflows, pushing prices even higher. Traders should watch for strong volume spikes and sustained price action above key resistance levels to confirm the bullish reversal. With the right market conditions, SLFUSDT could outperform many other altcoins this cycle.
✅ Show your support by hitting the like button and
✅ Leaving a comment below! (What is You opinion about this Coin)
Your feedback and engagement keep me inspired to share more insightful market analysis with you!

Technical analysis of $SLF asset: growth prospectsAt the moment SLF asset demonstrates quite promising dynamics, which is confirmed by a number of technical signals. Price trading in the green range (the area of positive dynamics) indicates stable demand and confidence of market participants in the growth potential of the asset.
One of the key factors is the price consolidation above the exponential moving average (EMA 50). This indicates a change of the short-term trend to an upward one and can be considered as a signal for further strengthening of positions. In addition, the support from the EMA 50 acts as a dynamic level, which reduces the probability of a significant pullback.
In terms of analyzing Fibonacci levels, the current market structure also provides interesting opportunities. If we consider the correction from the previous move, the nearest upside target is at 0.55 USD, which corresponds to 1.618 on the Fibonacci scale. This level historically acts as a point of attraction for price movements and may become a logical target for the current trend.
Alex Kostenich,
Horban Brothers.

SLF BINANCE:SLFUSDT
SLF / USDT
4H time frame
analysis tools
____________
SMC
FVG
Trend lines
Fibonacci
Support & resistance
MACD Cross
EMA Cross
______________________________________________________________
Golden Advices.
********************
* Please calculate your losses before any entry.
* Do not enter any trade you find it not suitable for you.
* No FOMO - No Rush , it is a long journey.
Useful Tags.
****************
My total posts
www.tradingview.com

IDUSDT UPDATEIDUSDT is a cryptocurrency trading at $0.3183. Its target price is $0.5000, indicating a potential 50%+ gain. The pattern is a Bullish Falling Wedge, a reversal pattern signaling a trend change. This pattern suggests the downward trend may be ending. A breakout from the wedge could lead to a strong upward move. The Bullish Falling Wedge is a positive signal, indicating a potential price surge. Investors are optimistic about IDUSDT's future performance. The current price may be a buying opportunity. Reaching the target price would result in significant returns. IDUSDT is poised for a potential breakout and substantial gains.
SLFUSDT: %500 VOLUME SPIKE | HUGE OPPORTUNITYSLFUSDT has experienced a 500% daily volume increase, indicating heightened interest. However, the price is declining rapidly, and buyers have not yet shown significant activity.
🔵 Demand Zones: The blue boxes on the chart represent potential areas for a price reaction.
📊 Entry Strategy: Monitor for upward breakouts in these zones on lower time frames before considering entries.
⚠️ Risk Management: Exercise caution and manage your risk carefully, as the market remains volatile.
Patience is crucial let the market confirm buyer activity!
Follow me for tracking the crypto volume spikes and trading points. You can see my accuracy below.
My Previous Analysis
🐶 DOGEUSDT.P: Next Move
🎨 RENDERUSDT.P: Opportunity of the Month
💎 ETHUSDT.P: Where to Retrace
🟢 BNBUSDT.P: Potential Surge
📊 BTC Dominance: Reaction Zone
🌊 WAVESUSDT.P: Demand Zone Potential
🟣 UNIUSDT.P: Long-Term Trade
🔵 XRPUSDT.P: Entry Zones
🔗 LINKUSDT.P: Follow The River
📈 BTCUSDT.P: Two Key Demand Zones
🟩 POLUSDT: Bullish Momentum
🌟 PENDLEUSDT.P: Where Opportunity Meets Precision
🔥 BTCUSDT.P: Liquidation of Highly Leveraged Longs
🌊 SOLUSDT.P: SOL's Dip - Your Opportunity
🐸 1000PEPEUSDT.P: Prime Bounce Zone Unlocked
🚀 ETHUSDT.P: Set to Explode - Don't Miss This Game Changer
🤖 IQUSDT: Smart Plan
⚡️ PONDUSDT: A Trade Not Taken Is Better Than a Losing One
💼 STMXUSDT: 2 Buying Areas
🐢 TURBOUSDT: Buy Zones and Buyer Presence
🌍 ICPUSDT.P: Massive Upside Potential | Check the Trade Update For Seeing Results
