Getting greedy with Klondike Silver - 10 Bagger incoming!Getting greedy with Klondike Silver - 10 Bagger incoming!
Klondike is setting up to become a 10 bagger in the coming months.
SLV

THE WEEK AHEAD: HAL, NFLX, AA, UAL EARNINGS; EWZ, XLE, SLV, IWMHIGHLY LIQUID OPTIONS SINGLE NAME EARNINGS (LISTED CHRONOLOGICALLY IN ORDER OF ANNOUNCEMENT AND SCREENED FOR >50% 30-DAY IMPLIED):
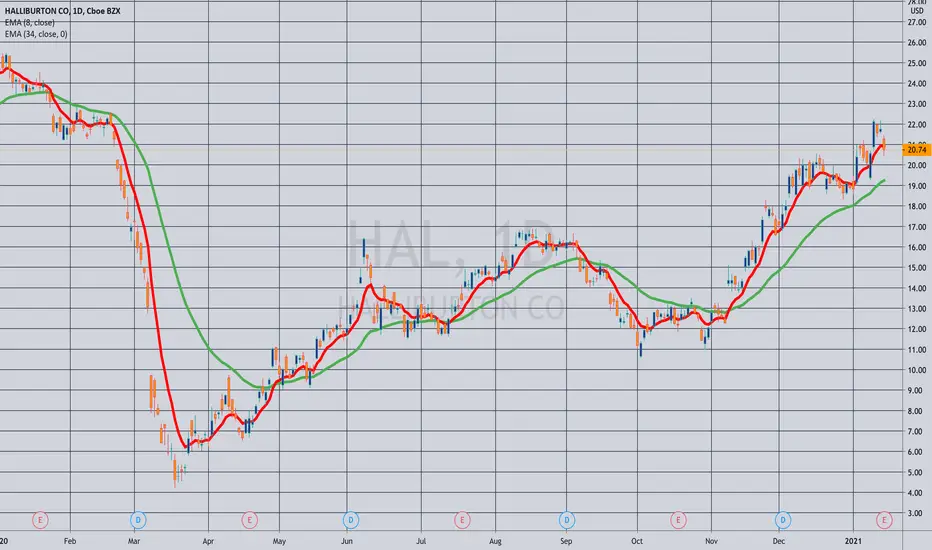
HAL (13/61/13.9%),* Tuesday, before market open
NFLX (25/50/11.3%), Tuesday, after market close
AA (18/69/15.9%), Wednesday, after market close
UAL (13/64/14.8%), Wednesday, after market close
From a bang for your buck perspective: AA ranks first, UAL, second, followed by NFLX, and HAL.
I already have a covered strangle on in UAL and don't anticipate putting on more single name risk in the IRA (which is my primary focus running into retirement), but will naturally post a play should I get into one.
EXCHANGE-TRADED FUNDS WITH >35% 30-DAY AND RANKED BY THE PERCENTAGE THE FEBRUARY AT-THE-MONEY SHORT STRADDLE IS PAYING AS A FUNCTION OF STOCK PRICE:
EWZ (18/45/10.3%)
XLE (23/42/9.7%)
SLV (25/42/9.4%)
GDX (12/38/9.2%)
XBI (18/37/8.7%)
KRE (16/36/8.7%)
EWW (15/36/7.5%)
I'm already in everything here but for KRE and EWW (the lowest bangs for your buck on the list) and the February monthly is a bit short in duration here for me (34 days) and March a tad long (62 days), so I may not do much this week in these, although going out to March with another rung in my GDX, SLV, and XBI positions isn't out of the question.
BROAD MARKET RANKED BY 30-DAY IMPLIED:
IWM (24/32/6.8%)
QQQ (22/30/6.4%)
SPY (16/24/4.8%)
DIA (13/23/4.6%)
EFA (14/20/3.8%)
In spite of the fact that IWM and/or RUT have the higher 30-day, I may look at adding a July (181 days) rung to the SPY short put ladder I have on in the IRA, targeting the strike paying at least 1% of the strike price in credit (which would currently be something like the 240), and do the kind of "opportunistic rolling" I've been doing with shorter duration rungs. (See Post Below). Although most frown upon going out this far in time, it's a way to deploy otherwise underutilized buying power that will earn something >0% while I work shorter duration setups or wait for a higher implied volatility environment and/or greater weakness. Additionally, my goals for the IRA are somewhat modest from a return on capital standpoint: I'm not looking to hit homers or be an incredibly attentive investor, opting for a once a week or even a once a month schedule of looking at things, making adjustments as appropriate, and/or taking off stuff approaching worthless that doesn't merit hanging onto due to the amount of time left in the contract.
* -- The first metric is the implied volatility rank or percentile (i.e., where the 30-day is relative to where it's been over the last 52 weeks); the second, thirty day implied; and the third, the percentage the at-the-money short straddle in the February monthly is paying as a function of stock price.
THE WEEK AHEAD: KBH, DAL, ICLN, SLV, EWZ, KRE, XLE, IWM/RUTEARNINGS:
There aren't a ton of earnings next week. Some financials are announcing, but I generally don't play those a ton for volatility contraction, since they never really frisk up that much, and all are below 50% 30-day implied here. KBH provides the best bang for your buck with the implied metrics I'm generally looking for (>50%), followed by DAL. Both, however, are at the low end of their 52-week range, in part due to the massive vol spike we experienced in March, which will make that metric somewhat misleading here.
KBH (18/56/14.5%),* Tuesday after market close.
DAL (7/53/12.9%), Wednesday before market open.
C (17/44/9.8%), Friday before market open.
JPM (14/32/7.8%), Friday before market open.
WFC (22/44/10.6%), Friday before market open.
EXCHANGE-TRADED FUNDS RANKED BY PERCENTAGE THE FEBRUARY 19TH AT-THE-MONEY SHORT STRADDLE IS PAYING AS A FUNCTION OF STOCK PRICE:
ICLN (14/79/20.0%)
SLV (31/48/11.3%)
EWZ (16/44/10.6%)
XLE (22/41/10.2%)
KRE (17/42/9.9%)
BROAD MARKET:
Pictured here is an IWM short put out in March at the strike paying at least 1% of the strike in credit. An IRA trade, I would look to roll up intraexpiry to lock in realized gain with >45 days 'til expiry, take profit on approaching worthless (<.20), and sell call against if assigned. Currently 67 days 'til expiry, it is understandably a bit long in duration, but I already have some on in the February monthly.
IWM (26/34/7.6%)
QQQ (21/31/6.9%)
DIA (14/24/5.2%)
SPY (11/24/5.0%)
EFA (14/21/4.7%)
* -- The first metric is the implied volatility rank or percentile (i.e., where implied is relative to where it's been over the past 52 weeks); the second, the 30-day implied volatility; and the third, what the at-the-money short straddle is paying as a function of the stock price.

Gold on 🔑 Support: Expecting bounce back above 1900 shartplyHi guys,
sharing my chart how i will play gold today. Happy trading!

Swing Trade: Barrick Gold Corp.(GOLD) breakout setup 📈Hi fellows, just one of my today swingtrades:
Nice setup for breakout .
------------------------Trade setup ---------------------------
Entry: 24,80
Stop Loss: 23,83
Profit target: 27.73
Time stop: 5 days
------------------------------------------------------------------
If you like the idea, do not forget to support with a 👍 like and follow.
Leave a comment that is helpful or encouraging. Let's master the markets together.

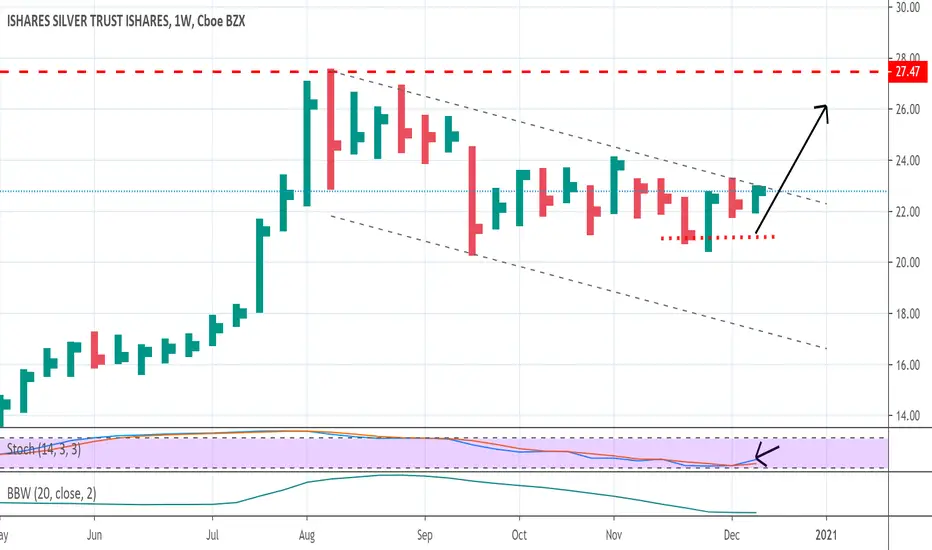
SILVER TRAINThis could be an important moment in silver. I prefer that the metal stay cheap but I fear we are about to run out of time before this train leaves the station.
What do you think will happen to SILVER over the next year or two?

SILJ Prime Junior Silver Miners ETF - BullishI feel like I am a little late to this party but there is a strong technical break out on this chart, cup and handle + RSI and MACD has room for more growth. I can see this easily get to $24-25 and if we break out of that then could easily end at $34-35.

$SLV in a massive bull flagWatch for the break of the bull flag on $SLV for more upside to $30
Excited to see the price action today


Silver - The Deal of a Century Silver can still go to $20-23 range but if that happens I am buying it with all of the AMMO that I have, even my wive's kitchen sink
Silver is EXTREMELY undervalued compared to any other asset out there. The biggest reason - JP Morgan is keeping it that way through a derivatives markets but I am sure those crooks are squeezing and accumulating. JPM stock will go up but Silver (when time comes) will absolutely leave Gold in the dust.
This could be the opportunity for everyone that missed Bitcoin rally. Pay VERY CLOSE ATTENTION to Silver. Do NOT miss it. Every dip should be bought like your life depends on it.
PS not a financial advice.

THE WEEK AHEAD: BBBY, MU EARNINGS; ICLN, SLV, XLE, IWM/RUTEARNINGS:
I've culled down all of next week's earnings announcements to options highly liquid underlyings where the 30-day is >50% and am left with two potential candidates for volatility contraction plays: BBBY (23/99/26.3%)* and MU (23/53/14.0%).
BBBY announces on Thursday before market open, so look to put on a play in the waning hours of Wednesdays session; MU, announces on Thursday after market close.
Pictured here is a delta neutral short strangle in the February cycle (49 days), which was paying 1.27 at the mid price as of Friday close with break evens wide of two times the expected move on the call side and slightly above the 2x on the put and delta/theta of -1.07/3.12. Naturally, you can see the call side skew here, with the similarly-delta'd short put 3.76 away from current price, but the call 7.24 away, so the underlying may merit a look at alternative plays that take advantage of this.
In contrast, the shorter duration January 15th 15/22.5 (14 days) was paying 1.02, with delta/theta metrics of .21/7.91, with the natural trade-off's being less room to be wrong, but a quicker resolution of the trade should you be right.
With MU, I'd look at a Plain Jane 2x expected move short strangle, which here would be the January 15th 68.5/85, paying 1.71 or the February 19th 62.5/90, paying 2.30.
EXCHANGE-TRADED FUNDS RANKED BY PERCENTAGE THE FEBRUARY 19TH AT-THE-MONEY SHORT STRADDLE PAYS AS A FUNCTION OF STOCK PRICE:
ICLN (9/51/15.0%)
SLV (33/48/13.6%)
XLE (23/41/11.4%)
XBI (27/39/11.2%)
EWZ (14/39/11.1%)
GDX (15/38/11.1%)
XME (14/38/10.7%)
BROAD MARKET:
IWM (25/31/8.1%)
QQQ (19/27/7.1%)
SPY (15/22/5.4%)
EFA (20/21/5.2%)
BOND FUNDS:
TLT (16/18/4.4%) (Yield: 1.609%)
HYG (7/13/2.0%) (Yield: 4.917%)
EMB (4/7/2.0%) (Yield: 4.024%)
AGG (28/8/1.7%) (Yield: 2.252%)
* -- The first number is the implied volatility rank or percentile (i.e., where 30-day implied is relative to where it's been over the last 52 weeks); the second, 30-day implied; and the third, what the February 19th at-the-money short straddle is paying as a function of stock price.

Finally bearish setup on Silver!! After $27 retestJust update my previous idea disclosed in related...

Hi Ho Silver AwayThe longest term charts display a multi decade Cup and Handle in Silver, best seen on the 100-year log chart. While I will not be around for it in my life, the target is around $100 per oz.

Silver will try retest $27 level very likely in few days...📈Just today fresh idea of near silver market movement...


The wedge is ending SilverWe are approaching the crossroads of three trendlines, each of them having potentional impact on the price action of Silver. The price has bounced down from the upper blue trendline every time but once when it continued to test the resistance above it, but still retracing nicely below the trendline during the same day. The lower blue trendline has acted as support since late November. Together the blue trendlines form a rising wedge.
The brown trendline held the price above it all the way from early May until 28 October when the price finally broke below it. Since then the brown trendline has acted as resistance.
There is a high probability that the rising wedge breaks downwards. If however, the rising wedge of the blue trendlines breaks upwards, there is a potential new rising wedge formed with the brown trendline as upper boundary. In any case I am hoping that the price will break down to offer one more buying opportunity between 23.7 and 24.8.
Trade safe and take care.
Cheers Whoop

GC - Inverse head and shoulders on dailyTrump just officially signed the relief bill, so DXY dropped 12 cents. Metals - Gold futures up .85% and SLV futures was up 3.5%. GC has possible bullish inverse head and shoulders on daily. The GLD etf has bullish Feb 2021 put/call options ratio of .22. GOLD - Barrick gold, Warren Buffett has stake in that. The most common fibonacci retracement is .50 , which is $1928 for GC. GL!

Silver to breakout next week! $slvSilver to break out next week and target the monthly resistance before the end of January. Great time to long silver.
* HH_Analysts is not a financial advising company. This is free material posted by us for the public,

THE WEEK AHEAD: SLV, GDX, XLE, IWM/RUTWith two shortened market weeks in a row for Christmas and New Year's, I probably won't be doing a ton here, but figured I'd do a post for how exchange-traded funds are looking in the waning weeks of 2020 ... .
EXCHANGE-TRADED FUNDS ORDERED BY PERCENTAGE THE AT-THE-MONEY SHORT STRADDLE NEAREST 45 DAYS IS PAYING AS A FUNCTION OF STOCK PRICE:
SLV (32/46/11.9%)
GDX (18/43/11.0%)
XLE (25/42/10.7%)
EWZ (14/40/10.0%)
XBI (21/36/9.1%)
KRE (18/36/9.3%)
I'm currently in small XLE, EWZ, KRE, and GLD positions, but will consider adding on weakness if any comes my way and the implied volatility sticks in there. One thing I don't want to do is to constantly follow high implied volatility, only to find myself grossly overweighted in energy, Brazil, and regional banks, however, so don't want to go too crazy adding in sectors that have been high in the list week in and week out over the past several months.
BROAD MARKET:
IWM (22/29/6.9%)
QQQ (19/26/6.5%)
SPY (13/22/4.9%)
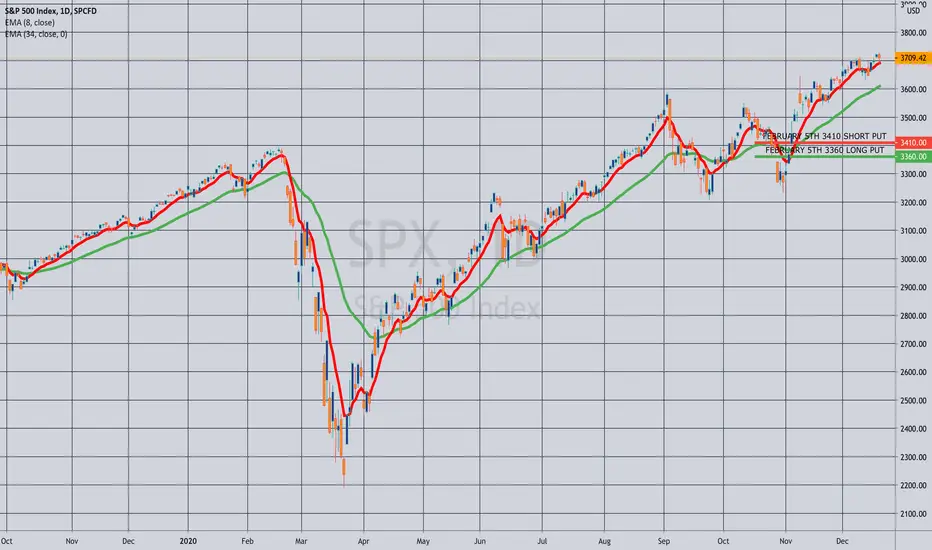
Pictured here is an SPX 50 wide set up to pay at least 10% of the width of the spread, or around 5.00/contract in the expiry nearest 45 days, which would be the February 5th weekly (currently 47 days until expiry). I would ordinarily opt for a higher implied volatility RUT setup, but there currently isn't a February 5th expiry available. You can certainly go with the January 29th (40 days) or the February 19th (59 days), with the preference being to put these on in a down day or days. Smaller account should consider going with SPY or QQQ spreads* with the appropriate combination of of contracts and spread widths commensurate with your account size.
BOND FUNDS:
TLT (1/15/3.5%) (1.609% Yield)
EMB (11/8/2.6%) (4.024% Yield)
HYG (7/10/2.1%) (4.917% Yield)
AGG (29/9/1.9%) (2.252% Yield)
In the IRA, I've been selling HYG short put here of 30 days' duration or so for a credit that is around the monthly dividend. With the December 18th short put having expired worthless, I'll look at adding some in the January 22nd cycle, where the 85 is paying .41 at the mid. As I've pointed out before, the premium in bond funds generally stinks, but I've been using this strategy as a way to deploy buying power that would otherwise be sitting there earning virtually nothing while I await down days or a higher volatility environment.
* -- Unfortunately, NDX isn't as liquid as either SPX or RUT, so I virtually never trade NDX spreads, opting instead for equivalent sizing in the QQQ's (e.g., 5 10-wides).

SLV looking goodWaiting for a top in micro for buying opportunity. Looks good to get above previous highs on this move

SLV - Patiently waitingSilver has not taken out last week's high despite a spirited rally today. I lightened up some on SLV last week anticipating a three week test of the low. With quad-witching on Friday, could be lots of volatility even extending to metals. Dollar continues to be super weak.
Could be wrong and SLV can continue to move higher but I play the patterns that I know and will patiently wait to see how we are going to close on Friday. Holding at or above 21.05 would be an intermediate-term entry point and onward to the 30s.
Last year, I had been anticipating a double bottom formation with prices taking out a top just below 20. Theory says that after breaking through that top (occurring around Aug 2016), prices would come back down to test that breakout point and move much higher. The March madness in the markets caused silver to make new lows. But ignoring the March craziness, I'm am sticking with that philosophy that we did make a double bottom, have come back to test and will then move to higher prices.
That being said, previous posts showed that I had expected still lower prices and they still might occur, actually testing that breakout level around 20. But as the Stochastic indicator is now heading upward, momentum is shifting. If we wind up closing below the 21 level on Friday, a little more patience will be in order. But I think we are close. This weekly setup is important to keep an eye on and if successful, is worth placing your bets on it.