GOLD 19 YEARS AGOThe GOLD to SPX ratio currently looks similar to 2001. Where were you 19 years ago? I know where I was and I was clearly not buying enough gold! Hindsight is clear.. or should I say 20/20? Seeing as history tends to rhyme, precious metals look like the better deal over the next decade- especially if you hold them in your possession.
SLV

SLV to 30 by Mar?Doesn't it look like a nice huge pennant?
We might see SLV @ 30 by Mar.
In any case I would be very cautious about this one as there are many additional inputs to be taken into account before trading this just on the basis of this pattern.

Long AGQ, Gold mining companiesWe are almost there with a new bull cycle.
AGQ entry price 43, but could be slightly better in the next couple of days.
personally, I am not planning on stop loss for this one but if you want, stop loss at the previous low. The first profit target should be around 55.
This is a monthly cycle trade that should happen around mid-Jan.

THE WEEK AHEAD: GDXJ/GDX, XLE, KRE, SLV, IWM/RUTEARNINGS:
No options liquid underlyings announcing earnings this week that meet my criteria for a volatility contraction play, although ORCL (24/31) and WORK (2/33) both announce and could be played in some other way.
EXCHANGE-TRADED FUNDS RANKED BY THE PERCENTAGE THE JANUARY AT-THE-MONEY SHORT STRADDLE IS PAYING AS A FUNCTION OF STOCK PRICE:
GDXJ (14/41/12.1%)
XLE (25/41/10.4%)
KRE (23/40/10.6%)
SLV (28/41/10.2%)
GDX (15/38/10.2%)
EWZ (15/39/10.0%)
BROAD MARKET EXCHANGE-TRADED FUNDS RANKED BY THE PERCENTAGE THE JANUARY AT-THE-MONEY SHORT STRADDLE IS PAYING AS A FUNCTION OF STOCK PRICE:
IWM (23/28/7.1%)
QQQ (20/27/6.3%)
DIA (15/21/5.2%)
SPY (12/20/4.8%)
EFA (17/24/4.4%)
Pictured here is a RUT January 22nd 1655/1705 short put vertical with the short option leg camped out at the 16 delta. Markets are showing wide in the off hours, but look to get at least 10% of the width of the spread out of any play, with the preference being to put something on in a down day with the accompanying rise in volatility and expansion of the "probability cone." A smaller alternative would naturally be in IWM, where I'd look to get at least .50 out of January 22nd 162.5/167.5 5-wide.
For those who like to swim naked, the IWM January 22nd 162.5 (15 delta) and was paying 1.91 as of Friday close (1.15% ROC at max as a function of notional risk; 8.93% annualized).
* * *
On the IRA/retirement account front, I'll be looking to programmatically deploy buying power in broad market over medium to long-term time frames over the next several weeks and then turn to focusing on shorter term plays, so you're likely to see some apparently oddball things in my ideas feed that won't make a ton of sense looked at in isolation and won't be for everybody not only due to buying power effect, but due to duration. I'm using SPY here, but one can certainly do something similar in another of the cheaper (a relative term) exchange-traded funds with high liquidity that will allow you to ladder out in time without giving up too much to lack of liquidity in longer duration.
Essentially, it will look like a short put ladder, but with the rungs put on over time in increasing duration in similarly delta'd strikes or in strikes which pay a certain ROC %-age relative to the strike price (e.g., the SPY February 19th 321 short put, paying 3.27; the March 19th 300 short put, paying 3.02; the April 16th 283, paying 2.87, etc.), after which the individual rungs will be separately managed.
Although this isn't particularly buying power efficient relative to defined risk spreads, I'm shooting for a setup that is relatively set and forget running into retirement where I don't necessarily have to pop my portfolio open on a daily (or even weekly) basis to manage trades, but can go for fairly lengthy periods of time without having to touch or manage rungs and with modest expectations as to ROC %-age.
As a "quasi-cash" option, I'll also continue to deploy idle buying power in things like HYG puts (See Post Below) just that I'm not earning 0% of 0 and where I'm comfortable taking on shares and selling call against. Point in fact, that is probably not a bad stand-alone setup for an extremely conservative investor who isn't keen on taking broad market bullish assumption positions at all-time-highs where a number of people are calling "bubble" week after week. That being said, even this type of setup isn't riskless, as we saw in the March "sell everything" dip. At some point, you will potentially have to take on shares ... .

Is gold bullish again. Reasearch, setups. ExplainedGold was a safety hedge in an uncertain world. There is no surprise we saw a massive sell-off with Covid vaccines being announced. Both vaccines are still waiting on final FDA approval. The real game-changer however could be Johnson & Johnson's vaccine which only requires one shot and no special refrigeration outside that already widely required for current vaccines. Johnson & Johnson are expected to have interim data on its vaccine sometime in January which could mean emergency use authorization as soon as February.
So overall the vaccine news is still very promising. However, the damage to the economy is already done and it will take years to recover after COVID. Despite massive stimulus key economic data is very weak.
Middle-term setup
Gold was unable to rally even with a weak dollar. It seems last week metal finally rebuilt its correlation with the greenback. MA200 turned out to be a buyers zone. But is it a jerk reaction or gold is trying to start a new wave to the upside?
Formation of higher low or kind of base formation is needed to have confidence in buying gold. However, we already can identify a bullish setup:
Cycles point we are close to the bottom and new rally.
The seasonal indicator is turning to the upside.
Valuation model shows gold is undervalued.
Technical analysis
With that in mind let's have a look at the technical picture. Gold used to follow flagging formations. We had three similar patterns on the weekly chart during the last two years and it played very well. There are early signs gold is getting ready for the next wave up with another flagging formation.
The metal reached the Fibo retrace zone that is also near MA200 along with the 2012 bounce highs as support. Technically till gold holds above this zone, there are chances to test 2400 and 3000 in extension given enough time. This is not something that will happen in a few weeks – this trend will likely take place over months, and even years. Breaking below mentioned range is a trend change.
Will Gold rally if the Dollar goes up?
Let's not forget the huge government debt and potential asset bubble. Gold and Dollar are both means of safe haven. Definitely, under certain circumstances (like mentioned above) they can move in one direction.


GOLD - WHAT IS THE DEAL WITH NOVEMBER?Gold has entered the pivot zone. The hard metal is always a hold to me personally, but it helps to study the charts to get an idea of the algorithmic driving forces and other oddities. In this case, I couldn't help but see this Nov Nov Nov trend and the math behind the madness. The pattern suggests it'll be supportive. Watch it closely the next few weeks. We need to see strength come in to confirm support and upward continuation. Do not dismiss the possibility of a deeper correction.. There's no such thing as "impossible" when in comes to financial assets.. especially in 2020-after all, we did see oil trade MINUS $37 this year. Keep an open mind while in wonderland.


Silver (AUD) - Symmetrical triangle consolidation. Silver (AUD) - Symmetrical triangle consolidation.

Everything Update 11.20.20Taking a look at the weekly progress of multiple correlated markets and updated price targets: Bitcoin, Gold, Silver, USD, S&P500
Bitcoin
Excluding the March mayhem deviation in price, weeks ago there were hints of a parabolic trend starting to develop.
The breakout of a macro downtrend and weekly candle close above it was the buy signal.
Using macro fibonacci extensions I'm still anticipating a relentless squeeze with occasional dips to the longer term target of about $33,700, and will be watching for volume to start trending up.
US Dollar
Weeks ago it appeared a consolidation pattern was forming and momentum was to the downside.
I am still projecting one more leg down followed by a swift rebound up to the 200 week E M A. Eventually rolling back over to the longer term target below.
Gold
Not much changed with gold this week. Looks like a base is still building at the previous all time high levels.
Using macro fibonacci extensions, the intermediate term target is still $2300ish.
Next buy signal for Gold is a break out of the downtrend with the daily MACD above zero.
Silver
Weeks ago a consolidation pattern was forming.
Now that pattern has been validated and a breakout is imminent. Target $35ish.
Using the macro fibonacci extensions the longer term target looks to be around $58 or even $86.
SandP 500
Lots of speculation of a crash here. My thoughts are that reality lies somewhere in the middle and money will flow into the SandP stocks that have not fully recovered yet. I'm looking to buy short term dips, especially near the grey bars where heavy volume came in previously. If the dollar continues it's descent into the abyss then the SandP, along with all the aforementioned markets, will surely go up, up, and away.
Trading is risky. Don't do it and don't listen to me.
Long
Crypto: BTC, ETH
Gold: MGCG21, PHYS, GDX, other mining stocks
Silver: SLV, CEF
Other Equities: Oil/Gas stocks, TCEHY, BABA, and others

Silver $SLV offering a 10 percent ROI with some Patience: YAWN?$SLV makes a nice long, on silver futures. The gain is not tremendous, but it seems "safe" (A word I loathe using, but will).
With Au trending up, Ag should match it after it finishes this bottom out -- It's down 0.5% pre-market and may fall a full percentage point, at which entrance can be considered.
This won't knock the socks off a thing - but who flicks boogers at actual gains? Not this trader.
LUCK, BS, and whatever else,
BDR

Silver (AUD)- Symmetrical Triangle on the daily chart.Silver (AUD)- Symmetrical Triangle on the daily chart.
Breakout soon.

Silver and longer term fib levelsSilver seems to have excellent growth potential in the next couple of years.
This is a look at longer term fib support and resistance levels of silver.
The fib levels on the right - more recent - part of the chart show retrace from April 2011 - Mar 2020. The .382 level was broken through as resistance, but has not gone down again to retest of .382 level as support yet. My thought is that this level .382 (around $20) will be retested and confirm support before doing a longer bull run. (Of course, it could fail as support as well, and good to keep in mind all possibilities, although, that seems less likely to me.)
We have already tested 0.5 level as support. If this fails, we're looking at retesting the .382. Buying around the .382 level as is in my definition a strong buy for short term or long term. Long term due to the effects of inflation from all the efforts to rescue the economy.
But there is chance that it could retest the .618 as resistance first prior to going lower again. If this scenario happens, then it would be a short term sell.
I am bullish on silver on the longer term and I am looking for opportunities to long.
Keep in mind all possibilities of what can happen.
*** This is not a recommendation to buy or to sell. Please do your own research to make your own trading or investing decisions. You should not use others' ideas as the basis of trading/investing decisions. ***

SlV in the month of Oct and NovAMEX:SLV has been super volatile however I have noticed a trend with this precious metal. When it is priced at or higher than $23 it tends to turn down pretty rapidly and the same goes for pricing at 21.95 in the opposite direction. While it is hard to gauge the exact demand/supply of SLV and market conditions CCI shows clearly overbought and oversold conditions of during the break of these levels. This month there has been extremely high volume at 22.50 and this seems to be a great level to watch for pullbacks or rallies on silver. As it sits on this level awaiting more developing news on the dollar's performance and future in the coming weeks, I remain bullish on SLV. My target is 24.20 Before taking a position I would like to either see a pullback to touching or approaching it's supply zone at 21.95 or a valid break and retest of 22.69. Trailing stops is a viable option for this volatile choice.

Gold and the next leg upGold looks like it's about to make a new leg higher but will it also drop 5-7% first? The dollar and gold tend to create very distinctive price cycles if you know how to look for them. Renko helps to see these price cycles and time seems irrelevant to them. I am seeing a cycle low in the works now but I'm not sure if it's complete yet. I will venture to say it's going to drop down into the 1700's before the next leg up but I'm not sure if we'll get that lucky. See my forecast on GDX (gold miners) and how this analysis could agree with that one. Smart money likes to flush the boys out so I am just expecting a wild ride here soon.

THE WEEK AHEAD: DKNG, BYND, LYFT EARNINGS; XOP, GDXJ, SLV, QQQEARNINGS ANNOUNCEMENT VOLATILITY CONTRACTION PLAYS:
WKHS (18/146/38.8%),* Monday, before market open.
PLUG (32/100/25.6%), Monday, before market open.
DKNG (32/89/23.6%), Friday, before market open.
CGC (39/132/23.5%), Monday, before market open.
BYND (32/77/18.9%), Monday, after market close.
LYFT (16/71/18.0%), Tuesday after market close.
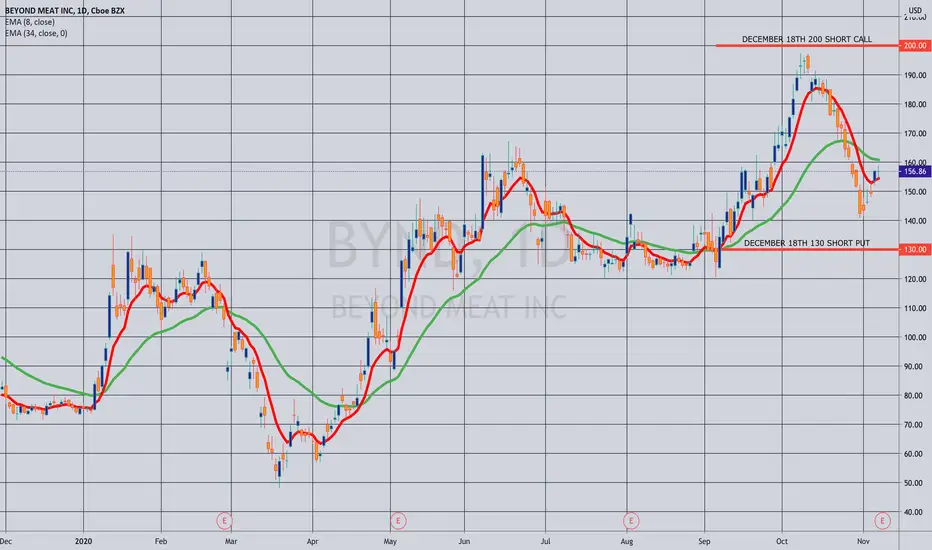
Pictured here is a BYND December 18th 130/200 short strangle that was paying 7.95 at the mid price as of Friday close, with the short legs camped out at the 18 delta. This yields at or greater than two times expected move break evens and a delta/theta metric of -.58/23.86.
Alternative Defined Risk Setup: BYND December 18th 125/130/200/205 iron condor, paying 1.59 at the mid price as of Friday close with break evens at the expected move on the put side/greater than 2 x the expected on the call and delta/theta metrics of .96/2.45.
Unfortunately, WKHS, PLUG, and CGC all announce on Monday before the open, so any play would've been best put on before the end of Friday's session, although they could still be playable after they make their earnings announcement move.
LYFT: Short straddle or iron fly.
DKNH: Short strangle or iron condor.
EXCHANGE-TRADED FUNDS RANKED BY PERCENTAGE OF STOCK PRICE THE DECEMBER AT-THE-MONEY SHORT STRADDLE IS PAYING:
XOP (14/53/14.1%)
USO (9/57/13.4%)
GDXJ (16/47/12.9%)
SLV (38/50/12.7%)
GDX (16/39/10.9%)
EWZ (17/41/10.7%)
XLE (25/41/10.6%)
BROAD MARKET RANKED BY PERCENTAGE OF STOCK PRICE THE DECEMBER AT-THE-MONEY SHORT STRADDLE IS PAYING:
QQQ (25/30/7.2%)
IWM (24/29/7.2%)
SPY (19/24/6.0%)
EFA (21/21/5.3%)
IRA DIVIDEND EARNERS RANKED BY PERCENTAGE OF STOCK PRICE THE DECEMBER AT-THE-MONEY SHORT STRADDLE IS PAYING:
SLV (38/50/12.7%)**
EWZ (17/41/10.7%)
XLE (25/41/10.6%)
KRE (22/39/10.5%)
* -- The first metric is the implied volatility rank or percentile (i.e., where 30-day implied volatility is relative to where it's been over the past 52 weeks); the second, 30-day implied volatility as of Friday close; and the third, what the December at-the-money short straddle is paying as a percentage of stock price.
** -- Neither SLV nor GLD pay a dividend.
Silver and the Election Silver has historically thrived under Democratic presidents, and I think this will be no different this time around if (or when) Biden wins. SLV seemed to recover the last 2 days of this week on riding the trendline that's been dating back to March of this year.
I'm going to be watching 24.25 as resistance this week with possible upside of 25.50's in the short term run. I am long on SLV and hoping we can see similar levels we saw in 2012 - at the 35's.


Silver Looking Increasingly VulnerableSilver looking vulnerable here. Broke rising channel support, retesting falling wedge resistance. Lot of work to do to get above horiz. resistance @ 26. Looking like another leg down through yr end if it can't break out here soon. aVWAP from March low is 22.42. $SLV

Silver 40 Year Cup and HandleThe disconnect between physical and paper markets is considerable. The paper markets represent $5T whereas there is a $20B market for physical silver. If the price of silver were based off the total market, silver's price value would be roughly $5000/oz. Not saying silver is going there but this is decades of manipulation and curving demand from the physical market to paper all while buying up the physical silver for themselves. There is definitely an extreme undervaluation here and once the leveraged naked shorts get wiped out, silver will moon.

#SLV Almost Ready for the Continuation#SLV Setting up a bullish pennant on weekly and daily time frames. High volume run ups are usually followed by a period of consolidation before a continuation/reversal. Once silver breaks above the upper trendline and clears 23.55, SLV should start its move to $30+ by the end of the year. This is just the start for silver and gold and if it isn't a part of your portfolio yet, I'd strongly consider it. Do your own due diligence as always.

SLVLooking for the 50% retrace from low to high. Looks like a giant bull flag. Considering $19-20 range SLV, spot Silver ~$20.80

XAU/USD Long Entry 05:03:37 (UTC) Fri Oct 30, 2020XAU/USD Long Entry 05:03:37 (UTC) Fri Oct 30, 2020
