Silver could breakdown to drop into 16-17 areaThe trendline was broken and retested at the 61.8% Fibonacci retracement level.
Watch breakdown of current corrective structure.
It could drop in between 16 and 17.
SLV

SLV Next Wave to 18.70?Appears that we may be in a wave 2. Wave 1 being 16.61 to 17.41. If wave 3 moves 1.618 of wave 1, targeting 18.70.

Silver in Wave 5 of 3?It appears that Silver has completed a wave 4 (of 3). It immediately rose to the first Fibonacci projection of 1.618 and is entertaining moving to the 2.618 level.
As the Wave 2 of the next higher level took around three months to play out, I am anticipating that when this wave 5 is completed and the higher level wave 4 begins, Silver may consolidate for a similar amount of time, meaning that we may drift to the end of the year.
But as wave 5s are said to often be the most explosive in commodities, it will be important to be patient as this minor wave 5 plays out as well as the wave 5 of the next higher level that could begin playing out, if my review is correct, early next year.
I'm currently looking to confirm the double bottom formation. This would require breaking above the last major high of 21.14 on XAG and 19.73 in SLV.

Reasons Why I Won't Buy Silver NowSilver was definitely undervalued due to strong demand, supply deficits and the gold-silver ratio.
In this chart, the blue moving line is the price of gold. We could obviously find that the gold-silver ratio has reached the highest level.
So for long term view, buying silver is a really good choice.
However, shall we buy the silver now or later? Here are couple reasons why i would like to buy silver later.
1. MACD: the macd of silver has reached overbrought area. In the recent 14 years, there were 8 times that silver's macd reached 4.81 level, and 6 of them dropped hard right after that. Now, the macd reached 4.81 level again.
2. RSI: the rsi of silver also reached overbrought area. In the recent 14 years, there were 7 times that silver's rsi reached 70 level, and 5 of them dropped hard right after that. Now, the rsi is moving above 72.2 level.
3. Short term trend is still bullish, but the strong resistance is around 17.32 to 17.57.
It's also possible that silver moving like October 2010 in the next half year.
But I prefer to wait a healthy correction before the next level breakout and it would be a good chance to buy low. (16.18 and 15.50 are strong supports. If silver break those supports, it may reach 14.90.)

SILVER UPDATE: WEDGE BREAKOUT!The bullish divergence on the 4H MACD is playing out so far showing a potential breakout occurring. The gap was not filled yet and doesn't necessarily have to be. Watch for the candle close to end with a sold bar above $18.

TEXT BOOK WEDGE/BULLISH DIVERGENCE SLVSeems too good to be true.
Will this play out as expected?
4H Divergence with MACD however not with RSI.
The 0.618 is the breakout target.

SLV Possible Monthly Support viewRunning a 10 month average with a long term support line shows that on a monthly close basis, we should hold support around 15.70.Still a strong bullish trend in the works

SLV Will Buy the Dip Mentality Move to PMs?A more bullish view may place us in a minor wave 4 of a larger wave 3 structure with a test of the highs and the potential wave 5 coming in a couple of weeks. Some suggest that in commodities, wave 5 can be the strongest move. My longer term view (other posts) suggests a confirmation of the Major Double Bottom. To complete this formation, SLV must break above 20. As Central Banks continue to lower interest rates to negative levels, the move to precious metals should continue. With the gold/silver ratio so out of whack as it has been, it's possible that silver will eventually test the highs.
SLV 2022 LEAPs are now listed. My patient money goes into LEAPs and physicals to take away my urge to trade my positions. Spreads are not friendly here resulting in stable long term positions.

SLV Upward Bias ViewAs SLV appears to be entering into a bull market phase, interesting to see possible channel ranges. In 2021, I could imagine to see $40 as the midpoint. That could be consistent with a gold/silver ratio moving down to 40. Of course, knowing how silver trades, a $2 smackdown could occur in any moment ;-)

SLV _ Wave 4 Coming SoonAppears to be in the final stage of a wave 3 with one more rally to test the highs. Then anticipating a wave 4 of a similar time frame as wave 2 with an alternating pattern. Then on to test higher resistance levels.

SILVER going down?Another massive bear channel on a longer term. We are not in a bull market yet. still looking for another leg down. Too much hype and positive sentiment on Silver and Gold.

Silver Channel Forming?After a healthy run, some consolidation can be expected. Here's a channel that appears to be forming

Possible Wave 4 startingCould be that we have just completed a wave 5 finishing off a wave 3. The current downturn may be signalling the beginning of Wave 4.
The last correction, wave 2, lasted approximately 3 months. Sometimes wave 4s can last a long time and display many different formations. The eventual Wave 5 should challenge the last major high, just under $20. I'm projecting that it will overshoot, going to a gap above $25 and then testing the breakout area ($20).
I will be watching price on Monday or Tuesday to rally and test Wednesday's high. Given the current strength in the recent move, I expect price to break through to higher highs. But a failure to make new highs may confirm that Wave 4 is beginning.
Silver Looks Friggin BullishHello Traders,
There has been a lot of talk about the precious metals recently (Gold / Silver) with many different reasons for the resurgent interest in precious metals ranging from the classic "store of value" to "finite resource" to "growing lack of trust in fiat currencies".
From a Fundamental Analysis point of view I don't really know anything about Silver apart from the basics so if you are reading this and know your stuff about Silver please put it in the comment section.
This chart is from a TA perspective.
Since the beginning of 2002 the price of Silver went on a bull run which peaked in April 2011. That run lasted about 10 years with gains in the region of 1125%. Very nice if you were long on Silver. From an Elliot Wave perspective the price printed a nice set of bullish impulse waves.
Then over the course of the next 4.5 to 5 years the price retraced to the 0.786 Fibonacci level, pretty much to the wick. WickHunter loves it when the market obeys Fibonacci. This entire move looks like a massive Wave 1 and Wave 2 has been completed and price is gearing up for a wave 3.
"If" this is the case and tbh that's exactly what it looks like, then Silver could go to the moon here.
I've used the Fibonacci extension tool on that wave 1/2 and plotted the 1.618, 2.618, 3.618 and 4.236 extensions as targets.
Nobody knows which of the targets will be hit, only time will tell.
WickHunter


Silver's Long GameIt appears that the long correction in the silver market is over. A bull market in silver could see prices reach over $100. Only a matter of time and patience.

Silver Imminent Breakout Years in the MakingSilver is at an imminent breakout zone years in the making. This likely might just be the trade of the year is not the last few years. The equilibrium is getting very tight with SLV making it's first weekly higher low since December 2017.
Furthermore the macro fundamentals are very bullish for precious metals. The Feds also recently reverse course on rate hikes and expectations are now rate cuts. And as crazy as it sounds, this is all on the back of strong economic numbers. With the looming potential of further escalation of trade wars and heighten political instability; it seems easy monetary policy is almost certainty. And the icing on the cake is that Silver to Gold is near all time lows. As long as bullish momentum continues, there'll come a time where silver is going to slingshot and play catch up with go and it may happen quite soon.

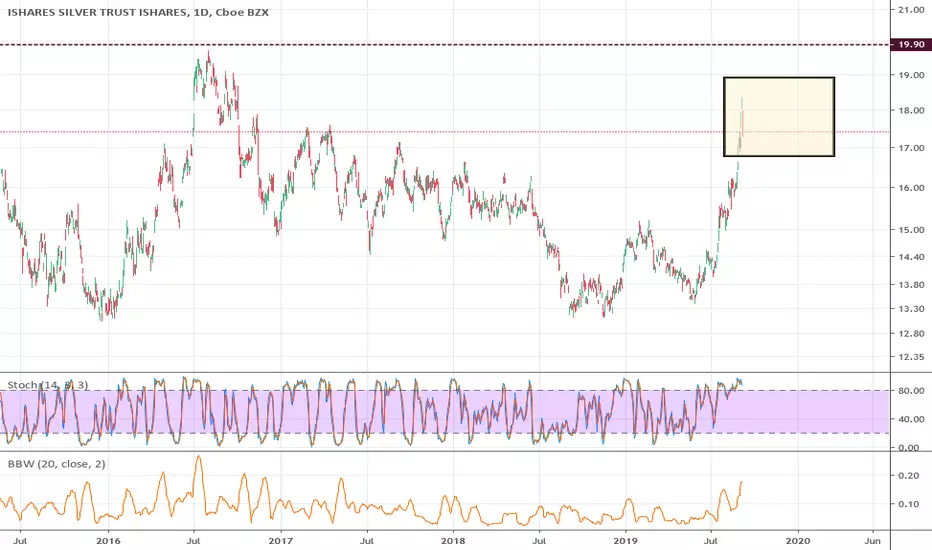
What the hell just happened to SLVI said silver (SLV) was going to rise but it honestly has shocked even me. Lately it had the momentum of a runaway train and even started going exponential with several gaps up it now has to fill, but when it blew past the second blue top line (a long term overhead resistance going back to 2015 if you can believe it) I was truly shocked. I sold a lot of positions in anticipiation of a pullback just over 16.00 but the resistance of the large channel we identified several weeks ago has been an excellent guide. Today there was a monumental pullback. After first rising over a 1% for the day it was down 0.7% at the time of writing.
The other sign that a large pullback is due are the COT reports which show the largest institutional short position since January of this year in precious metals. My patience for a large pull back has finally come. At the very least it needs to come back to the top blue line, but based on the size and breadth of the upward channel it could easily pull back even further. We will watch key support areas but at the close of today a short position was entered in the precious metals/miners market (please refer to GDXJ which failed to make a higher high and has already breached the upward channel).

SILVER WEEKLY Can you imagine not being long on SLV
Doesnt get much easier than a daily double bottom inside of a weekly double bottom
But most people rather wait till the $40's ;)
*This is NOT financial advice*


SLV Double Bottom ProjectionsSLV is exploding up in past days. A longer-term view shows the massive 2015-2018 double bottom. To confirm the double bottom, SLV will need to break above 19.82. There's a gap above the 25 level, a likely target. A successful test of the breakout level will likely be the launching pad for much higher prices.

