Time for rotation??? Silver to out preform Gold??We know they have been playing games.
I personally would buy physical and stand back from PAPER Silver.
Can the silver gorillas return with strength??
NOT FINANCIAL ADVICE!!!
SLV

SLV multi month channelA no brainer buy low, sell high.
Is Silver ever going to zero? No
GLD has had a BIG breakout and SLV has not followed through (yet)
the 100/200 sma on monthly support this trade and if your time horizon is long enough, I believe this position goes back up to the supply zone.

Where is $ flowing into? Central Banks = Gold. Retail = $BTCGood Morning
Let's see how CRYPTOCAP:BTC handles this next resistance level. Currently it is above.
Assets, not #Dollars!
Where are can you put your hard earned $???
Into #equities with high PE's?
Into #commercialrealestate?
#BTC #Bitcoin
#GOLD & #Silver as well as they have stood the test of time.

Economic Uncertainty and the Allure of Physical Silver
Silver has emerged as a resilient and attractive option for investors seeking refuge from economic uncertainties. As we delve into the intricate analysis of AMEX:SLV stock, it becomes apparent that the interplay between Treasury yields, the U.S. Dollar, and market sentiment is crucial in understanding the trajectory of silver prices.
Treasury Yields and Dollar Dynamics:
At the forefront of silver's market dance is the 10-year U.S. Treasury yield, currently standing at 4.141%. Traditionally, higher yields bolster the U.S. Dollar, making silver more expensive in other currencies. However, recent silver performance has introduced a potential shift in this correlation, challenging conventional wisdom and prompting investors to question the metal's future direction.
Key Questions for Silver Traders:
The upcoming week poses critical questions for silver traders. Will silver's recent divergence from gold persist, or was it merely a momentary event driven by attractively low silver prices? The tone set by the Federal Reserve, particularly if it adopts a hawkish stance, could prove pivotal, potentially causing silver to relinquish its recent gains.
Silver's Response to Economic Data:
Intriguingly, silver has displayed a unique response to last week's economic reports, deviating from the well-trodden path of gold. This nuanced behavior indicates a more complex market sentiment towards silver, emphasizing the need for investors to stay attuned to the metal's independent movements.
Short-Term Outlook and Federal Reserve Impact:
In the short term, traders should brace for potential fluctuations in silver prices. While the market may continue to favor silver, the upcoming Federal Reserve meeting and comments from Fed Chair Jerome Powell will be decisive. A hawkish stance could trigger a sell-off in silver, undoing the gains from the previous week.
Investing in Physical Silver:
Against the backdrop of economic uncertainty, some investors find solace in owning physical silver, be it in the form of coins, bars, or bullion. Despite risks such as theft and storage, the convenience of online purchases from reputable dealers like APMEX or JM Bullion provides a viable option for those seeking tangible investments.
Silver Stock Performance:
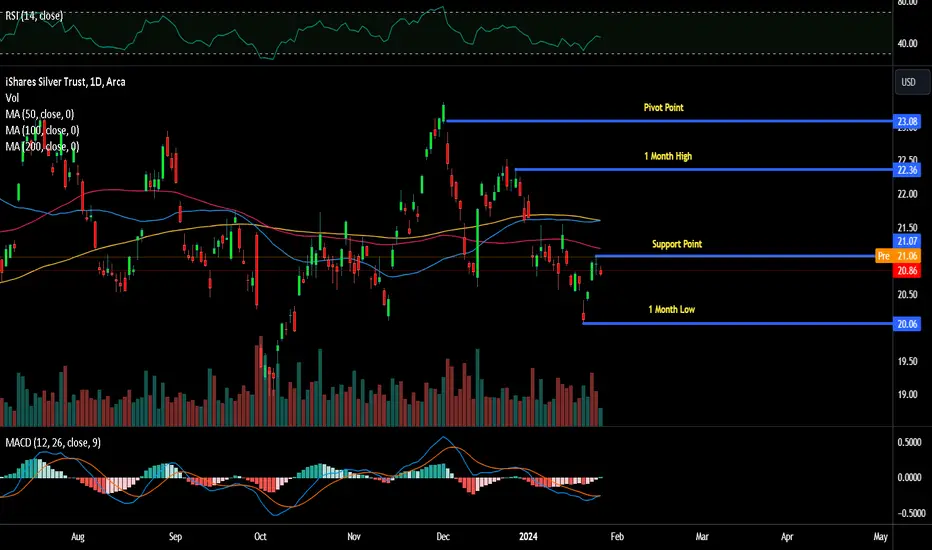
With economic uncertainties lingering in 2024, silver prices have climbed back near 2023 highs, currently quoting at $22.90 per ounce, reflecting a 0.12% surge. The interest in silver and precious metals tends to rise in turbulent financial conditions or elevated inflation, prompting investors to evaluate whether current silver price levels present a buying opportunity or are poised for a pullback.
Technical Outlook:
The technical analysis of Silver Trust Ishares reveals positive investor sentiment, with prices reacting positively after breaking an inverse head and shoulders formation. A decisive break above $21.25 will signal further positivity, while a break on the opposite side may be a strong negative signal. The stock has already broken through resistance at $20.50, predicting a potential further rise.
Conclusion:
As investors navigate the complex terrain of silver investments in 2024, the confluence of Treasury yields, the U.S. Dollar dynamics, and Federal Reserve actions will shape the trajectory of silver prices. The metal's unique response to market dynamics and its resilience in the face of economic uncertainties make silver an intriguing option for those looking to diversify portfolios and hedge against inflation risks. However, the cautionary notes on physical silver ownership and the vigilance required in monitoring short-term fluctuations emphasize the need for a well-informed and strategic approach to silver investments in the current financial landscape.
Friendly Reminder You Don't Own Enough Bitcoin.
The Dawn of the Final ETF Approval Week - Everything will change.
Bitcoin will obliterate Apple returns
Bitcoin will obliterate SPY returns
Bitcoin will obliterate Gold returns
Bitcoin will obliterate Silver Returns
Anything plugged into Bitcoin related or touching bitcoin will be rocket launched into an entire new global standard.
I have come to the conclusion that smart money will enter this first being convinced of a new turning of the way we will live life in the next century meaning they will move first.
At the $200,000 mark many will sell calling the top
(you will know they're wrong due to zero on chain data proving this top)
I suspect after $300,000 appears in a short period the first batch of doubters will start to enter the market.
After $600,000 is breached there will be motions moving and outrage to shut Bitcoin down calling it the next "2009" the next Mortgage backed securities"
(This will cause major short interest and major Puts following the consensus that this is a bubble and not a supply shock)
Reaching the $1,500,000 people short and call writers will be entering margin call territory.
Remember the hard critics of Bitcoin who will give in around the $1,500,000 - $2,500,000 mark over the next years, this will mark the start of the extended bear market.
So the question is do you own enough Bitcoin?

Silver is setting up for a short term collapseSilver seems to be setting up for a beating. Its forming a rising wedge, whos top aligns with a strong resistance. The rsi and macd are forming obvious bearish divergences. I believe that the light holiday liquidity, alongside the bearish setup, is a recipe for a beautiful buying opportunity

Is Silver going to test the 200 weekly?My reasoning of why silver will retest the 200 weekly.
1. The Dollar (DXY) is in a downtrend. I believe It is on its way to the 200 weekly moving average but before that happens I believe there will be a small rebound.
2. I believe the DXY is going to have a rebound as the daily RSI is nearly indicating oversold.
3.Silver is in a rising wedge pattern and it is nearing overbought territory on the daily RSI.
This is just me hoping. I'd really like to see a retest of the 200 weekly for an entry into silver again and off we go to a Christmas bull run. =)

$DXY US Dollar looks primed again#GOLD & #SILVER are still selling off since we made the call, very close to top.
CRYPTOCAP:BTC is suffering its biggest drop since august of 2023.
The US #Dollar really looks like it settled at the 102 area.
Not a normal area to find support but it can happen.
TVC:DXY seems as if it wants to conceivably push higher from here.
AMEX:GLD AMEX:SLV CRYPTOCAP:BTC

Silver maybe be forming the bottom of a Wave CSilver looks like its trying to complete a correction before a new uptrend is formed. Its also grinding on the top of a falling wedge.

Gold > Silver, $DXY done? $BTC best performer latelyGOOD MORNING
#GOLD is currently holding better than #Silver.
Has the US #Dollar run stopped or will it find support soon?
Out of all of these CRYPTOCAP:BTC has been the best recent performer, by a good amount.
Keep an eye on strength (RSI), it's still weakening as it goes higher.
However, $ flow has been increasing.

Silver broke a massive trend line on the daily today. Silver broke a massive trend line on the daily today. If we have the daily closing candle close below approx $24.35 today, which is in 5 hrs, I believe we will see more downward trend.

Gold Long: Cup and Handle and Wave 3 of 3Clearly seen on this chart is the cup and handle that lasted for 12 years and now we are going into a wave 3 of 3.

$DXY keeps crumblingSince our call the US #Dollar has crumbled. In currency those are big moves.
Yesterday we said that it looked as if TVC:DXY wanted to settle a bit. However, it was an unusual area for it to find a "bottom". It eventually reversed & went lower in the day.
The yellow lines are more likely a target & will cause some sort of bounce when/if they reach them.
Weekly shows the hit best.
TVC:DXY CRYPTOCAP:BTC #Gold #silver

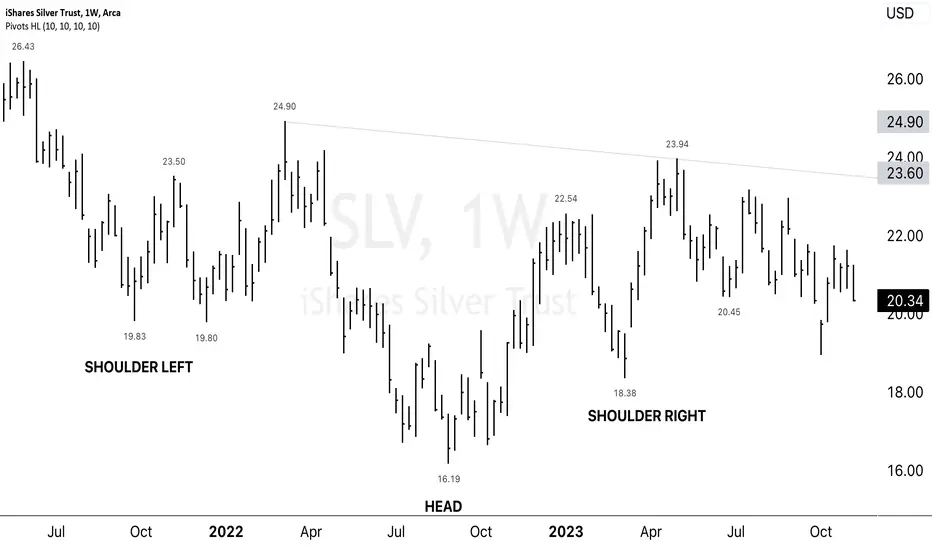
$SLV Inverse Head & Shoulders Pattern ### Technical Analysis Overview: Silver SLV ETF - Inverse Head and Shoulders Pattern
Investors and traders focusing on technical analysis are currently observing a significant development in the Silver SLV ETF stock chart. The chart exhibits an inverse head and shoulders pattern, a formation that is often indicative of a potential bullish reversal in the market.
#### Understanding the Inverse Head and Shoulders Pattern
The inverse head and shoulders pattern is recognized as a reliable reversal pattern in technical analysis, typically occurring at the end of a downtrend. The pattern comprises three troughs:
1. **The Left Shoulder**: The first trough, representing an initial low point.
2. **The Head**: A deeper low, forming the middle trough.
3. **The Right Shoulder**: A subsequent shallower low, forming the final trough.
This formation is considered 'inverse' because it is the opposite of the traditional head and shoulders pattern, which is typically seen at the end of an uptrend.
#### Implications for the Silver SLV ETF
In the case of the Silver SLV ETF, the completion of this inverse head and shoulders pattern suggests a possible change in the overall trend from bearish to bullish. The key moment in confirming this pattern is a break above the trend line that connects the highs of the formation - often referred to as the 'neckline'.
#### Critical Observations for Confirmation
- **Break above the Neckline**: For the pattern to be confirmed, the price of the Silver SLV ETF needs to break above the down-sloping trend line connecting the peaks of the pattern. This breakout is typically accompanied by an increase in trading volume, lending further credibility to the pattern's validity.
- **Sustained Momentum Post-Breakout**: After the breakout, it is crucial to observe whether the price can maintain its upward momentum or if it reverts below the neckline, which could invalidate the bullish signal.
- **Target Projections**: Upon confirmation, the inverse head and shoulders pattern allows for price target projections. The height of the head from the neckline can be applied above the neckline to estimate a potential upward move.
#### Considerations for Investors
For investors and traders who rely on technical analysis, the inverse head and shoulders pattern on the Silver SLV ETF chart provides a framework for making decisions. A confirmed breakout above the neckline could be interpreted as a buying signal, while caution is advised if the pattern fails to confirm.
It's important to note that while technical patterns like the inverse head and shoulders can provide insights, they should be considered alongside other technical indicators and market fundamentals to form a comprehensive investment strategy.
Gold - Fade a The Short Squeeze RallyThe marketing team behind gold and silver are always telling dumb and dead money that they should "hedge" against a "collapsing US Petrodollar" during times of global instability by being long on metals.
The trade rarely works out. Gold and silver not only routinely follow the equities markets straight to Hell, but tend to get dumped during the start of new index impulse swings.
This rally while the SPX gave up its 5% rally is actually a significant anomaly.
But if the propaganda never, ever worked out, the propaganda would stop working and the marketing team would be out of a job.
And that more or less sums up a 10% monthly rally on gold that's killed short sellers who wanted to comfortably ride a trend down.
You can see on the monthly that this price action is just more ranging, more wick plays, and there's a notable unbalanced gap under $1,800.
It's really important to keep a cool head as a goldbug, especially under the condition where the establishment media is reporting that Xi Jinping and the Chinese Communist Party is long several hundred tonnes worth of gold.
The CCP is collapsing and everything that is going on in the world has to do with the various members of the CCP around the world, who are not of the Chinese race, scrambling to bury their skeletons while also trying to ensure they can take control of the country when the regime falls.
And because of that, there's no reason to believe that a CCP that is desperately selling US Treasuries (see: Santiago Capital) for USD is going to be allowed to go plussy plus greeny green on its deeply deep goldy gold position.
What hangs over the head of everyone on this planet is the Party's 24-year persecution of Falun Dafa's 100 million students and Disciples, a sin committed by former Chairman Jiang Zemin on July 20, 1999, that has even had the audacity to commit the unprecedented crime of live organ harvesting.
Keep your distance from and wash your hands from anything related to the CCP, including the western factions that have become a particle of the Party swearing Marxist vows in Shanghai.
So, here's the trade.
Doesn't matter if gold takes $2,015. It's not the right overall timing for a new rally to $2,200.
Instead, either go short, or wait for gold to trade under $1,800 again.
There's no reason to believe gold is a new bull market until longs have been ruthlessly violated. There's no reason to believe metals are going to rally as a hedge during an international war or a major equity sell off, or a major equity rally lol.

Bitcoin, GOLD, and SLV Rose Sharply From Israel-Hamas WarCommodities and Bitcoin experienced significant increases in value around October 7, which is the date that the Israel-Hamas War started. Commodities and Bitcoin experienced significant increases in value around October 7, which is the date that the Israel-Hamas War started. SLV had a bullish bounce off the yellow trend line on Friday October 6 (marked by the orange circle). The Israel-Hamas conflict started on Saturday, and on Monday SLV started its uptrend.
Key Price Levels:
The light blue trend line is acting as short-term resistance that is suppressing SLV's price, but the longer term target is the red trend line if SLV can continue to climb higher. The yellow trend line is a key support level to monitor for a bounce if SLV drops back down.

Bullish engulfing candleSSR Mining Inc. is a leading, free cash flow focused gold company with four producing operations located in the USA, Türkiye, Canada, and Argentina. They produce over 700,000 oz of gold a year.
Friday had a bullish engulfing candle
I see a target price of $14.30 , where there is resistance.
War news again this weekend will push oil and gold up again.
Good luck traders

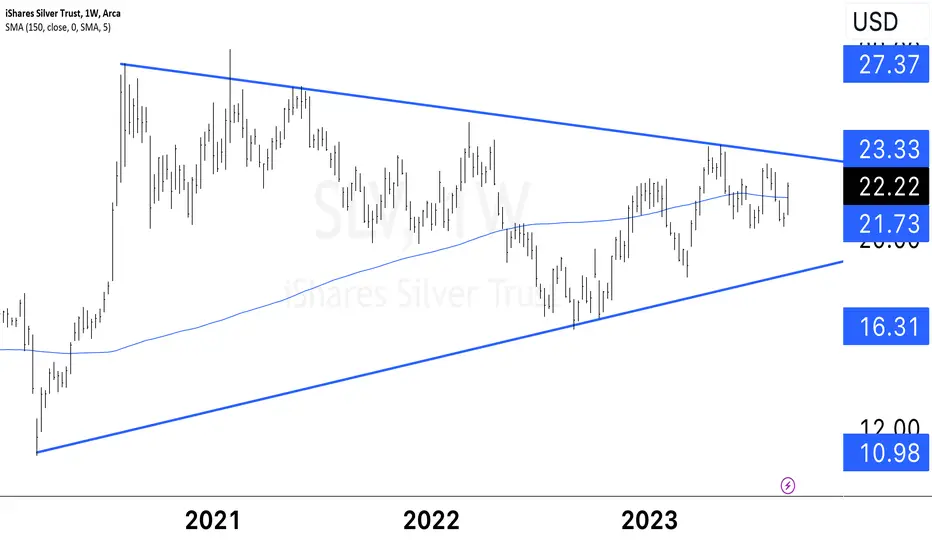
Will silver shine again? As in gold, possibility for a new bull market in SLV is in the cards for coming 2024.
The price structure* on weekly time-frame suggests there is a high chance that SLV, has found its bottom last year in Sep'22 and with higher low this year in Oct'23.
As long as Oct low holds, I would expect the price to move toward next resistance zones: first 22 and later important 24-25 zone. Afterwards, if price builds a handle and breaks-out above 24 that would confirm the move to 27-30-32 resistance area.
Overall, traditional fear-type assets look mid to long-term bullish to my eyes in coming months and years.
Trading thesis : I need the price to confidently move above 50D MA, and create at least short base with several days/a week of consolidation around previous basing attempts (most recent being around 21) with later break-out above this pivot to consider longs.
* Important caveat to EW: I use it solely to have a subjective idea about sentiment and overall structural context to support, but not guide, my investing decisions. Price and volume is the key, and only price pays, not the fibonacci resistance or any wave count.

War news pushes gold up 1%war new pushed gold futures up 1% pre market, vix was up almost 10% at one point
we retraced down to the .50 fib level, which was 1836. Now, going back up we can test the 1882 .618 fib level.
This war has been going on for decades and was temporary to the markets, as spy has almost fully recovered now.
The ongoing conflict in middle east should keep gold, oil and nat gas in bullish trend.
There are FOMC speakers this week as well, which will affect interest rates and DXY.
Cheers!

Daily [SLV] Report for Mon, 9/11/23Just thought I'd try posting a daily report. This is the first of hopefully many more. Let's see ow long I can do this. At some point, (hopefully soon), I will be placing a swing trade. That is lasting a week or two.

SLV Explosive Move coming, 66% probability - BullishA move similar to magnitude of Spring 2020 is lining up, with bullish tilt.
ready, set, GO!
The information and publications are not meant to be, and do not constitute, financial, investment, trading, or other types of advice or recommendations.

$SLV Ascending Triangle Chart PatternsAMEX:SLV Bullish Ascending Triangle Chart Pattern. A "bullish triangle pattern" is a continuation pattern commonly observed in technical analysis. It is formed by converging trend lines that connect a series of higher lows and relatively equal highs. This pattern indicates a temporary consolidation phase within an ongoing uptrend, often followed by a resumption of the upward movement. Here's how it works:
1. **Construction:** A bullish triangle pattern is created by drawing a trend line connecting higher lows and a horizontal resistance line connecting relatively equal highs.
2. **Converging Trend Lines:** As time progresses, the price movements within the triangle become confined within the converging trend lines, forming a contracting triangular shape.
3. **Decreasing Volatility:** The range between the higher lows and lower highs gradually narrows, indicating decreasing volatility and potential indecision among traders.
4. **Bullish Bias:** The bullish nature of this pattern is due to the formation occurring within an established uptrend. It suggests that despite the consolidation, buyers are still active, preventing a significant downward movement.
5. **Breakout:** Eventually, the price will reach the apex of the triangle, where the trend lines intersect. A breakout occurs when the price moves decisively above the horizontal resistance line, confirming the pattern.
6. **Target:** The breakout is usually accompanied by an increase in trading volume, signifying renewed interest. Traders often use the height of the triangle at its widest point as a guide to estimate the potential price move after the breakout.
It's important to note that while bullish triangle patterns can provide insights into potential price movements, they are not guaranteed to result in a specific outcome. False breakouts can occur, where the price initially moves beyond the resistance line but then reverses back into the triangle. To minimize risks, traders often wait for a confirmed breakout, consider using other technical indicators for confirmation, and implement proper risk management strategies.
Silver - 33 Moons [And An Options Opportunity](Using 3-Day candles for visibility only. Consult weekly/daily yourself)
I have an open call on Gold in that I believe a new high will be set, but it won't actually be bullish, because metals are going to dump pretty hard in the future and try to make retail sell their bullion.
Gold - When A New ATH Prints, Will You Get Trapped?
I hadn't paid a lot of attention to Silver and was on the sidelines until it dumped 10 percent this week, and now I believe there is a crazy good opportunity.
The problem with Gold is that the Chinese Communist Party bought a lot of it and they're going to get margin called or are the ones actually short selling.
The problem with silver is that there's not a lot of it left and it's really needed for technology.
When smart money wants to buy they accumulate at low prices and distribute at high prices. Often times what precedes the biggest moves are smaller moves that serve the purpose of wiping out and shaking out early short sellers and trapping retail traders who just love to buy high and sell low.
There's a lot of geopolitical risk in the world right now, as you can tell from the weekend "Prigozhin Coup," which I cover the implications of for the US Dollar here.
DXY - The US Petrdollar And The "Prigozhin Coup" In Russia
But the biggest geopolitical risk is what happens if Xi Jinping gets up one morning and dumps the CCP. Nobody believes this can happen and nobody is prepared for it.
But when it happens, it will implicate the whole world for both Xi and China to survive, they will have to weaponize the persecution of the 100 million practitioners of Falun Gong committed by the Jiang Zemin faction starting in 1999.
Since much of the world's financial sector and governments have dirtied themselves with Jiang in the persecution, when that day comes, it will mean that everything, everywhere is limit down. The liquidity will be gone, the algos will be off. Markets will no longer be made.
It is what it is.
In the meantime, nothing about what's going on with silver is bearish. Prices are low and it makes you want to sell, but it's actually a situation where you want to go long.
I believe that $21.20~ or $20.80 is what it's aiming for, and afterwards, the target will be at least $29.
So, what about options? One of the ways you can trade this move is calls on the SLV BlackRock ETF.
Getting in at $19~ and seeing a $10 move would push the ETF to at least $30.
There are two things that are significant about this:
1. Jan '24 at the money calls (based on the price right now) are $2.21
2. Average Implied volatility is only 24% and the 52W week low is 23.6% and the 52W high is 36%.
What this means is that calls are cheap and if iVol were to expand on a bull run from say 26% to 40% you'd pick up an extra ~$1 per contract on top of the strike gains.
The AGQ 2x Bull ETF has even more potential upside but it's a lot more risk and the swings are a lot more dramatic, for really obvious reasons.
All of this also means you can speculate in mining ETFs and individual miners. You need to use the underlying commodities as your metronome, though.
But this also means you'd have to be able to hold a winning position for 3 or 6 months.
You'd want to take profits at $27 and $29.
But if you get ahead of yourself and buy the $30+ high thinking that $50 and $100 and $500 are coming, you're likely to get seriously hurt.
Something is going to happen in this world between now and Q1 2024 and it's not going to be good news for the people lost in delusion wanting to have happy days and be a big baller.
Be careful, and happy trading.
