LTC/USD Potential BB Head FakeLTC/USD was getting Bollinger Band squeezed
by the consolidation of price between the .5 Fib
retracement area and the .236 retracement area
following the sharp drop in markets in mid May.
Now we see that the price has tried to break downward
out of the squeeze, implying what seems to be a bearish
bias only to bounce up off the .236 area and enter back
into the Bands. We could be witnessing a head fake, one
of John Bollinger's favorite indicators with the Bands,
leading to a sharp upwards movement.
Firstly, we need to be sure the 200 SMA
(purple line) isn't now being flipped from
support to resistance, potentially rejecting price
around $145 indicating we should head further down.
If it does turn to resistance and adds conviction
to the bearish bias, that's a big indication that it
would be most advantageous to stay away from
long positions.
We will see within a week or two if this head fake does
in fact play out and we get a nice walk up the bands with
targets at:
$174.81 (.382 Fib line, middle of range)
and
$221.85 (.5 Fib line, top of range)
Another thing to keep in mind is that we could just keep
squeezing for months after this head fake occurs before
making any truly definitive movements. It will be fun to
watch one way or another.
Sma

(NFA/DYOR) BTCUSD: 50/200 day SMA death cross doesn't worry meThis cycle has shown us something not seen in previous cycles; we've had two major mid-cycle crosses of the 50 day SMA below the 200 day SMA already. It doesn't necessarily mean that it's meaningless or worth completely ignoring, but what it does tell me is that there's a good chance this is not the end of the bull market and that the 50/200 day SMA death cross probably isn't the death sentence some may make it out to be. Considering the rapid pace at which we jumped from 20k to 60k, a mid-cycle correction after that hasty runup to consolidate a bit before heading up again doesn't sound out of the question to me.

Education excerpt: Simple Moving AverageSimple Moving Average (SMA)
The origin of inventing the Simple Moving Average (MA) is not clear. Although, some of the first documented cases of its use date as far back as the early 20th century. Implementation of moving averages in technical analysis is one of the most successful methods of identifying trends. Moving averages are simply constant period averages - usually of prices, that are calculated for each successive period interval. The result of calculation is then plotted on the chart as a smooth line that represents successive average prices. Thus, the calculation of the moving average dampens fluctuations of price of an asset, making it easier to spot an underlying trend. Though use of the moving average goes beyond identifying trends. Support, resistance and price extremes can be anticipated by correct interpretation of the moving average. Different lengths of moving average directly translate to the amount of data used in the calculation. Including more data in the calculation of the moving average makes each data per time interval relatively less important. Therefore, a large change in one particular data would not have as large an impact on the overall result of the calculation in comparison to if the moving average with a shorter period was employed. Hence, the longer moving average produces less false signals at the cost of revealing underlying trend sooner rather than later. Usually, the use of two moving averages with different period intervals is encouraged as opposed to use of a single moving average. This comes from the premise that when two moving averages with different period intervals are plotted on a chart, they tend to show two separate lines converging and diverging. Generally, when the moving average with a lower period interval crosses above the moving average with a higher period interval it is considered a bullish signal. On the other hand, when the moving average with a longer period interval crosses above the moving average with a lower period interval it is considered a bearish signal. These crossovers can serve as specific buy and sell signals in markets that are trending. However, moving average crossovers tend to produce many false signals in non-trending markets. Furthermore, these same crossovers can act as support or resistance levels.
Calculation and formula
The calculation of the moving average usually involves use of the close price. Normally, 10, 20, 50, 100 or 200 periods are used and the calculation is conducted by creating the arithmetic mean of a dataset.
SMA = (A1 + A2 + An) : n
A = average in period n
n = number of time periods
Illustration of weekly chart of DAI:
Red line = 50-day SMA
Green line = 20-day SMA
Disclaimer: This is just excerpt from our full text. This content is not intended to encourage buying or selling of any particular securities. Furthermore, it should not serve as basis for taking any trade action by individual investor. Your own due dilligence is highly advised before entering trade.

XVS-BTC - Is this thereversal for XVS (Venus) ?Is this the reversal for XVS ?
We received a daily buy signal for the XVS-BTC pair.
If we look left we also can see that we bounced back up from a double bottom.
I bought some more XVS this morning (for the long term) just before the 20EMA/50SMA cross up on the 1hour candles.
My targets:
.000846 (daily 200MA)
.001273 (.236 fib)
.001673 (.382 fib)
.001996 (.5 fib)
If we break the double bottom I will sell my XVS and buy it back at the next support level around 0002895
Don't forget to get profit or set alerts when we hit our targets.
You can always buy it back on a retrace. It will not go in one straight line to the next targets.
Also keep a close eye on BTC . If BTC starts to pump it is better to move some of your profits into BTC .
Your end goal should always be to increase your BTC amount.
Cheers and have fun.
° Be Patient – Don’t panic – Trade Emotionless.
° Never lose a winning trade. You can always get back in later.

BTC INVERTED : ReckoningBTC INVERTED 1DAY MACD (12, 26, 9)
Triangle
1 macd btc run start to macd ath
2 macd ath to macd atl
3 macd atl to macd btc run start
BTC INVERTED 1DAY HEIKIN-ASHI
Triangle
1 btc run start to btc macd ath
2 btc macd ath to btc 3/25/21 low, dotted extension to triangle top
3 btc macd atl to btc run start
Secondary Right Edge = 3/3/21 ATH to 3/20/21 peak, dotted extension
Colored Rays = btc run start to key highs/lows
INVERTED 1day 300 sma
// Durbtrade

BTC : ReckoningBTC 1DAY MACD (12, 26, 9)
Triangle
1 macd btc run start to macd ath
2 macd ath to macd atl
3 macd atl to macd btc run start
BTC 1DAY HEIKIN-ASHI
Triangle
1 btc run start to btc macd ath
2 btc macd ath to btc 3/25/21 low, dotted extension to triangle bottom
3 btc macd atl to btc run start
Secondary Right Edge = 3/3/21 ATH to 3/20/21 peak, dotted extension
Colored Rays = btc run start to key highs/lows
1day 300 sma
// Durbtrade

Bitcoin Daily AnalysisOn the 1 day chart, Bitcoin is now below the 200 and the 233 EMA . (yellow and orange)
The 20 SMA (pink) has met the consolidation triangle at the top of the current candle. Usually the price of bitcoin follows the 20 SMA closely if you look at the past price action.
Yesterday we had a bearish engulfing candle.
With the combination of these things, I would expect continuation to the downside today.

Bitcoin Consolidation ContinuesBitcoin consolidation continues within the triangle for now. Keep an eye on the 20 SMA.

Bitcoin 10 Hour ChartThe 10 hour chart on Bitcoin looks super bearish in my opinion. Price is below the cloud. The 50 SMA is pointing down and bitcoin hasn't been able to get back above the 50 SMA on hardly any of the hourly time frames.

300 SMABTC is going to bullish asap stay above 300 sma ( blue one) otherwise bearish season will be here.
SEE YOU IN NEXT YEAR :)

RAD LongWeekly Wave#2
SMA40 as support
Entry 18.6
Stop 15
Target 40
Risk management is much more important than a good entry point.
The max Risk of each plan should be less than 1% of an account.
I am not a PRO trader. I trade option to test my trading plan with small cost.

Bullish on dogecoin LONGStill feeling dogecoin here.
Simple moving average (SMA) suggest that we have a trend in my opinion.
Every indicator is reset, we have plenty of room to grow as most of the weak hands are now out. I immagine we have seen the worst of the dorps, but there could be further coils to 28 26 24..
do not fear, this game is just beginning. we are bullish long to 1 dollar by june, and potentially higher as the months roll on. I have 100$+ targets on dogecoins.

EPL ABOVE ALL MAJOR SMAsEPL’s share is trading above all major SMA’S EXCEPT 200 days SMA .
FURTHER it is hovering near the resistance level. It has taken the resistance at two important patterns i.e. the channel pattern and between two horizontal lines.
However the major volatility with the lower volumes in the last two trading days may stop the price from rising.
A positive opening with the higher volumes on the next trading session can be a good indication for price rise.
The stock is already trading above 5, 10,15,20,50,100 days SMA AND just short by 5.079 points from its 200 days SMA.
Disclaimer: - The view expressed here does not in any sense pursue anyone to trade in the above stock.
This is only for knowledge purpose. Person taking position in above stock will be personally responsible for the potential loss and will personally enjoy all the potential rewards.

DESCENDING WEDGENice descending wedge forming on 1D chart of BA. The confirmation might be over the low smas (9,20) and obviously a break out over the wedge resistance line. I am bullish for the next week and see big potential for this sector. Nice support on the 100sma. Just an amazing play it would be 😋😍

What will you do now, Bitcoin?*Even if* the bitcoin price keeps correcting downwards, as it has been recently, it could still easily bounce off the 200 SMA at around $39.4k and still retain a bullish structure - and go upwards from there, perhaps later in the year.
If however, Bitcoin's price fell through the 200 SMA, things could start to look a lot more bearish.
---------------
The most recent price of BTC at the time of writing is: $46903.85.
The 200 Simple Moving Average (SMA) is at: $39368.76.
The percentage distance from the latest BTC price and the 200 SMA is: 19.0%.
A coin with a price greater than its 200 SMA is more costly on average, and so this might be a good time to sell. However, this might be a part of a bullish trend where the price will continue even higher.
Average Candle Height (ACH) for BTC: 5.53%.
Average Candle Height is calculated as the average height of all candles (high - low) as a percentage of the high price. Bitcoin typically has about 5% ACH, while large market cap coins like Litecoin have around 8% ACH. Exceptionally volatile coins like 1INCH can have 15% ACH or more.
The number of 1d candles measured in this calculation were: 500.
---------------
Please like and follow if you'd like to see more content like this :)

SHILPAMED (NIFTY_500) CLOSING ABOVE ALL THE MAJOR SMA
SHILPAMED (NIFTY_500 ) Closing Price of 14/05/2021 has crossed all the major simple moving averages including 5, 10,15,20,50,100 Days.
The closing price is hovering near to its 200 days daily moving average which also act as major resistant for the stock.
There are very good chances that it would cross the 200 days SMA and can show a good rally.
Disclaimer: - The view expressed here does not in any sense pursue anyone to trade in the above stock. This is only for knowledge purpose. Person taking position in above stock will be personally responsible for the potential loss and will personally enjoy all the potential rewards.

BTT/USDT SHORT, Broke the support, weak RD-BINANCE:BTTUSDT has good potential to rise in long term according to fundamental statics , but technicals represent the continuous but short downward trend because it has broken the 0.38 Fib down and the next supports are SMA 500 and 0.23 Fibonacci.
You can see lower price tops but equal RSI tops. I consider this kind of a weak RD- , that approves the continuous downward trend.
Macd has broken the signal line down and RSI is weak. I'm waiting a little in order to let BTT get oversold in RSI then enter.
Note: It's not a financial signal, just my idea
Note: Bitcoin's recent bumps can affect altcoins so I suggest you check BINANCE:BTCUSDT charts, too.

DAX30 Potential Long This is one of the strategies I trade via OTTrades. My software has entered long at the price shown on the chart. If it moves against us and stops us out then so be it, there might be another couple of opportunities where the software will re-enter at a lower price, unless otherwise invalidated (I'll update this thread accordingly).
Ultimately, I'm expecting to take profits at the 50 SMA (shift 2)

FORTH - Is it worth investing in FORTH ?About FORTH (Ampleforth Governance Token Coin)
FORTH is the native governance token that powers Ampleforth, a protocol that automatically adjusts the supply of its native token, AMPL, in response to demand. FORTH holders can vote on proposed changes to the Ampleforth protocol or delegate their votes to representatives who vote on their behalf. It has a circulating supply of 8.3 Million FORTH coins (at the time of writing) and a max supply of 15 Million.
FORTH has been launched on April 21 2021 on Coinbase Pro and Binance and has also been airdropped to a lot of Ampleforth holders.
Current Market Cap is $315,258,838
When we calculate the price Market Cap of $315,258,838 divided by the current supply 8,294,858 then we end up around $38 (at the time of writing)
The Market Cap of FORTH will very easily go above 1 million. If we make then our calculation, FORTH will be worth more than $100
When we look at the chart FORTH-USDT we can see that FORTH has reached the support level around $37. If we drop below this support level we will probably see $32 again.
Wait for the reversal to get in. With this I mean, look at the 15minute and 1hour chart when 20ema crosses above the 50sma or when we break out of the descending triangle.
My targets for the long run:
° 42.317 (.382 fib)
° 45.520 (.5 fib)
° 48.722 (.618)
° 53.282 (.786)
° 55.996 (.886)
° 59.090 (1)
° 66.472 (1.272)
° 75.862 (1.618)
° 92.743 (2.24)
° 103.002 (2.618)
Don't forget to get profit or set alerts when we hit the next fib levels.
You can always buy it back when it tracing back. It will not go in one straight line up.
Also keep a close eye on BTC . If BTC starts to pump it is better to move some of your profits into BTC .
Your end goal should always be to increase your BTC amount.
Cheers and have fun.
° Be Patient – Don’t panic – Trade Emotionless.
° Never lose a winning trade. You can always get back in later.

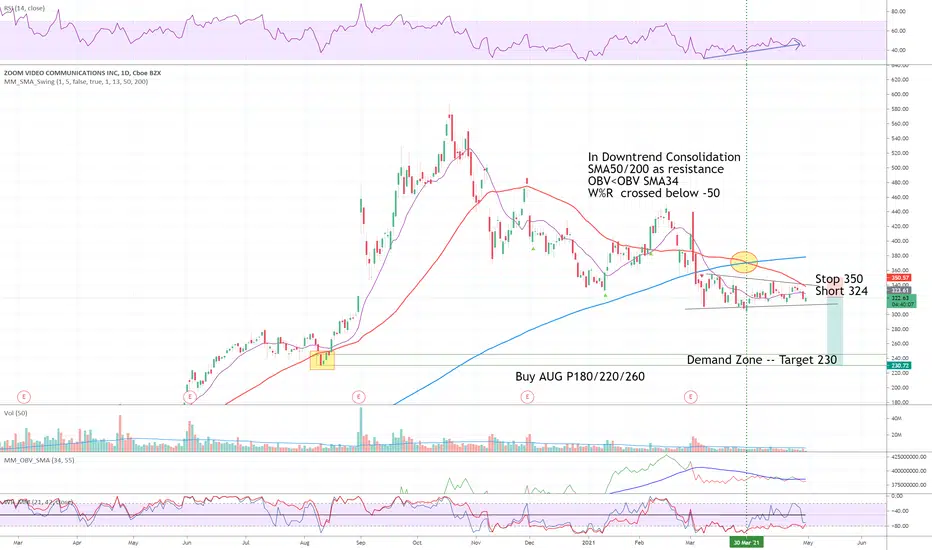
ZM ShortIn Downtrend Consolidation
SMA50/200 as resistance
OBV<OBV SMA34
W%R crossed below -50
Short 324
Stop 350
Target 230
I am not a PRO trader. I trade option to test my trading plan with small cost.
The max Risk of each plan should be less than 1% of an account.
What is up with Bitcoin ? key Points explained :)Hey guys
These are some key levels that we should pay more attention to, especially 41K-43K because there is a massive volume profile.
>>><<>Key points<><<<<<
1- This is the first time that the price closed a daily candle under the EMA (55) since the 10.5K break out.
2-This is the first time that we are observing a death cross between EMA(26) and EMA (13) Since 10.5K break out.
3-If we see a daily close under 50K then it confirmed a Lower Low for the first time in this bull run.
> >Trend is your friend < <
4- there is a CME gap ( check the Ticker BTC1 ) around 57K-59K. Watch out !!!!!

bitcoin in crazy placethe chart is all over the place right now , The 20 and 50 day sma say its possible it could cross positive and up and ichi moku cloud doesnt quite say that . The stoch rsi and rsi also have some ability to go up but its been a weird 4 days in general .

